Development of novel topical tranexamic acid liposome formulations
Development of novel topical tranexamic acid liposome formulations
Development of novel topical tranexamic acid liposome formulations

You also want an ePaper? Increase the reach of your titles
YUMPU automatically turns print PDFs into web optimized ePapers that Google loves.
A. Manosroi et al. / International Journal <strong>of</strong> Pharmaceutics 235 (2002) 61–70 65and derivatized, following the procedures as describedin the analytical method section, prior toassay by spectrophotometer. The loading <strong>of</strong> TAin <strong>liposome</strong>s was also calculated. Each samplewas prepared in two lots and the experimentswere performed in duplicates.2.5. Analytical method for the determination <strong>of</strong>TA contentThe TA content in <strong>liposome</strong> <strong>formulations</strong> wasdetermined spectrophotometrically at 415 nm(Milton Roy Spectronic 1001 Plus, Rochester,NY), following derivatization with 2,4,6-trinitrobenzosulfonic<strong>acid</strong> (Atmaca, 1989). The colorreagent used was 1.68% (w/v) 2,4,6-trinitrobenzosulfonic<strong>acid</strong> solution in DI water, freshly preparedand protected from light, prior to use. Each0.1 ml <strong>of</strong> working standard solutions or sampleswas spiked with 0.25 ml <strong>of</strong> 0.025 M disodiumtetraborate solution (pH 10) and 0.25 ml <strong>of</strong> colorreagent, prior to standing at 25 °C for 30 min.The solution was then diluted to 5.0 ml with 0.1M potassium dihydrogen phosphate solution (pH4.5). The solution mixture in the absence <strong>of</strong> TAwas used as a blank. A calibration graph wasconstructed, by plotting the concentrations <strong>of</strong> TAagainst the absorbance values. The linearity <strong>of</strong>assay was determined from five working standardsolutions <strong>of</strong> TA in DI water (concentrations: 4.0–20.0 g/ml), prepared in triplicates. The correlation(r 2 ), intercept and slope <strong>of</strong> the calibrationgraph were calculated. The absorbance values <strong>of</strong>samples were observed and compared with thoseobtained from the calibration graph, to determinethe amount <strong>of</strong> TA in samples. This experimentwas performed in duplicates <strong>of</strong> three lots <strong>of</strong>samples.3. Results3.1. Physical appearances and pH <strong>of</strong> <strong>liposome</strong>sThe appearances and pH <strong>of</strong> various <strong>liposome</strong><strong>formulations</strong>, DI water, 5 and 10% TA solutionsin DI water are shown in Table 2. The neutral 7:2,7:2(5%TA) and 7:2(10%TA) <strong>liposome</strong>s showedsedimentation, following storage at 4 °C for 24 h(Table 2). Thus, the charged <strong>liposome</strong>s {7:2:1(+),7:2:1(5%TA, +), 7:2:1(10%TA, +), 7:2:1(−),7:2:1(5%TA, −) and 7:2:1(10%TA, −)} demonstratingfavorable physical appearances (no sedimentation)were selected for further experiments(Table 2). The pH values <strong>of</strong> both positively andnegatively charged <strong>liposome</strong> <strong>formulations</strong> withthe entrapped TA (pH 6.9–8.0) were higher thanTable 2Physical appearances and pH <strong>of</strong> various <strong>liposome</strong> <strong>formulations</strong>,DI water, 5 and 10% TA solutions in DI waterFormulations Appearances pH a7:2 Translucent, white ND b7:2(5%TA)7:2(10%TA)dispersion withsedimentationTranslucent, whitedispersion withsedimentationTranslucent, whiteND bND b7:2:1(+)7:2:1(5%TA, +)dispersion withsedimentationTranslucent, whitedispersion, nosedimentationTranslucent, white7.590.067.920.027:2:1(10%TA, +)dispersion, nosedimentationTranslucent, white 7.860.037:2:1(−)dispersion, nosedimentationTranslucent, white 3.40.1dispersion, nosedimentation7:2:1(5%TA, −)7:2:1(10%TA, −)DI waterTranslucent, whitedispersion, nosedimentationTranslucent, whitedispersion, nosedimentationClear solution6.900.097.120.0066.300.065% TA in DI water Clear solution 7.510.0310% TA in DI water Clear solution 7.570.01Physical appearances <strong>of</strong> samples were visually observed, followingstorage at 4 °C for 24 h. pH was measured immediatelyafter sample preparation.aExperimental data represent the meanSD <strong>of</strong> three determinations.b ND, not determined.
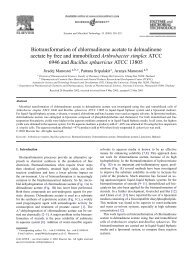
66A. Manosroi et al. / International Journal <strong>of</strong> Pharmaceutics 235 (2002) 61–70Table 3Particle sizes <strong>of</strong> six <strong>liposome</strong> <strong>formulations</strong>FormulationsParticle size (m) a7:2:1(+) 17.90.57:2:1(5%TA,+)17.50.57:2:1(10%TA,+)35.80.57:2:1(−)24.780.047:2:1(5%TA, −)2.760.027:2:1(10%TA, −)2.050.03Particle sizes <strong>of</strong> <strong>liposome</strong> <strong>formulations</strong> were measured 10 daysafter sample preparation (kept at 4 °C).aExperimental data represent the meanSD <strong>of</strong> six determinations.that <strong>of</strong> DI water (pH 6.3), except the blank negative<strong>liposome</strong> {7:2:1(−)} (pH 3.4, Table 2). Thus,the incorporation <strong>of</strong> TA in <strong>liposome</strong>s may increasepH <strong>of</strong> the system.3.2. Liposome size, morphology and lamellarity <strong>of</strong><strong>liposome</strong>sThe particle sizes <strong>of</strong> six <strong>liposome</strong> <strong>formulations</strong>are presented in Table 3. The 7:2:1(+), 7:2:1(−),7:2:1(5%TA, +) and 7:2:1(10%TA, +) <strong>liposome</strong>sdemonstrated bimodal distribution <strong>of</strong> particlesize and larger particle size (10 times) thanthe negatively charged <strong>liposome</strong>s with the entrappeddrug. The smallest size <strong>of</strong> 2.05 m wasobserved in the 7:2:1(10%TA, −) <strong>liposome</strong>. All<strong>liposome</strong> <strong>formulations</strong> demonstrated log-normaldistribution <strong>of</strong> particle size, ranging between 2.0and 35.8 m (Table 3). The transmission electronmicrographs <strong>of</strong> the blank 7:2:1(+), 7:2:1(5%TA,+) and 7:2:1(5%TA, −) <strong>liposome</strong>s, showing themorphology and lamellarity <strong>of</strong> <strong>liposome</strong>s areshown in Fig. 1. The lamellarity <strong>of</strong> about 8–15bilayers (multilamellar vesicles) was observed inall <strong>liposome</strong> <strong>formulations</strong> (Fig. 1).3.3. Glass transition temperature, transitiontemperature and enthalpy <strong>of</strong> transitionThe glass transition temperatures <strong>of</strong> HSC,CHL, SA, DCP, TA, 7:2:1(10%TA, +) and7:2:1(10%TA, −) <strong>liposome</strong> <strong>formulations</strong> are presentedin Table 4. The results indicated that allsamples were decomposed at high temperature(200 °C), except SA which decomposed atlower than 200 °C. The T c and H values <strong>of</strong>HSC, CHL, SA, DCP, TA, 7:2:1(+),7:2:1(5%TA, +), 7:2:1(10%TA, +), 7:2:1(−),7:2:1(5%TA, −) and 7:2:1(10%TA, −) <strong>liposome</strong><strong>formulations</strong> are summarized in Table 5. Underthe experimental conditions, there was no peak <strong>of</strong>TA observed in the DSC thermogram.3.4. Tranexamic <strong>acid</strong> entrapped in <strong>liposome</strong>sThe calibration graph <strong>of</strong> TA solution in DIwater was shown to be linear (r 2 =0.9937), overthe concentration range 4.0–20.0 g/ml. The regressionequation was as follows: y=20.7903x−0.1942, where y is the concentration <strong>of</strong> TA(g/ml) and x is the absorbance <strong>of</strong> the derivative<strong>of</strong> TA formed with 2,4,6-trinitrobenzosulfonic<strong>acid</strong> (mAU*s). The percentages <strong>of</strong> TA recoveredfrom the <strong>liposome</strong> <strong>formulations</strong> with the entrappeddrug, using spectrophotometric assayvaried between 91.4 and 104.7%. The other componentsin <strong>liposome</strong> <strong>formulations</strong> neither reactedwith the color reagent nor demonstrated significantabsorption at 415 nm. The percentages <strong>of</strong>TA entrapped in <strong>liposome</strong>s, the free drug and theloading <strong>of</strong> TA in <strong>liposome</strong> <strong>formulations</strong> areshown in Table 6.4. DiscussionThe charged <strong>liposome</strong>s with and without theentrapped TA, showing no sedimentation followingstorage at 4 °C for 1 day, may indicate betterphysical stability than the neutral <strong>liposome</strong>s(Table 2). This may be associated with the effects<strong>of</strong> charges on the surface <strong>of</strong> <strong>liposome</strong>s. TA is asynthetic amino <strong>acid</strong>, which has amino and carboxylicgroups. When TA dissolves in water, itwill ionize in equilibrium Eq. (1):C 8 H 15 NO 2 +H 2 O C 8 H 16 NO 2+ +OH − (1)The pH <strong>of</strong> samples increased when TA was incorporatedinto the <strong>liposome</strong> systems (Table 2). Thismay be due to the effect <strong>of</strong> concentration <strong>of</strong>
A. Manosroi et al. / International Journal <strong>of</strong> Pharmaceutics 235 (2002) 61–70 67hydroxyl ion (Eq. (1)). TA in DI water appearedto have weak positive charges (Eq. (1)). The positivelycharged <strong>liposome</strong>s with the entrapped TAdemonstrated higher pH values than those withoutthe entrapped drug (Table 2). The entrappedTA may provide more hydroxyl ions to the <strong>liposome</strong>dispersion sample (Eq. (1)). Similarly, thenegatively charged <strong>liposome</strong>s with the entrappedTA showed higher pH values than the blanknegative <strong>liposome</strong> (Table 2).SA and DCP are amphiphilic compounds, andthey may ionize when incorporated into the <strong>liposome</strong>sand aqueous environments, as shown in thefollowing equations:C 18 H 39 N+H 2 O C 18 H 40 N + +OH − (2)C 32 H 67 O 4 P+H 2 O C 32 H 66 O 4 P − +H 3 O + (3)The positively charged <strong>liposome</strong>s received hydroxylion from SA (Eq. (2)), whereas the negativelycharged <strong>liposome</strong>s received hydronium ionfrom DCP (Eq. (3)). Thus, all positively charged<strong>liposome</strong>s (pH 7.6–7.9) exhibited higher pH valuesthan all negatively charged ones (pH 3.4–7.1,Table 2). Hydronium ion from DCP (Eq. (3)) maybe neutralized by hydroxyl ion, resulting from theionization <strong>of</strong> TA (Eq. (1)).SA and DCP incorporated into the liposomalbilayer membranes render the surface electricallyFig. 1. Transmission electron micrographs <strong>of</strong> the: (a) blank 7:2:1(+) <strong>liposome</strong>s (6000×); (b) 7:2:1(5%TA, +) <strong>liposome</strong>s (5000×);(c) 7:2:1(5%TA, −) <strong>liposome</strong>s (6000×).
68A. Manosroi et al. / International Journal <strong>of</strong> Pharmaceutics 235 (2002) 61–70Table 4Glass transition temperatures <strong>of</strong> HSC, CHL, SA, DCP, TA,7:2:1(10%TA, +) and 7:2:1(10%TA, −) <strong>liposome</strong> <strong>formulations</strong>FormulationsHSC257.77CHL246.66SA 162.22DCP218.47TA223.637:2:1(10%TA, +) 222.227:2:1(10%TA, −) 229.63Glass transition temperature (°C)like charges. This results in a repulsion and hence,an increase in the distance between different bilayers(Benita et al., 1984). Similar charges <strong>of</strong> lipidbilayers to the entrapped TA can increase thedistance between bilayers, as observed in the positivelycharged <strong>liposome</strong>s with large particle size(17.5–35.8 m, Table 2). In contrast, the negativecharges <strong>of</strong> lipid bilayers, opposite to the charges<strong>of</strong> entrapped TA will decrease the distance (<strong>liposome</strong>size: 2.0–2.8 m), due to the neutralization<strong>of</strong> charges (Table 2). Thus, the smallest particlesize was observed in the negative <strong>liposome</strong> withthe entrapped TA concentration <strong>of</strong> 10% (Table 2).Table 5Transition temperatures and enthalpy <strong>of</strong> transition <strong>of</strong> HSC,CHL, SA, DCP, TA, 7:2:1(+), 7:2:1(5%TA, +),7:2:1(10%TA, +), 7:2:1(−), 7:2:1(5%TA, −) and7:2:1(10%TA, −) <strong>liposome</strong> <strong>formulations</strong>FormulationsTransitiontemperature ( °C)Enthalpy <strong>of</strong>transition (J/g)HSC61.20.4 38.59.8CHL149.70.2 66.61.0SA57.10.6 293.753.0DCP79.30.2 187.01.87:2:1(+) 77.80.4 50.07.37:2:1(5%TA, +) 76.20.4 11.80.37:2:1(10%TA, +) 77.11.18.32.47:2:1(−)70.00.5 45.410.67:2:1(5%TA, −) 71.30.5 14.72.87:2:1(10%TA, −) 70.80.56.33.2There was no peak <strong>of</strong> TA observed in the DSC thermogram.Experimental data represent the meanSD <strong>of</strong> six determinations.The T c values <strong>of</strong> the positively and negativelycharged <strong>liposome</strong> <strong>formulations</strong> with and withoutthe entrapped TA were broadly comparable(70.8–77.1 °C vs. 70.0–77.8 °C). However, theH values <strong>of</strong> blank positively and negativelycharged <strong>liposome</strong> <strong>formulations</strong> were higher(45.4–50.0 J/g) than those <strong>of</strong> the respective <strong>formulations</strong>with the entrapped drug (6.3–14.7 J/g,Table 5). This may indicate that TA was entrappedin the aqueous layer <strong>of</strong> the charged <strong>liposome</strong>s.TA may interfere with the formation <strong>of</strong>lipid bilayers, thereby reducing the H values <strong>of</strong><strong>liposome</strong> <strong>formulations</strong>. The higher the entrappedTA concentration in <strong>liposome</strong>s, the more markedreduction <strong>of</strong> H was observed (Table 5). TA didnot exhibit T c and H, when scanned in the range<strong>of</strong> 20–200 °C, indicating high thermal stability <strong>of</strong>this drug.All <strong>liposome</strong> <strong>formulations</strong> with and without theentrapped TA exhibited an endothermic peak,with an average maximum peak <strong>of</strong> T c (70.0–77.8 °C) higher than HSC (61.2 °C, Table 5).This may indicate that cholesterol incorporatedinto the liposomal membrane had its hydroxylgroup oriented towards the aqueous layer, withthe aliphatic chain aligned parallel to the acylchains in the center <strong>of</strong> lipid bilayers. The presence<strong>of</strong> rigid steroid nuclei along side the first 10 or so<strong>of</strong> carbons <strong>of</strong> the phosphatidylcholine chain <strong>of</strong>HSC may reduce the freedom <strong>of</strong> movement. Thismay result in an enhanced stability <strong>of</strong> the liposomalmembrane, and hence the high T c value <strong>of</strong><strong>liposome</strong> <strong>formulations</strong>.Reaction between TA and 2,4,6-trinitrobenzosulfonic<strong>acid</strong> in alkaline condition forms a yellowcolor compound, with the maximum absorptionspectrum <strong>of</strong> 415 nm (Atmaca, 1989). The optimumcondition for the reaction to occur is asfollows: pH 10 at 25 °C for 30 min. The 0.1 Mpotassium dihydrogen phosphate buffer solution(pH 4.5) was added to terminate the reaction. Theintensity <strong>of</strong> color was relatively stable in the reactionmedium, for at least 3 h when protected fromlight.The percentages <strong>of</strong> TA entrapped in all <strong>liposome</strong><strong>formulations</strong> varied between 13.2 and 15.6%(Table 6). There were no significant differences inthe percentages <strong>of</strong> entrapment <strong>of</strong> TA between
A. Manosroi et al. / International Journal <strong>of</strong> Pharmaceutics 235 (2002) 61–70 69Table 6Percentages <strong>of</strong> entrapment <strong>of</strong> TA, free TA, and the amount <strong>of</strong> TA per total lipid in <strong>liposome</strong> <strong>formulations</strong>FormulationsForm <strong>of</strong> drug% EntrapmentLoading <strong>of</strong> TA (g/mg lipid) a7:2:1(5%TA, +)Total drug 100.0–Entrapped drug14.70.6275.213.9Free drug85.30.2 –7:2:1(10%TA, +) Total drug100.0 –Entrapped drug15.00.4627.010.8Free drug85.00.9 –7:2:1(5%TA, −) Total drug100.0–Entrapped drug 15.60.7 290.45.7Free drug84.52.6 –7:2:1(10%TA, −) Total drug 100.0 –Entrapped drug 13.20.3 547.313.6Free drug86.80.3 –Experimental data represent the meanSD <strong>of</strong> four determinations.a Total lipid in 1 ml <strong>of</strong> <strong>liposome</strong> dispersion sample was 25 mg.different <strong>formulations</strong> (Table 6), as analyzed byANOVA (P0.05). This may indicate that thecharges and TA concentrations did not affect thepercentages <strong>of</strong> TA entrapped in <strong>liposome</strong> <strong>formulations</strong>.The negatively charged <strong>liposome</strong> whichhad opposite charged to TA (weak positive) mayimprove the entrapment <strong>of</strong> drug in the <strong>liposome</strong>s.On the other hand, the positively charged <strong>liposome</strong>swith the entrapped drug demonstratedlarger particle size, and hence larger volume forthe entrapment <strong>of</strong> drug than the negative <strong>liposome</strong>s(Benita et al., 1984). These phenomena mayexplain why the percentages <strong>of</strong> entrapment <strong>of</strong> TAin the positive and negative <strong>liposome</strong>s werebroadly comparable (14.7–15.0% vs. 13.2–15.6%,Table 6).The loading <strong>of</strong> TA in the charged <strong>liposome</strong>sincreased, as the initial concentration <strong>of</strong> drugincreased, from 275 g/mg lipid {7:2:1(5%TA,+)} to 627 g/mg lipid {7:2:1(10%TA, +)}, andfrom 290 g/mg lipid {7:2:1(5%TA, −)} to 547g/mg lipid {7:2:1(10%TA, −)} (Table 6, Foldvariet al., 1993).In conclusion, the <strong>liposome</strong>s composed <strong>of</strong>HSC/CHL/charged lipids at molar ratios <strong>of</strong>7:2:1(+) and 7:2:1(−) with the entrapped TA (5and 10% solutions in DI water) were demonstratedas multilamellar vesicles. Thus, TA wasadvantageous when entrapped in <strong>liposome</strong>, sincethis drug delivery system can potentitally reducethe skin irritation and improve moisturizing effect.The particle sizes <strong>of</strong> all <strong>liposome</strong> <strong>formulations</strong>,with and without the entrapped TA were inthe range <strong>of</strong> 2.05–35.8 m, with the smallest sizewas observed in the negative <strong>liposome</strong> with theentrapped TA concentration <strong>of</strong> 10%. The charged<strong>liposome</strong>s with the entrapped TA demonstratedhigh physical stability. The concentrations <strong>of</strong> TAappeared to affect the pH, particle size and enthalpy<strong>of</strong> transition <strong>of</strong> <strong>liposome</strong> <strong>formulations</strong>,whereas charges seemed to affect the physicalstability, pH and particle size <strong>of</strong> <strong>liposome</strong>s. Thebest formulation was concluded to be the negativelycharged 7:2:1(10%TA, −) <strong>liposome</strong>, whichexhibited high physical stability, small particle sizeand relatively high percentage <strong>of</strong> drug entrapment.This formulation will be further evaluatedfor release study. Overall, it has been demonstratedthat TA which is a hydrophilic drug canbe favorably entrapped in <strong>liposome</strong>s.AcknowledgementsThe authors thank Dr Kuncoro Foe for hisassistance in the preparation <strong>of</strong> the manuscript.We also acknowledge JJ-Degussa (T) Ltd., Thailandfor the gifts <strong>of</strong> Emulmetik 950 ® , and Thistle