Homework Assignment 3
Homework Assignment 3
Homework Assignment 3
- No tags were found...

You also want an ePaper? Increase the reach of your titles
YUMPU automatically turns print PDFs into web optimized ePapers that Google loves.
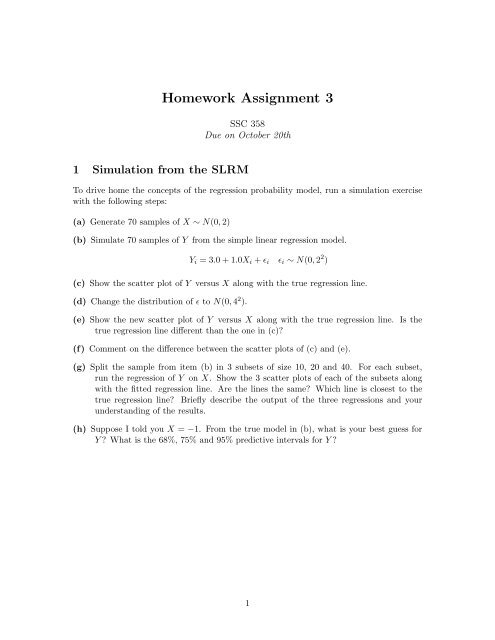
<strong>Homework</strong> <strong>Assignment</strong> 3SSC 358Due on October 20th1 Simulation from the SLRMTo drive home the concepts of the regression probability model, run a simulation exercisewith the following steps:(a) Generate 70 samples of X ∼ N(0, 2)(b) Simulate 70 samples of Y from the simple linear regression model.Y i = 3.0 + 1.0X i + ɛ i ɛ i ∼ N(0, 2 2 )(c) Show the scatter plot of Y versus X along with the true regression line.(d) Change the distribution of ɛ to N(0, 4 2 ).(e) Show the new scatter plot of Y versus X along with the true regression line. Is thetrue regression line different than the one in (c)?(f) Comment on the difference between the scatter plots of (c) and (e).(g) Split the sample from item (b) in 3 subsets of size 10, 20 and 40. For each subset,run the regression of Y on X. Show the 3 scatter plots of each of the subsets alongwith the fitted regression line. Are the lines the same? Which line is closest to thetrue regression line? Briefly describe the output of the three regressions and yourunderstanding of the results.(h) Suppose I told you X = −1. From the true model in (b), what is your best guess forY ? What is the 68%, 75% and 95% predictive intervals for Y ?1
3 The Multiple Linear Regression ModelSuppose we are modeling house price as depending on house size, the number of bedroomsin the house and the number of bathrooms in the house. Price is measured in thousands ofdollars and size is measured in thousands of square feet.Suppose our model is:P = 20 + 50 size + 10 nbed + 15 nbath + ɛ, ɛ ∼ N(0, 10 2 ).(a) Suppose you know that a house has size =1.6, nbed = 3, and nbath =2.What is the distribution of its price given the values for size, nbed, and nbath.(hint: it is normal with mean = ?? and variance = ??)(b) Given the values for the explanatory variables from part (a), give the 95% predictiveinterval for the price of the house.(c) Suppose you know that a house has size =2.6, nbed = 4, and nbath =3. Give the95% predictive interval for the price of the house.(d) In our model the slope for the variable nbath is 15.number?What are the units of this(e) What are the units of the intercept 20? What are the units of the the error standarddeviation 10?3
4 Profits...For this problem us the data is the file Profits.csv.There are 18 observations.Each observation corresponds to a project developed by a firm.y = Profit: profit on the project in thousands of dollars.x1= RD: expenditure on research and development for the project in thousands of dollars.x2=Risk: a measure of risk assigned to the project at the outset.We want to see how profit on a project relates to research and development expenditureand “risk”.(a) Plot profit vs. each of the two x variables. That is, do two plots y vs. x1 and yvs x2. You can’t really understand the full three-dimensional relationship from thesetwo plots, but it is still a good idea to look at them. Does it seem like the y is relatedto the x’s?(b) Suppose a project has risk=7 and research and development = 76. Give the 95%plug-in predictive interval for the profit on the project. Compare that to the correct,predictive interval (using the predict function in R).(c) Suppose all you knew was risk=7. Run the simple linear regression of profit on riskand get the 68% plug-in predictive interval for profit.(d) How does the size of your interval in (c) compare with the size of your interval in (b)?What does this tell us about our variables?4
5 Zagat...The data for this question is in the file zagat.csv . The data is from the Zagat restaurantguide. There are 114 observations and each observation corresponds to a restaurant.There are 4 variables:price: the price of a typical mealfood: the zagat rating for the quality of food.service: the zagat rating for the quality of service.decor: the zagat rating for the quality of the decor.We want to see how the price of a meal relates the quality characteristics of the restaurantexperience as measured by the variables food, service, and decor.(a) Plot price vs. each of the three x’s. Does it seem like our y (price) is related to thex’s (food, service, and decor) ?(b) Suppose a restaurant has food = 18, service=14, and decor=16. Run the regressionof price on food, decor, and service and give the 95% predictive interval for the priceof a meal.(c) What is the interpretation of the coefficient estimate for the explanatory variable foodin the multiple regression from part (b) ?(d) Suppose you were to regress price on the one variable food in a simple linear regression?What would be the interpretation of the slope? Plot food vs. service. Is there arelationship? Does it make sense? What is your prediction for how the estimatedcoefficient for the variable food in the regression of price on food will compare to theestimated coefficient for food in the regression of price on food, service, and decor?Run the simple linear regression of price on food and see if you are right! Why arethe coefficients different in the two regressions?(e) Suppose I asked you to use the multiple regression results to predict the price of ameal at a restaurant with food = 20, service = 3, and decor =17. How would you feelabout it?5