PDF - Digital Imaging and Remote Sensing Laboratory - Rochester ...
PDF - Digital Imaging and Remote Sensing Laboratory - Rochester ...
PDF - Digital Imaging and Remote Sensing Laboratory - Rochester ...

You also want an ePaper? Increase the reach of your titles
YUMPU automatically turns print PDFs into web optimized ePapers that Google loves.
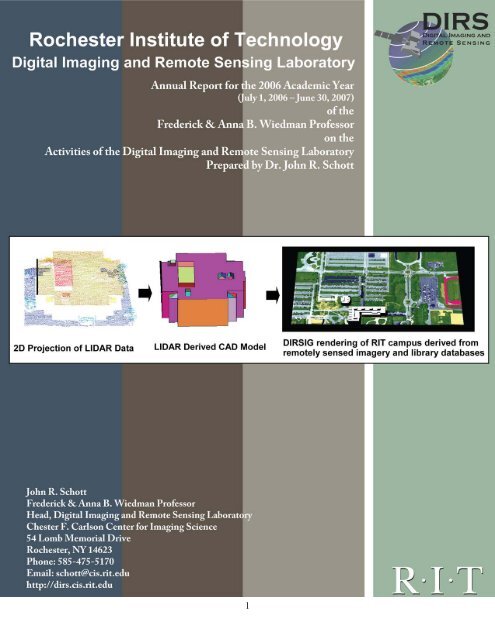
1.0 ForwardWhen I look back on this year, it is with a sigh of relief <strong>and</strong> a heart full of thanks. The relief isover the final release of the second edition of my book, <strong>Remote</strong> <strong>Sensing</strong>: The Image ChainApproach. This project which included the expansion from 394 to 666 pages <strong>and</strong> 10 to 14chapters was a major multiyear effort squeezed on top of my normal commitments. The thanks isfor all the help I had both inside DIRS <strong>and</strong> from the many professionals I leaned on across thecommunity for materials, insight <strong>and</strong> help with reviews. The biggest thanks goes to the DIRSteam who have helped both directly <strong>and</strong> indirectly. The thanks for the direct help on graphics,illustration, organization, etc. are acknowledged in the book <strong>and</strong>, while I reiterate them here, Ireally want to emphasize the often unacknowledged help of all the staff who helped fill in for myabsence or distraction during this period.The DIRS team has grown enormously in the last few years not so much in number but incapabilities <strong>and</strong> accomplishments many of which you will see reflected in these pages. We wereparticularly pleased this year to have Dr. David Messinger promoted to Research Faculty inacknowledgement of his growing role in publications, grantsmanship <strong>and</strong> student mentoring.Dave’s membership brings the number of faculty in DIRS to five <strong>and</strong> helps spread the studentmentoring, program development <strong>and</strong> management load across a larger more diverse team. It isthis diversity of programs directions, sponsors <strong>and</strong> student opportunities that I encourage you toexamine as you peruse these pages. We are striving to maintain our focus on quantitativeanalytical (physics based) remote sensing while exploring a broad range of sensing modalities<strong>and</strong> mission driven applications. The increased number of principle investigators, both amongthe faculty <strong>and</strong> staff, is enabling this increased diversification. Many of the staff are participatingin program development <strong>and</strong> more direct student mentoring allowing us to not only respondmore effectively to sponsors needs but also to provide a more enriching experience for ourstudents.In stepping up to help me over these last few years this team has gone beyond stepping up <strong>and</strong>truly has stepped out both as individuals <strong>and</strong> as a team. I believe we are on the brink of takingthe DIRS research enterprise to a new level reflecting the diversity of talents we have broughttogether while maintaining, I hope, the very close interconnected team based approach built onshared goals <strong>and</strong> values.The pages which follow offer a glimpse into the people <strong>and</strong> programs that made up the DIRS<strong>Laboratory</strong> over this past year. The program descriptions are only intended to give you a glimpseinto this activity <strong>and</strong> we invite you to contact us or follow the literature references for a more indepth treatment of any topic. The staff to whom I owe so much this year, as always, areintroduced in Section 2 of this report. Also in Section 2, we introduce our raison d’art, thestudents who sometimes frustrate <strong>and</strong> more often inspire our collective enterprise.In closing, I want to acknowledge once again the generosity of Frederick Wiedman Jr. whosegifts to the Institute in honor of his parents Frederick <strong>and</strong> Anna B. Wiedman endowed thechaired professorship I hold. The income from this endowment enables us to occasionally fund asmall amount of exploratory research until we can identify external support for these studies. The4
facility/process modeling study described in Section 4.2 exemplifies this process where theWiedman endowment is helping to support one of the students’ who is working to explore thisnew direction for the DIRS group. At many points during the year I stop to acknowledge the helpthat Mr. Wiedman’s generosity has enabled <strong>and</strong> this year in particular it has been focused on thisexciting new project.As ever my thanks to our sponsors for your confidence in us <strong>and</strong> the DIRS faculty, staff <strong>and</strong>students for making this another very successful year.John R. Schott, Frederick <strong>and</strong> Anna B. Wiedman ProfessorHead, <strong>Digital</strong> <strong>Imaging</strong> <strong>and</strong> <strong>Remote</strong> <strong>Sensing</strong> <strong>Laboratory</strong>Chester F. Carlson Center for <strong>Imaging</strong> Science<strong>Rochester</strong> Institute of Technology5
2.0 DIRS Group2.1 BackgroundThe <strong>Digital</strong> <strong>Imaging</strong> <strong>and</strong> <strong>Remote</strong> <strong>Sensing</strong> (DIRS) <strong>Laboratory</strong> is a research group within theChester F. Carlson Center for <strong>Imaging</strong> Science. Our work focuses on the development ofhardware <strong>and</strong> software tools to facilitate the extraction of information from remotely senseddata <strong>and</strong> the education of students who will continue this work for government agencies <strong>and</strong>private industry.The DIRS group is made up of faculty <strong>and</strong> research staff working with over 30 studentsranging from the Baccalaureate through Doctoral level. Most students are degree c<strong>and</strong>idatesin <strong>Imaging</strong> Science, but students from other departments, such as Engineering <strong>and</strong> Physics,are often part of the student population supporting our research initiatives. This year alsosaw the inclusion of several high school interns who were provided the opportunity toparticipate in research projects <strong>and</strong> learn more about imaging science.2.2 <strong>Laboratory</strong> OrganizationThe DIRS Lab is managed using a matrix approach where faculty <strong>and</strong> senior research staffmanage programs to generate research results, student thesis <strong>and</strong> meet sponsor requirements.The research staff, organized into three overlapping groups managed by group leaders,supports the needs of the research programs.Program Management<strong>and</strong> DevelopmentMr. Michael RichardsonLab HeadDr. John R. Schott<strong>Remote</strong> <strong>Sensing</strong>Faculty of the Centerfor <strong>Imaging</strong> ScienceModeling <strong>and</strong>Simulation GroupMr. Scott BrownPhenomenology <strong>and</strong>Algorithms GroupDr. David MessingerMeasurements <strong>and</strong>Experiments GroupMr. Michael RichardsonThe <strong>Laboratory</strong> of <strong>Imaging</strong> Algorithms <strong>and</strong> Systems (LIAS) is a “sister” laboratory withinthe Center for <strong>Imaging</strong> Science which also conducts remote sensing research focused onairborne imaging system development <strong>and</strong> user applications. DIRS <strong>and</strong> LIAS have severaljoint endeavors.6
2.3 DIRS PersonnelThe Faculty TeamDr. Carl SalvaggioAssociate ProfessorResearch Interests:- Novel techniques <strong>and</strong> devices for optical propertymeasurement- Applied image processing <strong>and</strong> algorithmdevelopment- Image simulation <strong>and</strong> modelingContact Information:salvaggio@cis.rit.edu 585-475-6380Dr. John R. SchottProfessor <strong>and</strong> DIRS <strong>Laboratory</strong> HeadResearch Interests:- Hyperspectral data analysis <strong>and</strong> algorithmdevelopment- Multi <strong>and</strong> hyperspectral instrument development- Synthetic scene generationContact Information:schott@cis.rit.edu 585-475-5170Dr. John KerekesAssociate ProfessorResearch Interests:- Image processing <strong>and</strong> algorithm research- Image chain modeling <strong>and</strong> parametric analysisContact Information :kerekes@cis.rit.edu 585-475-6996Dr. Anthony VodacekAssociate ProfessorResearch Interests:- Environmental applications of remote sensing- Forest fire detection <strong>and</strong> monitoring- Active <strong>and</strong> passive sensing of water qualityContact Information:vodacek@cis.rit.edu 585-475-7816Dr. David MessingerResearch FacultyResearch Interests:- Image processing <strong>and</strong> algorithm researchContact Information :messinger@cis.rit.edu 585-475-45387
The Research StaffMODELING AND SIMULATIONScott Brown - ScientistGroup Lead, Modeling <strong>and</strong> Simulation(585) 475-7194 brown@cis.rit.eduDavid Pogorzala - Assistant ScientistModeling <strong>and</strong> Phenomenology Research(585) 475-5388 pogo@cis.rit.eduNiek S<strong>and</strong>ers - Junior Software Dev.Simulation Software Development <strong>and</strong>Simulation Researchs<strong>and</strong>ers@cis.rit.eduALGORITHMS AND PHENOMENOLOGYDr. David Messinger - ScientistGroup Lead, Algorithms <strong>and</strong> Phenomenology(585) 475-4538 messinger@cis.rit.eduDr. Rol<strong>and</strong>o Raqueño - ScientistWater Analysis <strong>and</strong> Modeling(585) 475-6907 rol<strong>and</strong>o@cis.rit.eduDr. Emmett Ientilucci - Associate ScientistAdvanced Algorithm Development(585) 475-7778 ientilucci@cis.rit.eduMEASUREMENTS AND EXPERIMENTSMichael Richardson - Distinguished ResearcherProject Management <strong>and</strong> ProgramDevelopment(585) 475-5294 richardson@cis.rit.eduNina Raqueño - Assistant ScientistGIS, Data Processing, <strong>and</strong> DatabaseDevelopment(585) 475-7676 nina@cis.rit.edu8
ADMINISTRATIVE SUPPORTCindy Schultz - Staff AssistantStaff Support(585) 475-5508 schultz@cis.rit.eduThe Student TeamsDIRS Masters’ students9
DIRS Ph.D. studentsUnited States Air Force Officers in our graduate program (summer 2007)10
Andy AdamsJames AlbanoMay ArsenovicBrent BartlettDan BlevinsMarvin BoonmeeJason CaseyPierre ChouinardAdam CiszJake ClementsBrian DanielChabitha DevarajThe DIRS Student TeamManny Ferdin<strong>and</strong>usKyle FosterMike FosterAdam GoodenoughJason HamelJosh HuberMarek JakubowskiScott KlempnerSteve LachYan LiYing LiDomenic LuisiSharah NaasJim ShellDanielle SimmonsNatalie SinisgalliAlvin SpiveyKristen StrackerjanDon TaylorZhen WangJason WardSeth Weith-GlushkoYushan Zhu11
3.0 Research Project SummariesThis section provides a brief insight into each of the projects. For more information, pleasecontact the faculty <strong>and</strong> staff working on the project.3.1 ONR MURISponsor(s): Office of Naval Research (ONR)Project Description: Hyperspectral data is becoming a critical tool for military planners. Thecapture of fine spectral information enables the generation of information products whichcould not be produced using traditional imaging means. The challenge facing hyperspectraltechnology, as an operational capability, is with conversion of the raw sensor data into auseful information product that is accurate <strong>and</strong> reliable. Traditional approaches forprocessing hyperspectral data have largely focused on the use of statistical tools to process ahypercube, with little regard for other data that may describe the physical phenomena underwhich the data were collected. The long-term goal of this project is to develop a newgeneration of hyperspectral processing algorithms that take advantage of the underlyingphysics of a scene while utilizing statistical processing techniques to generate valuableinformation products.Project Status: The RIT MURI team (RIT, University of California Irvine, CornellUniversity) initiated research under this MURI in May 2001 <strong>and</strong> over this period, there hasbeen substantial research progress in validating the utility of physics-based algorithmicapproaches. This MURI has been a catalyst for the research team to be awarded additionalresearch support from other sponsors. The research results generated have been shared withthe hyperspectral community through the generation of over 50 peer reviewed journalarticles, presentations at technical conferences, <strong>and</strong> published Masters <strong>and</strong> Ph.D. theses. Thisproject has supported over 15 graduate students, many of whom have graduated or are aboutto graduate, <strong>and</strong> will be taking positions in direct support of the defense <strong>and</strong> intelligencecommunity. The MURI project ended on September 30, 2007.3.1.1 Longwave Temperature/Emissivity Separation <strong>and</strong> Atmospheric CompensationResearch Team: Marvin Boonmee (Ph.D. student), John Schott, David MessingerProject Scope: This project seeks to develop an algorithmic approach to the problem oftemperature / emissivity separation effects in longwave infrared hyperspectral imagery.Along with this task, atmospheric effects in the imagery will be compensated for.12
Project Status: Much progress has been made on this research <strong>and</strong> a unique methodologyfor atmospheric compensation <strong>and</strong> temperature / emissivity separation in LWIRhyperspectral imagery has been developed. The algorithm is currently undergoingextensive testing on both simulated <strong>and</strong> real imagery. The method developed combinestechniques using in-scene information as well as model-based information into anoptimization framework. Using synthetic data, the algorithm has shown the ability todetermine the l<strong>and</strong> surface temperature to within approximately 1 – 2 K <strong>and</strong> the surfaceemissivity to within 1-2 %. The algorithm has been demonstrated to be robust to bothsensor noise <strong>and</strong> spectral miscalibration effects.Figure 3.1.1-1: Estimated surface temperature for an image collected with the SEBASS LWIRhyperspectral sensor over Camp Eastman in <strong>Rochester</strong>, NY during the MegaCollectexperiment conducted in June 2004. Color indicates retrieved temperature as shown in thecolor bar. The large objects in the center of the scene are calibration panels. The left panel isblack (<strong>and</strong> thus has a higher temperature) <strong>and</strong> the right panel is gray. The small object just tothe right of the panels is a heated target. Retrieved temperatures are accurate to withinapproximately 1-2 K.Figure 3.1.1-1 shows results from applying the algorithm to a scene collected over CampEastman in <strong>Rochester</strong>, NY in June 2004 with the SEBASS hyperspectral sensor. The largecalibration panels in the center of the image were instrumented to measure theirtemperature providing a quantitative measure of the algorithm accuracy. Here, thetemperatures were retrieved to within 1-2 K. Other objects visible in the scene include asmall heated target, test panels on the hillside <strong>and</strong> in the field, <strong>and</strong> the vehicles in theparking lot. Note also that small temperature fluctuations in the grass field are retrievedusing this method.13
3.1.2 In-water Radiative Transfer Modeling using Photon Mapping <strong>and</strong> Model-basedIn-water Target DetectionResearch Team: Adam Goodenough (Ph.D. student), Rol<strong>and</strong>o Raqueño, MichaelBell<strong>and</strong>i (B.S. student), Scott Brown, John SchottTask Scope: The objective of this task is to create synthetic scenes of multiple scatteringdominant waters such as those found in littoral zones. A general, efficient solution forcomplex radiative transfer is being developed based on Monte Carlo ray tracing. Thistask incorporates significant changes <strong>and</strong> improvements to RIT’s DIRSIG tool.Task Status: Significant progress has been made with the Photon-Mapping model tosimulate complex hydrologic radiative transfer. This past year's activities were focusedon baseline validation of the technique, data architecture design of simulation elements<strong>and</strong> their behavior, <strong>and</strong> integration of key routines into the DIRSIG environment. Thevalidation of the technique compared several radiometric case studies described in theseminal paper by Mobley et al. (1993). Each of these cases was simulated showing verygood agreement with the different cases established by the comparative study. In caseswhere there were significant discrepancies, it is believed that the model implemented inDIRSIG represented a more sophisticated treatment of the problem. Comparisons werealso demonstrated against Carder et al. (2005) <strong>and</strong> Zaneveld et al. (2001) where spatialobscuration <strong>and</strong> surface effects were simulated showing agreement to the modification tothe light field under these conditions. In order to achieve the correct radiometry of thesesimulations, substantial modifications have been made to the DIRSIG simulationframework to develop a more general <strong>and</strong> flexible representation of radiometricconcepts/elements <strong>and</strong> their interaction across the different media encountered in thelittoral environment (see Figure 3.1.2-1). A flexible interface to the tools provides futureusers with a library of extensible, built-in optical property models <strong>and</strong> high-level controlover computation parameters.Figure 3.1.2-1 Simulations of a plant in <strong>and</strong> out of a freest<strong>and</strong>ing block of water.14
Because the utility of the DIRSIG-Photon Mapping simulation environment is meant tobe applied across different spatial scales, a "surface sampler library" <strong>and</strong> novel BRDFintegration techniques have been implemented to provide the ability to adaptively sampleradiometric contributions to a scene. These tools have already been exploited in at leasttwo other doctoral projects on unrelated topics. In addition to these radiometricimprovements, a preliminary scheme to address spatial scales of wave effects has beenimplemented to provide the necessary fidelity in addressing a very crucial dimension oflittoral modeling. In addition to follow on work that will validate the radiometry of theDIRSIG-Photon Mapping for more complex scenarios, the tools developed from thiseffort will play a key role in a recently awarded Intelligence Community doctoralfellowship studying the microscale radiometry of surfaces <strong>and</strong> participating media.3.1.3 Suspended Sediment ModelingResearch Team: Jason Hamel (Masters’ student), Donald Taylor (Masters’ student),Minsu Kim (Cornell University), Rol<strong>and</strong>o RaqueñoTask Scope: Quantitative hyperspectral remote sensing of coastal <strong>and</strong> inl<strong>and</strong> waterresources has been hindered by inadequate performance of atmospheric compensationmethods. The techniques used for oceanic conditions operate on the premise that there isnegligible water leaving radiance in the near infrared region (NIR 750-950 [nm]) <strong>and</strong> anysensor reaching radiance is mainly due to the atmosphere. The problem stems from theabundance of suspended materials from anthropogenic <strong>and</strong> benthic sources in Case IIwaters not usually observed in the deep ocean. The scattering effects of suspendedsediments greatly affect the water leaving radiance in the visible to the NIR regionresulting in overestimation of the atmospheric contribution to the radiance reaching thesensor. In order to adapt current atmospheric compensation methodologies, a means ofestimating the water leaving radiance in the NIR region needs to be devised. This workdescribes a set of numerical modeling tools that have been integrated to predict opticalproperties of suspended minerals <strong>and</strong> their effects on the water volume spectralreflectance.Task Status: The suspended sediment modeling work has been a cornerstone work in itsown right as well as a foundation for the atmospheric compensation work. To date, thesources of IOPs for constituents (particularly suspended sediments) do not exist in thenear-IR region (800-950) because of the limitations of instrumentation <strong>and</strong> the currentassumption that the returns in those regions for Case I waters are negligible. Ashighlighted by emerging works presented at Ocean Optics 2006, the application ofatmospheric compensation techniques to Case II waters are being hindered by the lack ofcharacterizations of previously ignored constituent (suspended sediment) in a wavelengthregion where in-situ <strong>and</strong> lab measurements are difficult. The modeling that resulted fromthe linkages between the OOPS algorithm <strong>and</strong> HYDROLIGHT produced plausible resultsthat underscores the importance of particle size distribution, scattering phase function,<strong>and</strong> number density as major considerations in optically characterizing turbid Case IIwaters. The competing effects of these properties on the final radiometry can only beelucidated by modeling methods used in this research. The Mie scattering codes used in15
these analyses provided initial estimates that established idealized trends of particleparameter effects on the overall inherent optical properties, but have not been establishedas sufficiently optimum. While the current results are very telling <strong>and</strong> informative, theyneed to be validated either through laboratory experiments or application of moresophisticated scattering codes that are better suited for the wide size regimesencompassed by the current Mie code <strong>and</strong> more realistic particle-shape scenarios. Themerit <strong>and</strong> inadequacy of this work is illustrated by its comparison to the long st<strong>and</strong>ingPetzold functions show in Figure 3.1.3-1. While there is general agreement in shape ofthe scattering phase function, the "spherical" assumption of the Mie code leads toartifacts that are not found in natural waters of realistic distributions.Figure 3.1.3-1: Phase functions at 500nm for a variety of phase functions. Phase functionsdisplayed in this plot: Gaussian with 30 micron mean <strong>and</strong> 1 or 8 st<strong>and</strong>ard deviation width;Junge from 0.2-125 microns with 3,4 or 5 Junge coefficient; Log-Normal with 1 or 4 micronmean <strong>and</strong> 1 st<strong>and</strong>ard deviation width; <strong>and</strong> the Petzold phase function as listed in Light <strong>and</strong>Water by Mobley.Another trend that arose when examining the output from the Mie scattering codeconcerned the nature of particle scattering <strong>and</strong> the effect it has on the final apparentreflectance of a water body. As many researchers have found over the years, scatteringtends to be dominated by smaller particles whose size is closer to the wavelength of lightbeing scattered. Thus, when examining the scattering phase functions of various particledistributions, smaller particles scatter a larger percentage of their light in the 90-18016
degree direction. This trend is again seen in the back scattering ratios generated duringthis research (Figure 3.1.3-2). These same trends are not observed in the final apparentreflectance of the water body though (Figure 3.1.3-3). The complication leading to thisresult is apparent when one examines the scatter cross-sections of the various particle sizedistributions (Figure3.1.3- 4). As shown in the plot, while larger particles might send asmaller percentage of the light backwards compared to smaller particles, they have amuch larger area for interaction with photons. The end result can be a larger amount oftotal light being scattered into the backwards direction than expected from previouslypublished work.Figure 3.1.3-2: Back scatter ratios at 550nm for various mineral <strong>and</strong> particle sizedistributions.17
In summary, this work allowed other aspects of this MURI to move forward with thecaveat that we are relying on an evolving underst<strong>and</strong>ing of crucial elements. It alsoprovided insight into factors of scattering phase functions that have been downplayedbecause of their insignificance in Case I waters.3.1.4 Case II Atmospheric Compensation: Simultaneous Aerosol <strong>and</strong> Water ConstituentRetrievalResearch Team: Donald Taylor (Masters’ student), Jason Hamel (Masters’ student),Rol<strong>and</strong>o RaqueñoTask Scope: In many algorithms designed to retrieve water constituent concentrations, anassumption of negligible water-leaving radiance is made in the NIR. This allows fairlyaccurate atmospheric correction to be applied to the oceanic imagery. Given thisassumption, it is possible to derive model estimates of aerosol type <strong>and</strong> density <strong>and</strong>compensate for its effects in other regions of the spectrum. Unfortunately this assumptionis only valid in areas of very low total suspended sediment (TSS) concentrations. Thisincreased TSS load causes larger back-scattering within the water, increasing thereflectance in the NIR region, which confounds the correction algorithm <strong>and</strong> incorrectlyattributes all the effects entirely to aerosols. A solution to this problem is to model theatmosphere using a proven radiative transfer system such as MODTRAN <strong>and</strong> the waterreflectance due to the increased TSS using HYDROLIGHT, combine them for a givensensor altitude, <strong>and</strong> match the resulting spectra with that from an actual image taken atthat altitude. This is done in the NIR (700-950nm) where we can constrain the algorithmby assuming that the contribution to reflectance of other water constituents is zero. Lookuptables (LUTs) of radiance values from modeled atmospheres <strong>and</strong> reflectance valuesfrom modeled water allow us to make this an iterative process which can be optimized togive us the best match for the pixels in question. The products of this algorithm are theTSS concentration <strong>and</strong> the atmosphere (including aerosols). The atmospheric parameters<strong>and</strong> sediment concentration can then be used to constrain the algorithm in the visibleregion (400-700nm) for use in extracting further constituent information.3.2 ARO MURI – Concealed Target SimulationResearch Team: David Pogorzala, Marek Jakubowski, David MessingerTask Scope: This project is a collaboration with University of Maryl<strong>and</strong>, University of Florida,University of Hawaii, <strong>and</strong> Clark Atlanta University, <strong>and</strong> is lead by the Georgia Institute ofTechnology. The goal of the project is to study the phenomenology <strong>and</strong> exploitation of spectralsignatures of l<strong>and</strong> targets. RIT’s role in the program is to provide high-fidelity synthetic scenedata to the algorithm development team for testing purposes. Previous work under this projectinvolved construction of a thermal infrared hyperspectral scene consisting of a desert areacontaining l<strong>and</strong> mines. In the final phase of this program, RIT is providing a synthetic scene ofa forested area containing targets under various levels of concealment.19
Project Scope: This multi-year project developed <strong>and</strong> implemented physics-based algorithmsfor the exploitation of hyperspectral imagery. Three tools were developed: sub-pixel targetdetection, concealed or contaminated target detection, <strong>and</strong> detection of gaseous effluents. Allthree tools were to be developed in the IDL / ENVI analysis software for ease of transition toNGA. The project was a joint collaboration between DIRS <strong>and</strong> LIAS at RIT, as well ascorporate partners with ITT Visual Information Solutions (formerly RSI) <strong>and</strong> Boeing.Project Status: The project was completed in the winter of 2006 with a final delivery of allcode, documentation, <strong>and</strong> test cases. During the final year of the program improvements weremade to both the gas detection tool as well as to the implementation for h<strong>and</strong>ling of large LookUp Tables required for the target detection tools. The gas detection tool was finalized <strong>and</strong>tested against AHI LWIR hyperspectral imagery of a chemical facility. A typical result fromthis processing is shown in Figure 3.3-1.Figure 3.3-1: Detection results from the NURIgas detection tool showing detection of twoplumes in the facility.Additionally, much improvement was made in the h<strong>and</strong>ling of large Look Up Tables requiredin the physics-based algorithms. These methods rely on the data resulting from a large numberof physics based model runs to characterize atmospheric effects in the target signatures. Theprevious methods used a simple textual tabulation of the data – a method that was unwieldy<strong>and</strong> did not allow for simple visualizations of the data. The new implementation uses theENVI Spectral Library Format to store the data as a binary file, with user-defined identificationtags. Additionally, the visualization tools available within the ENVI software can now be usedto visually inspect <strong>and</strong> present the results of the look up table generation process.All software developed under this effort has been delivered to NGA <strong>and</strong> is currentlyundergoing testing <strong>and</strong> evaluation by the government.21
An interesting additional use of FE-MMI is registration of imagery <strong>and</strong> maps. It has beenfound that visible <strong>and</strong> IR imagery can be registered to maps that have a reasonable matchto reality. Registration of an airborne image to an RIT campus map is shown below.Airborne Image Campus Map Registered Image <strong>and</strong> MapFigure 3.4.1-2: Registration of an airborne image to an RIT campus map is shown below.3.4.2 Stereo Mosaic Extraction from Airborne Video ImagerySponsor: National Geospatial Intelligence Agency (NGA)Research Team: Prudhvi Gurram (Ph.D. student) <strong>and</strong> Eli SaberProject Scope: This project is a part of a NURI contract for Automated Imagery Analysis<strong>and</strong> Scene Modeling. The primary goal of this research is to automate the extraction ofthree dimensional structure of a scene from airborne video captured using the RIT WASPLite sensor. Existing algorithms are time-consuming because they require hugeinteraction between a human analyst <strong>and</strong> image data. This research is aimed atautomating this task using stereo geometry on aerial video. Once the elevation map isobtained from the stereo images, objects are identified <strong>and</strong> extracted from them. Theseobjects are going to be expressed in a format such that it can be given as an input toDIRSIG.Project Status: To extract 3D structure of a large urban scene, a video camera (WASPLite) is attached to an aircraft <strong>and</strong> flown over the scene. The two requirements ofcovering a large area <strong>and</strong> extracting 3D geometry are satisfied by stitching the videoframes into two mosaics which form a stereo pair using ray interpolation techniques. Inaddition to the left <strong>and</strong> right stereo pair, a mosaic along the nadir view is also built todistinguish between the apparent visible <strong>and</strong> occluded surfaces. This distinction helps usin fitting vertical planes to the occluded surfaces (in nadir view) <strong>and</strong> developing acomplete CAD model of each object (especially buildings in an urban scene). Buildings<strong>and</strong> trees are two important classes of objects observed in urban scenes. So, the nadirmosaic is segmented <strong>and</strong> building/tree regions (segments) are identified <strong>and</strong> separatedfrom terrain. The edges <strong>and</strong> corners of different surfaces of a building are identified. Wematch the control points along these edges to their corresponding points in left <strong>and</strong> rightmosaic. Using the disparity between the corresponding points in the mosaics, an elevationmap is developed at these points. Optimal surfaces are fit to each of the segments through23
the edge points. A prismatic building structure is assumed <strong>and</strong> constraints are applied onthe neighboring surfaces with common edges. A complete CAD model of each buildingis provided in “obj” format. The stereo mosaic of an area over RIT’s Center for <strong>Imaging</strong>Science <strong>and</strong> the CAD model of the building extracted from it are seen in Figure 3.4.2-1.Figure 3.4.2 -1: A stereo mosaic over the RIT CIS building <strong>and</strong> a derived CAD model ofthe CIS building.3.4.3 Semi-Automated DIRSIG Scene Modeling from 3D LIDAR <strong>and</strong> Passive <strong>Imaging</strong>SourcesResearch Team: Steve Lach (Ph.D. student) <strong>and</strong> John KerekesProject Scope: This part of the Automated Scene Modeling NURI is addressing 3D CADmodel extraction from LIDAR data, spatial detail extraction from high resolution data,<strong>and</strong> spectral information from spectral imagery. It also integrates the results from theseefforts into the full set of input files necessary to describe a DIRSIG scene.Project Status: An area on the RIT campus is being used as a test site to develop thenecessary algorithms <strong>and</strong> to test the process. A LIDAR data collection of the campusoccurred in October 2006 by Leica Geosystems, our partner in the project. Imageryobtained from Pictometry <strong>and</strong> by RIT’s WASP system has provided the high resolutionspatial information.As an example of the type of data, corresponding 2D images for a building on RIT’scampus are given in Figure 3.4.3-1. The roof’s left edge are detected in the top image viaa Canny edge detector, while the corresponding points are highlighted in the LIDARimage <strong>and</strong> the appropriate edge has been flagged in the CAD projection, demonstratingthe achieved object registration among the data types.24
Figure 3.4.3-1: Frame-Array Image (top), 2D projection of LIDAR data (left) <strong>and</strong>CAD model (right).The LIDAR data are used not only to extract the building geometry <strong>and</strong> CAD model, butalso to derive the surface elevation map, <strong>and</strong> in some cases, to detect <strong>and</strong> scale trees forplacement in the scene.A surface cover type classification is derived from available spectral imagery. Figure3.4.3-2 shows such a classification result for the area of interest on the RIT campus.Using this map <strong>and</strong> spectra from a reflectance library matching the various materials, thesurfaces are attributed with appropriate spectra. Figure 3.4.3-3 shows a final DIRSIGscene rendering using inputs derived from the various remotely sensed images <strong>and</strong>corresponding libraries.25
integrated information product that will provide users with a more complete view of an eventproviding greatly enhanced situational awareness.3.5.1 Atmospheric Compensation <strong>and</strong> Reflectance RetrievalResearch Team: Brent Bartlett (Ph.D. student) <strong>and</strong> John SchottProject Scope: This project is aimed at development of improved methods foratmospheric compensation in the presence of clouds. Specifically, it is designed todevelop <strong>and</strong> demonstrate methods that could be used for operational remote monitoringrecognizing that clouds will be present in the surround for a large fraction of the availableimagery. As part of the ISSI project, we focused on potential measurement devices thatmight be deployed in the study region to improve the potential for atmosphericcompensation.Project Status: The project is nearing completion (expected October 2007). A method thatutilizes a modified empirical line method (ELM) has been developed <strong>and</strong> demonstrated toimprove atmospheric inversion to reflectance in the presence of clouds in the surround.The method involves use of a simple solar irradiance meter with sun-shade at the primarysite where the ELM panels are deployed. It then uses either a second solar irradiancemeter at a second site (see Figure 3.5.1-1) or a fisheye lens (see Figure 3.5.1-2) to adjustthe ELM solution to account for illumination variations due to clouds in the surround. Aset of test images (see Figure 3.5.1-3) from the DOE atmospheric radiation measurement(ARM) site in Lamont, Oklahoma have been identified to test the performance of thedirect measurement <strong>and</strong> fisheye image/modeling approach. Initial results indicate thatsignificant improvement should be achieved by this approach <strong>and</strong> that methods for betteroperational use may be available through use of satellite images to map cloud patterns inplace of the fisheye lens images.3.5.1-1: The physical layout of the Multi Modal Collect (MMC) over RIT campusshowing the primary site <strong>and</strong> the secondary site to the southeast.27
• Interface with digital radio link for realtime transmission of imagery from theaircraftProject Status: In 2007, the RIT sensor system was deployed on several demonstrationmissions for local county, state, major utility company organizations. Thesedemonstrations showed the ability to capture airborne imagery, geo-reference theimagery, <strong>and</strong> produce integrated GIS products in near realtime. For example the RITsensor was flown in support of a disaster drill for the Ginna nuclear power station. Figure3.5.2-1 shows an example color image produced in realtime <strong>and</strong> overlayed on a USGSDRG map.Figure 3.5.2-1: Realtime image of nuclear power plant overlaid on USGS mapFigure 3.5.2-2 shows an example of a simulated flood mapping mission in which the RITsensor mapped over 40 miles of a river <strong>and</strong> produced a complete GIS product in less than2 hours from the time of aircraft launch. The overlay mosaic is imagery captured in theshortwave infrared which is very well suited for delineating water. The inset is from thecolor infrared camera which operates simultaneously with the infrared cameras toproduce highly detailed imagery.29
L<strong>and</strong>sat Base ImageMosaic of imagery captured<strong>and</strong> processed in < 2 hoursSusquehanna RiverColor Infrared Imagery Shows DetailFigure 3.5.2-2: 40 miles of river mapped <strong>and</strong> rendered in GIS in less than 2 hours3.5.3 Monitoring Algal Blooms using Airborne Multispectral DataSponsor(s): NASA,Research Team: Shari McNamara (Masters’ student) <strong>and</strong> Anthony VodacekProject Scope: This project was a collaboration with SUNY- Environmental Science <strong>and</strong>Forestry. The goal of the project is to develop algorithms for detecting cyanobacteria(blue-green algae) based upon the unique spectral signature of the cyanobacteriapigments. Previous studies of cyanobacteria assessed the detection of these potentiallyharmful algae using the b<strong>and</strong> sets available on existing satellite systems. Our goal is tofind an optimal b<strong>and</strong> set that can be used with our flexible, small, <strong>and</strong> inexpensivemultispectral sensor, WASP-Lite.30
Project Status: WASP-Lite was flown over Lake Champlain in fall 2006 during a time ofabundant cyanobacteria (blue-green algae) growth in the lake. The b<strong>and</strong> pass filters usedon WASP-Lite were 405, 550, 632, 650, <strong>and</strong> 870 nm. These filters were chosen torespond to reflection or absorption b<strong>and</strong>s due to the algal pigments chlorophyll <strong>and</strong>phycocyanin.Figure 3.5.3-1: (left) Three b<strong>and</strong> false color WASP-Lite image, where the 550, 630, <strong>and</strong> 650nm b<strong>and</strong>s are assigned to RGB, respectively. The diagonal white streaks are foam lines on thewater surface <strong>and</strong> the red patches correspond to high concentrations of algae in the water.(right) Principal component analysis of the same multispectral image to remove the effects ofthe foam <strong>and</strong> sunglint off the water surface <strong>and</strong> enhance the algal pigments in the water.Dark areas are high concentrations of algae.The first finding of the project was that stringent b<strong>and</strong> to b<strong>and</strong> registration is critical tothe success of this approach since the images contain features such as foam lines <strong>and</strong> sunglint off the wave facets which have very strong signals. Secondly, the ability to resolvepatterns of algae distribution in the water at very fine scale makes it very difficult tomatch water sample locations with image data (Figure 3.5.3-1). Future work inestablishing these techniques for monitoring algae requires better spatial sampling suchas can be accomplished with flow through instrumentation (such as fluorometers) that c<strong>and</strong>etermine algae concentrations as a boat is underway.More details on this project can be found in Shari McNamara’s M.S. thesis titled “UsingMultispectral Sensor WASP-Lite to analyze harmful algal blooms.”3.6 L<strong>and</strong>sat TM <strong>and</strong> L<strong>and</strong>sat ETM+ Thermal CalibrationSponsor(s): NASA GoddardResearch Team: Frank Padula (Masters’ student), John Schott, Nina Raqueño, TimGallagher31
Project Scope:DIRS has a long history of supporting the thermal calibration of NASA's suite of L<strong>and</strong>satsatellites. The research focus for this period included continued monitoring of the L<strong>and</strong>satETM+ thermal b<strong>and</strong> <strong>and</strong> further refinement of the L<strong>and</strong>sat TM calibration history. Duringthis year much effort has been dedicated to collecting ground truth for both L<strong>and</strong>satinstruments <strong>and</strong> updating RIT’s L<strong>and</strong>sat 5 TM calibration procedure. It has also includeddevelopment of a proposed method to more effectively correct buoy data to surfacetemperatures that could significantly improve the historical calibration data for L<strong>and</strong>sat 5.The sensor performance is compared to ground truth temperatures collected from Lake Ontario<strong>and</strong> Lake Erie. Surface measurements are augmented with simultaneous thermal imagery withRIT’s MISI airborne sensor (cf. Figure 3.6-1). The specific atmospheric conditions are takeninto account by implementing an interpolated atmospheric profile within MODTRAN. Finalcalibration results are reported as a comparison of sensor reaching radiances <strong>and</strong> knownsurface radiances propagated to the sensor altitude (cf. Figure 3.6-2).Project Status:L<strong>and</strong>sat calibration has been a multi-year monitoring project since 1995. Results <strong>and</strong>recommendations were presented to the L<strong>and</strong>sat Science Team in December 2006 <strong>and</strong> June2007. DIRS results were comparable to an independent team’s results. At this time, L<strong>and</strong>satETM+ remains stable <strong>and</strong> no changes to the calibration coefficients are necessary. Both teams2show a slight bias (0.092 W / m srμm) in L<strong>and</strong>sat TM <strong>and</strong> a change to calibration processingwas implemented in April 2007. Given that L<strong>and</strong>sat TM was not monitored continuously sinceits launch in 1984, DIRS is now using historical NOAA buoy temperature data to fill in thetemporal gaps.This continued monitoring <strong>and</strong> calibration of the L<strong>and</strong>sat TM <strong>and</strong> ETM+ sensors is essential tolong-term global change studies.32
Figure 3.6-1: Example of L<strong>and</strong>sat 5 thermal imagery (left) of Lake Ontario <strong>and</strong> LakeErie with ground collection sites indicated with red ‘+’ <strong>and</strong> buoy locations indicated withyellow stars. On the right is an example of higher resolution thermal MISI imagery of the<strong>Rochester</strong> Lake Ontario shoreline.in-situ derived radiance[w/m^2 sr ♦m]9.598.587.576.56TM Thermal Calibration Data: RITSummary 1990-20072007RMSErad = 0.058RMSEtemp = 0.56 6.5 7 7.5 8 8.5 9 9.5image derived top-of-atmosphere radiance [w/m^2 sr ♦m]All Years1 to 12007Linear (1 to 1)Figure 3.6-2: A comparison of previous L<strong>and</strong>sat TM calibration analysis to early spring2007 results (Note the 2007 data include the correction recommended by the CalibrationTeam). Results are reported as a comparison of sensor predicted radiances to groundbased observations.3.7 IC Postdoctoral Research Fellowship Program – Stochastic Target Space ModelingSponsor(s): Intelligence Community/NGAResearch Team: Emmett Ientilucci <strong>and</strong> John Schott33
Project Scope:Traditional approaches to hyperspectral target detection involve the application of detectionalgorithms to atmospherically compensated imagery. Rather than compensate the imagery, amore recent approach uses physical models to generate target sub-spaces. These radiance subspacescan then be used in an appropriate detection scheme to identify potential targets. Thegeneration of these sub-spaces involves some a priori knowledge of data acquisitionparameters, scene <strong>and</strong> atmospheric conditions, <strong>and</strong> possible calibration errors. Variation isallowed in the model since some parameters are difficult to know accurately. Each vector in thesubspace is the result of a MODTRAN simulation coupled with a physical model. Generationof large target spaces can be computationally burdensome. This research explores the use ofstatistical methods to describe such target spaces. The statistically modeled spaces can then beused to generate arbitrary radiance vectors to form a sub-space.Project Status:To date, two models have been developed, one an improvement on the other. Both arevariation on a 3 rd order, 3 variable polynomial of the formf ( xyz , , )=3 3 3 2 2 2( β1x + β2y + β3z ) + ( β4x + β5y + β6z ) + ( β7x+ β8y+β9z)2 2 2 2 2 2 2 2 2( β10x yz β11yzx β12zxy) ( β13xyz β14 yxz β15zxy)+ + + + + +( )+ β xy + β xz + β yz + β xyz + β16 17 18 19 0Figure 3.7-1 shows results for the older model while Figure 3.7-2 showns improved (lowerresiduals) results for the same target space.Figure 3.7-1: Residuals (left) <strong>and</strong> relative errors (right) obtained using the (older) full 5variable, 3 rd order, model. The maximum <strong>and</strong> minimum residuals are 116.8 <strong>and</strong> -113.8,respectively. This was for a target space consisting of 8575 vectors.34
Figure 3.7-2: Residuals (left) <strong>and</strong> relative errors (right) obtained from (newer) piecewisemodel. Once again, this is a 3 rd order model. The maximum <strong>and</strong> minimum residuals are13.7 <strong>and</strong> -15.0, respectively. This is an aggregate histogram obtained from piecewiseresidual results. This was for a target space consisting of 8575 vectors.3.8 IC Postdoctoral Research Fellowship Program – Effects of Humidity on AtmosphericTransmission for Infrared SensorsSponsor(s): Intelligence Community Postdoctoral Fellowship (NGA)Research Team: Rol<strong>and</strong>o Raqueño, Carl Salvaggio, Robert KremensProject Scope: The project is investigating the phenomenon of anomalous transmission effectsin the LWIR. This atmospheric anomaly is characterized by low transmissions in the LWIRwhile having relatively high transmissions in the visible region. The approach is to useradiative transfer modeling to try to determine if <strong>and</strong> when anomalous transmissionconditions arise due to small water aerosol particles <strong>and</strong>/or hygroscopic aerosol particles undercertain humidity conditions. The modeling will require precise control of the spectral opticalproperties of the particulates (as calculated using Mie theory) along with their positionin the atmospheric column. Overhead imagery is under study to verify this phenomenon <strong>and</strong>establish its linkages to humidity conditions. Small ground-based collections will also beperformed in an attempt to observe this phenomenon <strong>and</strong> its relation to atmospheric conditions.Project Status: Preliminary modeling using MODTRAN4 <strong>and</strong> the included Mie scattering codehas highlighted deficiencies in the current interface implementation between the two codes. Anewer version has been requested which will simplify the analysis by allowing to define asingle aerosol layer with the appropriate spectral optical properties in order to isolatethe impact of the very small water aerosol particles under consideration. Preliminary groundbasedcollection of LWIR <strong>and</strong> visible imagery have been conducted using the WASP-litesensor, but the need for persistent surveillance to image a rare event has initiated theintegration of a sensor package better suited for long-term imaging <strong>and</strong> environmentalmonitoring. Plans are underway to merge instrumentation resources <strong>and</strong> additional collectionexperiments with the Cooling Tower Project.35
Figure 3.2-1: Video sequence of diurnal collection over water (Conesus Lake) (left)Visible frame from sequence (right) Corresponding LWIR Thermal Image.3.9 Revolutionary Automatic Target Recognition <strong>and</strong> Sensor Research (RASER) Project:Vehicle Tracking in an Urban Environment with Multitemporal Airborne Hyperspectral<strong>Imaging</strong>Sponsor: Air Force Research <strong>Laboratory</strong> (AFRL) Sensor Directorate ATR & FusionAlgorithms Branch (SNAT)Research Team: Jason Casey (Masters’ student) <strong>and</strong> John KerekesProject Scope: This project is exploring the technical issues, phenomenology <strong>and</strong>capability of airborne hyperspectral imaging systems to detect <strong>and</strong> track civilian vehiclesin a cluttered urban environment.Project Status: In July 2006, the project conducted a successful repeat pass airbornehyperspectral imagery collection coincident with the movement of ground truthedvolunteer vehicles on the ground. The Cooke Hyperspectral Airborne RepeatMeasurement (CHARM) experiment is proving to be an excellent data set from which tostudy this problem. Five vehicles were pre-positioned <strong>and</strong> then moved between passes(seven occurring within 90 minutes) of the HyVista HyMap airborne hyperspectralimager in the town of Cooke City, Montana. This location was chosen since it is the fieldsite of our partner in the project, HyPerspectives, a small business located in Montana<strong>and</strong> to leverage the availability of the HyMap sensor which was in the area for severalother collection experiments. Figure 3.9-1 presents a sample of the HyMap imageryshowing the Cooke City area <strong>and</strong> its surrounds.36
Figure 3.9-1: Color rendition of HyMap HSI image of Cooke City, MT during CHARM2006.The CHARM data continue to be analyzed but early results indicate it is possible in somecases to use the spectrum of a vehicle of interest collected in one pass to find the vehicleafter it moved to a nearby location in a subsequent pass of the sensor. However, this isvery dependent upon the vehicle having a spectrum (color) that is unique to avoid falsealarms. This project also has available high resolution LIDAR data of the same area(collected in 2003) which has been shown to help mitigate false detections in the trackingby eliminating fixed structures from consideration when searching the image for thevehicles of interest.Another focus of the efforts this year has been on the study <strong>and</strong> characterization of errorsintroduced by spectral misregistration between groups of spectral channels in imagingspectrometers. RIT’s line scanning Modular <strong>Imaging</strong> Spectrometer Instrument (MISI)uses two separate apertures to feed spectrometers covering the visible <strong>and</strong> near infrared(NIR) portions of the spectrum. Since these apertures sense radiance from slightlydifferent locations on the ground during data collection, there is an inherentmisregistration between the resulting images. The sensitivity <strong>and</strong> impact of this artifact isbeing studied through the use of the DIRSIG image simulation tool. Figure 3.9-2 showsa portion of the MegaScene I area with 140 vehicles placed across the scene. By creatingthe image at high resolution <strong>and</strong> then rendering it at 10x greater pixel size, we have beenable to create images that are misregistered at 0.1 pixel increments.37
Figure 3.9-2: Color rendition of MegaScene I area with 140 vehicles placed in scene.Various algorithms are being applied to the simulated images with a range ofmisregistrations. Figure 3.9-3 shows an example resulting ROC curve (probability ofdetection vs. probability of false alarm) for a particular algorithm <strong>and</strong> vehicle color. Thisresult shows the degradation resulting from having a misregistration between the visible<strong>and</strong> near infrared parts of the spectrum as well as the degradation of performance whenusing b<strong>and</strong>s only from the visible or NIR.Figure 3.9-3: Target detection performance with misregistered data or using a portion ofthe spectrum.3.10 Apparent Temperature of Cavity Objects from Thermal ImagerySponsor: Savannah River National <strong>Laboratory</strong>38
Research Team: Matthew Montanaro (Ph.D. student), Carl Salvaggio, David Messinger, ScottBrownProject Scope: Determine the internal temperature of a mechanical draft cooling tower(MDCT) from remotely sensed thermal imagery for input to process modelsProject Status: The problem of determining the temperature of a MDCT can be separated intotwo parts: the radiance leaving the tower <strong>and</strong> the radiance reaching the sensor. The radianceleaving the tower is dependent on the optical properties of the tower materials <strong>and</strong> also theinternal geometry of the tower. Simulations using the DIRSIG software developed by the DIRSlaboratory at RIT were used to investigate the dependence on the optical properties of thetower materials <strong>and</strong> on the number of internal reflections taking place inside the tower on thetower leaving radiance. The result of these simulations indicate that assuming the material hasa relatively high emissivity <strong>and</strong> is somewhat specular in the long wave infrared, the towerradiance approaches the blackbody radiance given at least three internal reflections haveoccurred. In other words, the tower behaves like a blackbody if the previously mentionedassumptions hold.The tower radiance is then propagated through the exhaust plume <strong>and</strong> through the atmosphereto arrive at the sensor. The tower exhaust consists of a warm plume with a higher water vaporconcentration than the ambient atmosphere. The MODTRAN software was used to study theeffect of this plume under a variety of conditions. The result of this study demonstrates that theplume will be the largest source of error when attempting to derive the temperature of theMDCT. Techniques must be developed to compensate for this error introduced by the plume.We are currently working to develop a regression relationship among all the variables thatmight influence the derived temperature of the MDCT.Figure 3.10-1: Results of the DIRSIG simulation (left) demonstrating that the towerbehaves like a blackbody if the materials have relatively high emissivities, are somewhatspecular, <strong>and</strong> there have been a sufficient number of internal reflections. The MODTRANstudy (right) indicates that the temperature error introduced by the plume is dependent onthe air temperature, concentration of water vapor, <strong>and</strong> the height of the plume.39
3.11 Gaseous Effluent Monitoring SystemSponsor(s): Environment Protection Agency (EPA) / D&P InstrumentsResearch Team: Natalie Sinisgalli (B.S. Student), Robert Kremens, David Messinger, CarlSalvaggioProject Scope: This project was focused on the development of a field portable device for thedetection, identification, <strong>and</strong> quantification of gaseous effluent plumes from industrial facilitiesfor compliance monitoring (MARLIN).3.11.1 Instrument DevelopmentProject Scope: RIT’s role in the instrument development task was to develop, usingcommercially available components, a system that would allow for the observation of theplume using both a visible <strong>and</strong> midwave infrared camera while simultaneously collectingspectral radiance data from a single targeted position within the observed plume. Theseseparate systems were to be bore-sighted for a fixed operating distance <strong>and</strong> provide for theuser to make adjustments to the instrument sighting while deployed in the field.Project Status: The system has been delivered to the EPA <strong>and</strong> is currently undergoing testingat the sponsor’s site. The system consisted of a st<strong>and</strong>ard silicon based miniature videocamera mounted in the sighing telescope of a D&P Instruments Model 202 TurboFTspectrometer. This allows for recording of the exact field of view that the spectrometer iscollecting. This system is boresighted with a FLIR Systems GasFindIR midwave,mechanically cooled, video camera that also collects a video stream. All the video streamsare simultaneously recorded on a portable, DC powered, digital video recorder in a splitscreen format. This latter data can be used to help determine the flow rate for the gas asdescribed in the next section.(a) (b) (c)Figure 3.11-1: (a) Front view of MARLIN systems illustrating the D&P InstrumentsTurboFT equipped with a 6-inch telescope collecting optic, the in-path miniature videocamera, <strong>and</strong> the FLIR Systems GasFindIR, (b) Rear view of the MARLIN systemindicating the presence of the split-viewing screen for in field observations, <strong>and</strong> (c) Fielddeployed system with digital video recording electronics shown.40
3.11.2 Gaseous Effluent Monitoring System - Algorithm Development <strong>and</strong> ImplementationProject Scope: RIT’s role under the algorithm task was the development of data processingalgorithms to extract both qualitative <strong>and</strong> quantitative information from the data collected bythe MARLIN sensor. The desired quantities to be estimated are (1) gas species identification<strong>and</strong> (2) the gas mass flow rate estimation. Software was implemented in the IDL / ENVIprocessing environment <strong>and</strong> included a Graphical User Interface for ease of use.Project Status: The algorithms designed to extract the necessary information from theMARLIN sensing system were developed <strong>and</strong> implemented during the first half of the year.Final implementation <strong>and</strong> testing at RIT was completed during the winter <strong>and</strong> spring of 2007.The algorithm proceeds through several steps to achieve the desired estimates. First, thespectrometer data is used to estimate the most likely constituent gas species in the plume bycomparing the measured spectrum with a library of gas spectra. Next, through userinteraction with the software, the plume size <strong>and</strong> flow rates are estimated from the IR videoframes. This information is combined with estimates of the signature “strength” from thespectrometer to estimate the gas concentration. Finally, this information is combined toestimate the mass flow rate of the gas (in grams / hour) exiting the leak. Figure 3.11.2-1shows the second of four graphical user interfaces in the software. The software has beendelivered back to the EPA for testing during field collections to take place during the summerof 2007.Figure 3.11.2-1: GUI in which the user interacts with the software to determineleak flow rate <strong>and</strong> size.41
3.12 Oblique HSI Algorithm DevelopmentSponsor: VirtualScopics Inc., Naval Research <strong>Laboratory</strong> (NRL)Research Team: Emmett Ientilucci <strong>and</strong> David MessingerProject Scope: With the recent development of several new long-range oblique hyperspectralsensors, it is important to underst<strong>and</strong> any new limitations that may be encountered in the data(relative to that obtained at nadir) due to the longer st<strong>and</strong>-off distances <strong>and</strong> the oblique paththrough the atmosphere. Because the affects of the atmosphere are highly wavelengthdependent,we expect long-range sensors to be far more limited in their spectral range. Underthis task RIT will conduct several studies to underst<strong>and</strong> the phenomenology <strong>and</strong> driving factorsassociated with exploitation of oblique hyperspectral imagery. St<strong>and</strong>ard radiative transfer <strong>and</strong>scene simulation tools will be used.Project Status:Sensor Reaching Radiance EstimatesFigure 3.12-1: Plot of sensor-reaching radiance (TOTAL_RAD) as well as individualcomponents that make up the sensor-reaching radiance (i.e., GRND_RFLT, DRCT_RFLT,<strong>and</strong> SOL_SCAT). It can be seen that at a large slant range, most of the signal reaching thesensor, in the VIS, is from atmospheric scattering <strong>and</strong> upwelled radiance <strong>and</strong> not thetarget.Contrast FunctionsPresented is the contrast in L TOTAL_RAD for VIS=20km <strong>and</strong> azimuth angle=109.7. That is the sunis behind the sensor. Variation occurs in target reflectance (i.e., 50 <strong>and</strong> 5) <strong>and</strong> elevation angle(i.e., nadir <strong>and</strong> θ=12 degrees). Results of this contrast can be seen in Figure 3.12-2 where b<strong>and</strong>sassociated with water absorption have been removed (i.e., water regions 0.940, 1.130, 1.4 <strong>and</strong>42
1.9 um). For example, around 650 nm, you get about the same level of contrast (about 20%)when you image a 5% target nadir as you do imaging a 50% target at a 12 degree elevation.r = 50θ = 90 Deg (Nadir)r = 50θ =12 Degr = 5r = 5Figure 3.12-2: Shaded in regions illustrating ranges of contrast for nadir <strong>and</strong> 12 degreeviewing. RED is range in contrast for NADIR viewing (target r = 50 to 5) <strong>and</strong> GRN isrange in contrast for 12 degree viewing (target r = 50 to 5).3.13 LACOSTE ModelingProject Scope: RIT is supporting the feasibility study of a coded aperture sensor namedLACOSTE. The Air Force Research <strong>Laboratory</strong> (ARFL) is performing the actual modeling ofthis instrument.Project Status: RIT has provided user support, scene improvements, <strong>and</strong> enhancements to theDIRSIG modeling software.(1) Therm Time Step OptimizationRIT’s DIRSIG modeling tool has been upgraded to account for the thermal mass ofmaterials being modeled. Temperature predictions for materials with little thermal inertia,such as leaves <strong>and</strong> metals, have been significantly sped up. Typical scenes modeled in theemissive region undergo a two-fold speed increase in total run time. In extreme cases, suchas Microscene1 slant views, six-fold speed increases have been observed.(2) Implementation <strong>and</strong> Automation of a Thermal ValidationThe “Rooftop Validation”, used in several published DIRS papers, has been reproduced.This establishes the validity <strong>and</strong> correctness of DIRSIG’s temperature predictions <strong>and</strong>thermal images. Calculating <strong>and</strong> producing validation outputs has been automated. Thismeans that all future versions of DIRSIG can easily be checked for correctness.(3) New Megascene1 TreesA new set of trees has been created for Megascene1. Unlike the original trees, thesefeature full geometry for branches <strong>and</strong> twigs. Besides the “st<strong>and</strong>ard”, foliated versions, aset of defoliated trees has been produced to enable winter simulations. Furthermore, the43
new trees were created using an open source tool; users will no longer need to purchase aTreePro license to access high-fidelity trees.3.14 L<strong>and</strong>sat Data Continuity Mission (LDCM)Sponsor: US Geological SurveyResearch Team: Aaron Gerace (Ph.D. student), Nina Raqueño, John SchottProject Scope:The goal of this research effort is to evaluate the potential for the improved features of theL<strong>and</strong>sat Data Continuity Mission (LDCM) to contribute to water quality studies. Specifically,we wish to determine if the advancements made to the Enhanced Thematic Mapper Plus(ETM+) are significant enough to enable the use of the LDCM sensor as a calibration tool to ahydrodynamic model of river discharge.Project Status:Preliminary studies have been designed to determine what affect a deep-blue b<strong>and</strong>, 12-bitquantization, <strong>and</strong> improved signal-to-noise ratios will have on our ability to retrieve waterconstituents (Chlorophyll, Suspended Minerals, <strong>and</strong> Colored-Dissolved Organic Matter). In aneffort to evaluate just the sensors abilities, atmospheric effects can be ignored by developing ascene through the use of Hydrolight simulated data. Hydrolight is an in-water radiativetransfer code that can be used to determine the water-leaving signal of a water column. Thenby developing a model of the ETM+ <strong>and</strong> LDCM sensors, a retrieval process can beimplemented to determine how effective each sensor is in retrieving water constituents. Table3.14-1 illustrates LDCM’s potential to be used in the retrieval process by showing the errorsincurred in retrieving the three major constituents. Clearly LDCM outperforms ETM+ <strong>and</strong> iswell under the desired 20% error st<strong>and</strong>ard.SuspendedChlorophyll MineralsCDOMETM+ 10.9% 20.0% 22.9%LDCM 5.4% 5.0% 6.4%Table 3.14-1: Constituent retrieval errors for the ETM+ <strong>and</strong> LDCM sensor. Errorsexpressed as percentage of the range of values we can expect to observe in a scenecontaining case 2 waters.Encouraged by the preliminary results, further studies are being conducted with the LDCMsensor. Using the AVIRIS data collected by the DIRS group on May 20 th , 1999, we canevaluate LDCM’s efficiency in performing the retrieval process on real data. By sampling theAVIRIS scene to the spectral response of the LDCM sensor <strong>and</strong> using an appropriateatmospheric correction algorithm, the constituent retrieval process can be simulated for the<strong>Rochester</strong> embayment. Although this stage of the study is still in its infancy, promising resultshave been obtained. Figure 3.14-2 illustrates our ability to retrieve the three constituents fromthe Genesee river plume, which is the area we wish to use LDCM as a calibration tool.44
Ongoing efforts include the determination of the optimal atmospheric correction algorithm <strong>and</strong>the development of a hydrodynamic model.SuspendedChlorophyll MineralsCDOMLDCM 2.1% 10.0% 19.3%Table 3.14-2: Constituent retrieval errors for the LDCM sensor when process performedon real data. Errors expressed as percentage of the range of values we can expect toobserve in a scene containing case 2 waters.3.15 SENSIAC Persistent Data Collection <strong>and</strong> Data AnalysisSponsor(s): US Army Night Vision <strong>Laboratory</strong> (via theSENSIAC)Research Team: Michael Richardson <strong>and</strong> David MessingerProject Scope: Under this effort RIT is collecting imageryusing the WASP sensor suite to help underst<strong>and</strong> the role ofmultispectral imaging in persistent surveillanceapplications. The US Army Night Vision <strong>Laboratory</strong> isdeveloping sensor requirements to meet a particularoperational scenario need <strong>and</strong> this study is supporting theseefforts. RIT collects imagery under various conditions <strong>and</strong>performs initial processing steps on the data beforedelivering a set of spatial / spectral target features toGeorgia Tech Research Institute. GTRI is performing thedata association trade study <strong>and</strong> analysis.Project Status: Several experiments were conducted during2006-2007 in support of this program. Initially, staticvehicles in the RIT parking lots were imaged from theairborne WASP platform. Target signatures were extractedfrom the imagery <strong>and</strong> delivered to Georgia Tech. A secondcollection was performed during January using vehiclesmoving around the “racetrack” entrance to the RITcampus. The goal was to study the thermal features fromoperating vehicles. An example LWIR image containingthe moving targets is shown in Figure 3.15-1. Again, target signatures were processed <strong>and</strong>Figure 3.15-1: Moving vehiclesignatures observed in the WASPLWIR camera in support ofpersistent surveillance researchdelivered to the Georgia Tech researchers. It was found that the addition of the visible spectralb<strong>and</strong>s of the WASP sensor greatly enhanced the object identification algorithms. A reportsummarizing the first two experiments <strong>and</strong> the results was delivered to the Army Night Vision<strong>Laboratory</strong> in the spring of 2006. Future experiments simulating traffic intersections <strong>and</strong> theeffects of solar illumination angle are planned for the summer of 2007.45
3.16 <strong>Remote</strong> <strong>Sensing</strong> Data Assimilation with Physical Models of the Environment3.16.1 Hydrodynamic <strong>and</strong> Water Quality ModelingSponsor(s): NOAA (Great Lakes Environmental Research <strong>Laboratory</strong>)Research Team: Yan Li (Ph.D. student), Yushan Zhu (Ph.D student), Alvin Spivey (Ph.Dstudent), Anthony Vodacek, Alfred Garrett (Affiliate Professor, SRNL)Project Scope: Ontario Beach in <strong>Rochester</strong>, NY on Lake Ontario is subject to beachclosings during the summer months due to excessive bacterial counts. The MonroeCounty Health Department has developed a decision model for beach closings based on aset of predictive indicators, most of which relate to flows from the Genesee River. Wepropose an integrated modeling system that will include a model of the Genesee Riverwatershed, a hydrodynamic model to predict the fate of the Genesee River plume in LakeOntario, measurements of water quality parameters in the river, <strong>and</strong> satellite remotesensing data <strong>and</strong> ground-based radar data for rainfall rates as data sources <strong>and</strong> validationof the watershed <strong>and</strong> circulation model (Figure 3.16.1-1). This model is expected toimprove the accuracy of beach closure decisions, to decrease expenses related tomonitoring water quality at the beach, <strong>and</strong> to provide data for devising managementstrategies that will decrease the frequency of beach closings.MODIS L<strong>and</strong>coverturbidity sensorswatershed modelhydrodynamic modelbeach closure modelNEXRADRadiative TransfermodelMODIS 250 m dataFigure 3.16.1-1: Flow chart of the proposed water quality monitoring model. The modelsare in blue boxes, the data in white boxes. The MODIS reflectance data <strong>and</strong> the turbiditysensor data are assimilated into the modeling system using an Ensemble Kalman Filter(EnKF). This data assimilation process updates the model as new data becomesavailable, thereby producing better predictions.Project Status: The basic structure of the model has been built <strong>and</strong> tested for July/August2003. An example of MODIS 250 m radiance data showing the plume of the GeneseeRiver entering Lake Ontario (black) <strong>and</strong> being blown westward by the wind. The beachwas closed on that day. An ensemble of 12 hydrodynamic model (ALGE) runs for thesimulation period used r<strong>and</strong>om variations of the forcing data, specifically wind speed,wind direction, discharge, <strong>and</strong> TSS concentration, to produce 12 possible plumesimulations over time. The simulated plume concentrations for sediment from theGenesee River were then used to predict the plume reflectance in each case by running46
the Hydrolight radiative transfer model for the conditions at the time the MODIS sensorwas acquiring an image. This produced the model state that could be compared to theobservation (MODIS) within the Ensemble Kalman Filter process.MODIS 250 m radiance data (645 nm)August 23, 2003 Š beach closed due towestward flowing plumeNGenesee River plumeFigure 3.16.1-2: MODIS 645 nm radiance on a day that Ontario Beach was closed due tothe westward flowing Genesee River plume.The improvement in the simulation by assimilating the MODIS data is demonstrated forfour days in August 2003 (Figure 3.16.1-3). The EnKF estimate is a better estimate ofthe plume behavior than the open-loop simulation with no data assimilation. We foundthat a threshold value of 45 mg L -1 of sediment in the water at the beach was a reasonablepredictor of the actual determination of beach open/closed made by the County.Generally, when the predicted sediment concentration was above 45 mg L -1 the beachwas closed <strong>and</strong> below that value it was open. Thus we can transform the modeling resultinto criteria useful for the beach closing decision process. Future work includes adding ahydrological model of the Genesee River watershed that will use satellite derived l<strong>and</strong>cover <strong>and</strong> NEXRAD rainfall to predict sediment flow in the river. The initial EnKFresults are discussed in detail in the Ph.D. dissertation of Yan Li, “An Integrated WaterQuality Modeling System with Dynamic <strong>Remote</strong> <strong>Sensing</strong> Feedback.”47
8/14 8/15 8/16 8/18MODISTSSconcentration (g/m 3 )170143Open-loop11690Figure 3.16.1-3: Comparison of satellite date <strong>and</strong> simulation results on four days. Top –MODIS data. Middle – Open-loop simulation result with no data assimilation. Bottom –Simulation with data assimilation via EnKF.3.16.2 Fire Propagation ModelingSponsor(s): NSFEnKF estimateResearch Team: Zhen Wang (Ph.D. student), Anthony Vodacek, Robert Kremens(LIAS), Carl Kelso (B.S. student)Project Scope: This project is a collaboration with researchers at NCAR, U Kentucky,CU-Denver <strong>and</strong> TAMU. The goal of this project is to develop a dynamic data drivensystem for modeling the propagation of wild l<strong>and</strong> fires. The end product will give wildl<strong>and</strong> fire managers a tool for predicting the propagation of wild l<strong>and</strong> fire with steering ofthe modeling results by data from ground sensors <strong>and</strong> remotely sensed data. RIT isdeveloping the interface to use thermal imagers such as WASP or WASP-Lite as airbornedata sources of fire location. Dr. Kremens is also continuing to develop ground sensormeasurement capabilities <strong>and</strong> experimental data on the optical <strong>and</strong> thermal radiationemitted by fires. RIT is creating synthetic images from the model output to facilitatecomparison to the ground sensor <strong>and</strong> airborne remote sensing data to provide steering ofthe model results. We are also using DIRSIG as a visualization tool for generatingsynthetic 3D fire scenes including the 3D structure of flames.Project Status: Two years of additional funding for this project was granted in 2007.Ph.D. student Zhen Wang took the output of the fire propagation model <strong>and</strong> combined48
that with DIRSIG’s atmospheric plume capabilities to generate 3D synthetic scenes ofwildl<strong>and</strong> fire as a fire would be observed by the WASP camera system (Figure 3.16.2-1).The method was validated by using the published Fire Radiative Energy (FRE) method toassess the radiance generated by DIRSIG in comparison to published estimates of FRE.Very good comparison was found, suggesting that the approaches used in generating the3-D flame structure <strong>and</strong> 2-D fire history are very reasonable. This capability to generatesynthetic data is a key component of the feedback process in which the fire propagationmodel output is steered according to the available remotely sensed images of a fire. Inthis case the fire propagation model output is used to generate a synthetic image that canthen be directly compared to a real image. Carl Kelso, a computer engineering studentworked with Dr. Kremens on improvements to the ground sensor systems used fordetermining the heat released during the passage of a wildfire <strong>and</strong> relating that to remotesensing measurement of fire radiation. Carl’s work was supported by supplemental NSFResearch Experience for Undergraduates (REU) funding. Further work on this projectwill use the 2003 Esperanza Fire in Southern California as a test case. Several sources ofairborne <strong>and</strong> satellite thermal images are available for testing the data assimilationsystem.Figure 3.16.2-1: DIRSIG generated synthetic nighttime grassfire scene using theWASP sensor midwave infrared channel specifications. The scene radiance includeshot ground, 3-D flame structure, <strong>and</strong> reflection of the infrared radiation off thenearby ground surface.3.17 <strong>Laboratory</strong> for Advanced Spectral <strong>Sensing</strong> (LASS)Sponsors: Lockheed-Martin, NROProject Scope: The LASS was established to conduct research aimed at improving multidimensionalremote sensing. The goal is to study the end-to-end process with an emphasis onlooking at fundamental phenomenology <strong>and</strong> new sensing techniques. Because of thefundamental nature of this work the participants share in the funding <strong>and</strong> the results are sharedwith all sponsors.Project Status: This year saw the continuation of several multiyear efforts including manywhich seek to improve the DIRSIG modeling environment <strong>and</strong> the initiation of some new49
thrusts in areas such as the role of spectral analysis in persistent surveillance <strong>and</strong> spectralquality metrics. The extensive range of LASS research tasks are summarized below.3.17.1 MegaScene 2Research Team: David Pogorzala, Eugenie Song (B.S. student), Jake Ward (Ph.D.student), Scott BrownTask Scope: Simulated MegaScenes are comprehensive data sets that are intended to bewidely used by the DIRSIG community. These scenes are recreations of real-world areas<strong>and</strong> are modeled to a high degree of spatial <strong>and</strong> spectral fidelity. The size of these scenesare several square kilometers, allowing the user to simulate data at oblique angles oralong flight lines.The first MegaScene was of a suburban region of <strong>Rochester</strong>, NY <strong>and</strong> contained manyhouses, grassy areas <strong>and</strong> paved surfaces. MegaScene 2, meant to act as a counterpart tothis, is located in Trona, CA. This town is situated near Death Valley National Park <strong>and</strong> isa predominately arid, mountainous, desert-like region. A large industrial facility islocated in the town which can be utilized in a number of ways in simulated imagery, froma chemical plant with gaseous plumes, to a nuclear power plant. The spatial fidelity of themajority of the scene is akin to that of MegaScene 1 (~1.0m), while the facility will bemodeled at a resolution of ~0.5m. The dry, mountainous environment lends itself toutilizing new DIRSIG capabilities, such as inhomogeneous atmospheric models <strong>and</strong> newmethods for recreating LWIR spatial-spectral variability.Task Status: All data necessary for creating MegaScene 2 has been acquired. Two groundtruth expeditions have been completed, resulting in the optical <strong>and</strong> thermal properties ofthe materials in the scene. Overhead imagery has been captured by the RIT WASP sensorsystem <strong>and</strong> will be used to drive the spatial <strong>and</strong> spectral variability in the terrain.Significant work has been done recently on the spatial aspects of the scene. At this pointnearly all objects have been geometrically modeled in a CAD environment. In addition,these CAD models have been assembled into a coherent “scene” atop a facetized terrainmodel. Each building <strong>and</strong> house has been placed on the terrain in its real-world UTMcoordinates, resulting in an accurate recreation of the town of Trona <strong>and</strong> the surroundingareas. The incorporation of the terrain has resulted in the need to modify the originalCAD models of the facility to account for variations in the z-height of various objects.50
Figure 3.17.1-1: Overhead RGB rendering of MegaScene 2.A preliminary DIRSIG rendering of a portion of the MegaScene 2 area, centered on theindustrial facility, is shown in Figure 3.17.1-1. The materials attributed to the geometryare temporary surrogates A shiny blue metal material has been used for the terrain <strong>and</strong> aorange-colored tank has been applied to all other geometry. These materials were chosenfor their vividness <strong>and</strong> for the significant contrast between the appearance of the twomaterials in the final scene. A second, oblique rendering of the scene is shown in Figure3.17.1-2. This image highlights the mountainous terrain present in the scene. Also evidentin this figure is a number of “floating” buildings, illustrating the problems encounteredwith the facility when the terrain was introduced.Figure 3.17.1-2: Oblique RGB rendering of MegaScene 2.51
3.17.2 Polarimetric <strong>Imaging</strong>Research Team: David Messinger, Chabitha Devaraj (Ph.D. student), David Pogorzala,Scott BrownTask Scope: The goal of this research is to better our underst<strong>and</strong>ing of polarimetricphenomenology in regards to remote sensing, to learn <strong>and</strong> overcome the challengesinvolved with simulating imagery acquired with a polarized sensor, <strong>and</strong> to develop toolsto exploit polarized imagery.Task Status: Several studies have been performed to help address the goals outlinedabove. The first experiment was aimed at validating the implementation of the polarizedversion of MODTRAN in DIRSIG. The WASP-Lite sensor system, developed at RIT,was outfitted with a series of polarizing filters. The sensor was then used to image the skyin several locations relative to the sun. The phenomenology observed in this data collectwas then verified with an extensive collection of simulations in DIRSIG. A scene wasconstructed consisting of simple, three-dimensional objects in the shapes of letterscorresponding to the compass directions (N, E, S, W). These letters were then arrangedon a flat terrain with the “N” to the north, the “E” to the east, <strong>and</strong> so on. These objectsserved as a visual reference as to which direction the sensor was pointed. Objects in theshapes of “+X”, “-X”, “+Y” <strong>and</strong> “-Y” were also added to help reference the scene inDIRSIG coordinates. Finally, a three-dimensional cube was inserted in the scene directlyabove the origin to serve as an indication of an elevation angle of 90 degrees. This scenewas simulated with a pushbroom sensor that was located at the origin, turned on its side,<strong>and</strong> was rotated on the z-axis for 360 degrees, starting <strong>and</strong> ending facing north (+Y). Theresulting image, shown in RGB in Figure 3.17.2-1, is a view of the entire sky. The cube isvisible as an elongated strip near the top of the image.Figure 3.17.2-1: RGB rendering of the skydome simulations.52
This scene was then simulated with polarized outputs from MODTRAN for severalcombinations of the time-of-day, the visibility of the atmosphere, <strong>and</strong> the elevation angleof the sun. Of the outputs from these simulations, the two that are most effective atencapsulating the polarized behavior of the atmosphere are the Degree of Polarization(DOP) <strong>and</strong> the Angle of Polarization (AOP). Two sets of these images are shown inFigures 3.17.2-2 <strong>and</strong> 3. The sun is at a high elevation angle in the first set <strong>and</strong> a low anglein the second. As expected, the DOP is lowest in the area around the sun <strong>and</strong> highest inareas orthogonal to it.Figure 3.17.2-2: DIRSIG-generated DOP (left) <strong>and</strong> AOP images of a polarized skydome with the sun at a low elevation angle.Figure 3.17.2-3: DIRSIG-generated DOP (left) <strong>and</strong> AOP (right) images of apolarized sky dome with the sun at a high elevation angle.A laboratory study was also conducted to verify the geometric coordinate transformationsused in the simulation tool. This study used a controlled illumination source <strong>and</strong> camerawith a rotatable polarization filter wheel to show that the surface reflection geometry,53
critical to accurate polarimetric image modelling, was correct.The final study that was performed attempted to tie together the previous validations torecreate a simple, natural, outdoor scene in DIRSIG. A small test area on the RIT campuswas imaged from the roof of the Center for <strong>Imaging</strong> Science by the WASP-Lite sensorsystem outfitted with polarizing filters. This scene, consisting of an area of grass, twotrees, a fire hydrant, <strong>and</strong> asphalt, was then reconstructed in the DIRSIG environment. Atthe time of the data collect, the asphalt had been partially removed during a repavingprocess, resulting in long grooves. The final DIRSIG images are shown as Stokes imagesin Figure 3.17.2-4.Figure 3.17.2-4: Polarimetric DIRSIG imagery; S0 (left), S1 (center) <strong>and</strong> S2 (right).3.17.3 Thermal Polarimetric <strong>Imaging</strong> BRDF MeasurementResearch Team: Michael Gartley (Ph.D. student), Scott Brown, Niek S<strong>and</strong>ers, JohnSchottProject Scope: This task is aimed at development <strong>and</strong> implementation of a thermalinfrared emissive polarization modeling capability in the DIRSIG model.Project Status: The project is nearing completion (expected in Fall 2007). A methodologyhas been developed to model the emissive polarimetric behavior based on thebidirectional reflection distribution function (BRDF) <strong>and</strong> the use of Kirchoff’s Law toconvert the integrated hemispheric reflectance to emissivity. To evaluate the method anapproach to measurement of polarimetric emissivity has been developed that uses alongwave infrared camera <strong>and</strong> a wire grid polarizer (see Figures 3.17.3-1 <strong>and</strong> -2). Figure3.17.3-3 shows a fit of measured data to modeled data illustrating how the BRDF modelscan effectively reproduce the measured data. Figure 3.17.3-4 shows the initial testing ofthe DIRSIG implementation on a sphere. This comparison of real <strong>and</strong> simulated dataillustrates that the initial implementation of the magnitude of the polarization degree ofpolarization (DOP), <strong>and</strong> the angular orientation of the polarization simulation are inagreement with observation.54
3.17.3-1: EZTherm LWIR camera <strong>and</strong> IR wire grid polarizer.3.17.3-2: Processing paths for Stoke’s generated imagery <strong>and</strong> emissivitymeasurements.3.17.3-3: Emissivity model (line) fit to experimentally measured emmissivity (points)for tree bark (left) <strong>and</strong> brick (right).55
3.17.3-4: Measured <strong>and</strong> DIRSIG images showing a sphere sitting on snow with aglossy plate in front with a sun elevation of 18 degrees.3.17.4 LIDAR Modeling <strong>and</strong> ApplicationSponsor(s): Lockheed MartinResearch Team: Scott Brown <strong>and</strong> Niek S<strong>and</strong>ersProject Scope:Continue to evolve <strong>and</strong> develop the laser remote sensing capability introduced intoDIRSIG. This includes the ability to model topographic LADAR <strong>and</strong> atmosphericLIDAR.Project Status:During the past year, several limitations of the DIRSIG model were addressed <strong>and</strong>improvements made to support enhanced capabilities. These include the following:• Improvements in analytical backscatter returns including a suite of unit tests.• Improvements to resolve problems with slant looking, horizontal looking <strong>and</strong> uplooking geometries.• Improvements to the distributed tool that performs “detection <strong>and</strong> geolocation” ofthe DIRSIG produced photon arrival cubes. This included an improved detectionmodel for Geiger-Mode Avalanche Photo Diode (GmAPD) devices that h<strong>and</strong>lesquantum efficiency <strong>and</strong> spontaneous noise generation. The improved tool alsoallows platform <strong>and</strong> scanning noise (uncertainty) to be incorporated during thisstage of the overall simulation.• Updates <strong>and</strong> improvements to available demonstration scenes <strong>and</strong> configurations.3.17.5 Persistence SurveillanceResearch Team: Andrew Adams (Ph.D. student), Niek S<strong>and</strong>ers, John Schott56
Project Scope: This project is intended to develop a capability to allow performancetradeoffs to be conducted between sample frequency, number of b<strong>and</strong>s, spatial resolution<strong>and</strong> signal-to-noise in persistence surveillance sensors. The expectation is that use ofmultib<strong>and</strong> data can significantly increase the time between samples thus freeing upimaging resources to keep multiple target sites under surveillance with a single sensor.Project Status: An approach to detect <strong>and</strong> localize change in multitemporal image frameshas been identified that is appropriate for both single b<strong>and</strong> <strong>and</strong> multiple b<strong>and</strong> data. Asynthetic image has been generated in DIRSIG that incorporates a variety of movingtargets (vehicles <strong>and</strong> people) <strong>and</strong> increasing levels of complexity (obscuration, crossing<strong>and</strong> dismounts) that will be used to test the proposed approaches (see Figure 3.17.5-1a).Initial tests on a single b<strong>and</strong> image have demonstrated that targets can be isolated withthe baseline algorithm (see Figure 3.17.5-1b). Future work will focus on implementation<strong>and</strong> testing of the multib<strong>and</strong> data.a) b)3.17.5-1: DIRSIG Movie a: full resolution (1024x1024), b: motion detection results (SingleB<strong>and</strong>—Green, 256x256)3.17.6 Spectral Target Detection Algorithmic ComparisonResearch Team: Manuel Ferdin<strong>and</strong>us (Masters’ student), John Schott, David MessingerProject Scope: Target detection algorithms for use in hyperspectral imagery rely onaccurate estimation <strong>and</strong> characterization of the “background” (i.e., not target) pixels inthe image. Typically this is done using simple first <strong>and</strong> second order statistics (means<strong>and</strong> covariances) to “train” the algorithm. There are several methods one can use tochoose which set of image pixels to use in training. This project seeks to underst<strong>and</strong>which methods are most appropriate for use in a given image or with a given targetsignature. The ultimate goal is to underst<strong>and</strong> why a particular method failed, <strong>and</strong>potentially to underst<strong>and</strong> how to characterize an image / target combination as beingpotentially either difficult or easy (in a quantitative sense) to detect. Here, a “target57
injection” method (based on the work of Dr. Stanley Rotman) was used to analyze notonly image pixels containing known targets, but the entire image regardless of thepresence of real targets on the ground. This method allows for a more general analysis ofan entire image to be conducted <strong>and</strong> indicates in which pixels a target may be particularlydifficult (or easy to detect).Project Status: This project will be completed in the summer of 2007. Visualizationmethods to qualitatively assess the various background characterization methods havebeen developed <strong>and</strong> an example is shown in Figure 3.17.6-1. Here, the per pixel colorcoding indicates which of the background characterization methods tested worked bestfor that pixel. The methods tested use various sets of pixels (grouped together by theirspectral signatures) to estimate either the background mean <strong>and</strong> / or covariance.Figure 3.17.6-1: (top) RGB of the test scene. (bottom) Example visualization of the bestbackground characterization method for a particular target / image pair. Here, “best” isdetermined by the minimum amount of sub-pixel fill factor required for detection. Blackareas indicate where man-made targets have been masked out.In this case the “best” method for a given pixel is that algorithm that could detect thetarget at the lowest sub-pixel fill factor (the target injection method allows the user tosimulate how sub-pixel the target is). Note that different methods are best for large openareas or along transition regions. In this case, the local estimation of both the mean <strong>and</strong>covariance (LMLC) is optimal but this is not the case for all targets <strong>and</strong> images tested.Ongoing work is investigating other image / target pairs to attempt to identifycorrelations <strong>and</strong> patterns.58
3.17.7 Background Texture Research (visible <strong>and</strong> thermal)Research Team: Jason Ward (Ph.D. student), David Pogorzala, John SchottProject Scope: This project is aimed at improving the texture in synthetic scenes. Thisincludes implementing improved methods of incorporating reflective texture in existingDIRSIG scenes. Texture is a major factor impacting both the visual appearance <strong>and</strong> theoverall scene statistics. Lack of adequate texture has been identified as one of the seriouslimits to using synthetic scenes for realistic target detection algorithm development.Project Status: Three methods of texture generation developed <strong>and</strong> tested on earlierefforts have been implemented in DIRSIG <strong>and</strong> applied to a region of RIT’s MegaScene I.The methods shown in Figure 3.17.7-1 are the traditional single b<strong>and</strong> texture metric, amodified multib<strong>and</strong> version of the original method <strong>and</strong> a significantly improved methodbased on fractional mixture maps. This last method has been shown to both visually <strong>and</strong>quantitatively improve the texture statistics in an image. However, it requires the user tohave fractional mixture maps of the materials within a class (e.g. green vegetation <strong>and</strong>soil within the grass field class). These methods can be employed on a class by classbasis in the new version of DIRSIG <strong>and</strong> the mixture mapping approach will be employedwhere possible on MegaScene II.3.17.7-1: DIRSIG generated scenes showing texture results using the traditional singleb<strong>and</strong> approach, the multib<strong>and</strong> approach <strong>and</strong> (for a different set of conditions) thefractional mixing model approach.Texture in thermal images is a much more complex task. This is because the texture isnot just a function of observable (in b<strong>and</strong>) surface properties (i.e. variation in reflectivityor emissivity) but also of temperature variation which is a function of solar absorptivity,surface orientation, shadowing <strong>and</strong> bulk thermal properties. To deal with these variationsDIRSIG is being improved to allow use of texture maps to control bulk thermalproperties. In addition an ongoing research project is aimed at developing methods tobuild these bulk property texture maps based on analysis of multitemporal thermalimagery. Some preliminary results from this approach are shown in Figure 3.17.7-2.These images are the result of model based fits of the DIRSIG thermal model with59
varying bulk materials properties within a class to the observed thermal images of theclass. The results show actual images <strong>and</strong> the predicted images based on fits to the model.a) b) c) d)e) f)3.17.7-2: LWIR 50 x 50 Pixel Example Imagery: (a) Original 5 AM, (b) Simulated 5AM, (c) Original 11 AM, (d) Simulated 11 AM, (e) Original 5 PM, (f) Simulated 5 PM3.17.8 DIRSIG Plume/Sensor Integration (QUIC <strong>and</strong> PIMS)Sponsor(s): Los Alamos National <strong>Laboratory</strong> (LANL)Research Team: Scott Brown <strong>and</strong> Niek S<strong>and</strong>ersProject Scope: The aim of this project was to integrate the advanced PIMS sensor modelfrom Los Alamos National <strong>Laboratory</strong> (LANL) with the sensor-reaching radiance resultsproduced by DIRSIG.Project Status: This collaboration has produced an initial version of PIMS capable ofautomatically <strong>and</strong> directly calling DIRSIG. This project has simplified combining thePIMS <strong>and</strong> DIRSIG models.60
3.17.8-1: A screenshot of the PIMS user interface.In support of this project, an “Interactive Mode” has been added to DIRSIG. It allowsusers to bypass DIRSIG’s platform <strong>and</strong> sensor models, communicating directly with theradiometry engine. This interface supports human-friendly plaintext, computer-friendlyXML, <strong>and</strong> high-performance binary output. It can be used to tightly integrate externalmodels with DIRSIG, <strong>and</strong> to integrate DIRSIG with systems engineering tool chains.Furthermore, the new functionality <strong>and</strong> interface is fully documented in the DIRSIGmanual.3.17.9 Improved DIRSIG User Interface <strong>and</strong> NetDIRSIGSponsor(s): National Reconnaissance Office (NRO)Research Team: Scott Brown <strong>and</strong> Paul LeeProject Scope:Primary goal is to create a user interface for DIRSIG that allows non-traditional (nonexpert)users to generate data with the model. This software client tool is designed to belightweight, easy to acquire <strong>and</strong> easy to use. The tool is also network enabled. The userisn’t required to install a traditional full copy of DIRSIG on their machine; rather theclient tool interacts with a network accessible repository of the DIRSIG inputs on aremote server. This client/server model simplifies <strong>and</strong> centralizes the maintenance of themodel inputs within an organization or within an inter-organization workspace. Theclient/server approach allows the “heavy computational lifting” of DIRSIG simulations tobe offloaded to the remote server which frees up the client machine. The completedsimulation products (imagery) are made available on the server for remote download.The long-term goal of this project is the creation of an extensive set of user interfaces thatallow many of the untapped features in DIRSIG4 to be discovered <strong>and</strong> exercised by theusers.61
Project Status:During the past year, the first version of this tool was completed <strong>and</strong> demonstrated.However, since documentation for installation of the client software, documentationinstallation of the server software <strong>and</strong> creation <strong>and</strong> documentation of the new datadescriptions have not been complete, the tool has not been widely distributed at this time.These tasks will be completed during 2008.Figure 3.17.9-1: A screenshot of the new graphical user interface running asimulation.3.17.10 Sparse/segmented Aperture Image Quality ModelingResearch Team: Brian Daniel (Ph.D. student), Jason Smith (Ph.D. student), John SchottProject Scope: This project is aimed at extending RIT’s efforts to model <strong>and</strong> evaluateimage quality associated with sparse <strong>and</strong> distributed apertures. Most of the work in thisarea has been associated with astronomy where the targets are approximately pointsources <strong>and</strong> spectrally well behaved (i.e. gray). Earlier work at RIT has shown that thespectral nature of extended scenes can introduce image artifacts in restored images fromsparse aperture systems that would not have been predicted using the gray world modelscommonly used to predict image quality.Project Status: This effort is focused on evaluating the impact of using phase retrievalalgorithms on restored image quality from sparse <strong>and</strong> segmented aperture systems. In62
particular the impact on spectrally diverse extended images is of interest. Methods togenerate in focus <strong>and</strong> out of focus images based on full spectral modeling of extendedscenes have been developed (see Figure 3.17.10-1). Ongoing efforts are focused onimplementation of a phase diversity retrieval algorithm to estimate the optical pathdifference induced phase distortions in the images <strong>and</strong> on methods to estimate imagequality in the restored images.3.17.10-1: Initial simulations of phase diversity model showing (clockwise from topleft) input image, in focus image through sparse aperture telescope, pupil function oftelescope showing optical path differences in shades of gray, restored image <strong>and</strong>defocused image.3.17.11 Spectral Image UtilityResearch Team: Marcus Stefanou (Ph.D. Student) <strong>and</strong> John KerekesProject Scope: This project is an effort toward the development of quantitative metricsfor spectral image quality analogous to the use of the National Imagery InterpretabilityRating Scale (NIIRS) <strong>and</strong> the associated General Image Quality Equation (GIQE).Project Status: The project has two main thrusts. First, the domain of image quality as itrelates to spectral imagery <strong>and</strong> its application is being surveyed <strong>and</strong> a taxonomic structureof components <strong>and</strong> characteristics developed. Second, an initial approach is beingdeveloped for characterizing the utility of a spectral image in the context of targetdetection.Figure 3.17.11-1 graphically illustrates the elements of a remote sensing spectral imagingsystem including the scene, the atmosphere, the sensor <strong>and</strong> the processing performedleading to the desired information. Spectral image quality can be thought of has havingtwo components contributing to a measure of quality: image fidelity <strong>and</strong> image utility.63
Image Fidelity – How faithfully does an image represent scene truth?Image AcquisitionScene Atmosphere Sensor ProcessingDesiredInformationInformation ExploitationImage Utility –How useful (for a given application) is an image?Figure 3.17.11-1: Components of spectral image quality: fidelity <strong>and</strong> utility.As shown in the figure, image fidelity refers to the ability of the sensor to faithfully capture<strong>and</strong> represent all important features in the scene. Image utility refers to the usefulness ofthe image for a desired application.This project is focusing on developing methods for the quantitative description of spectralimage utility in the context of target detection. The approach is to start with a givenspectral image as collected or retrieved from a database. The question we are exploringthen is, can one provide a quantitative metric to predict how useful this image can be indetecting a specified target.The approach is to explore various methods of parametrically representing the salientspectral features in a spectral image <strong>and</strong> then use those parameters to predict targetdetection performance. Figure 3.17.11-2 shows an example comparison between actualperformance for detecting a subpixel target in a given image compared to performancepredicted by three different parametric models. In this particular case, the T-distributionmodel compares best with the actual performance.64
Figure 3.17.11-2: ROC curve comparing achieved performance with various model-basedpredictions for detecting a specified subpixel target in a given spectral image.4.0 RIT Funded Core Research4.1 DIRSIG InfrastructureSponsor(s): Internally fundedResearch Team: Scott Brown, Niek S<strong>and</strong>ers, Mike Gartley <strong>and</strong> Adam Goodenough (Ph.D.student)Project Scope:In addition to the sponsored research projects that address the enhancement of the DIRSIGmodel, RIT has been slowly increasing the amount of staff time spent working oninfrastructural DIRSIG development. This ranges from the purchasing <strong>and</strong> maintenance ofthe server used to distribute the model to the general maintenance of the software <strong>and</strong>supporting software development systems. Historically, the creation of the new <strong>and</strong>improved DIRSIG4 model was largely funded internally.Project Status:One of the fundamental funding streams for DIRSIG core development has been varioussources of RIT internal funding. The primary source of this funding has become the DIRSIGTraining Courses, which was offered on three (3) different occasions during the 2007calendar.During most of the past year, the development team focused on Release 4.1. The importantmilestones of this release cycle were significant amounts of radiometry improvementsresulting from verifications against previous generations of DIRSIG <strong>and</strong> analytical solutions.Another important focus was the expansion of the unit testing facility to ensure the correct65
operation on the low-level code components over time. At this time, the unit-testingframework performs 1,400+ individual tests. The verification of the model fitness with theunit-testing tool is now an integral part of the software release process <strong>and</strong> the tool isdistributed to the users as a way to verify the software installation process. Important newfeatures added to DIRSIG4 in 2007 included the addition of secondary (man-made) sources<strong>and</strong> the incorporation of the “participating medium” tools developed by Adam Goodenoughfor his littoral zone modeling. The improvements made by Mike Gartley during his Ph.D.work to support emissive polarization simulation have also made their way into the DIRSIG4releases.In 2008, the development team will continue to provide the user community with improvedversions of the DIRSIG model with an increased focus on release testing, verification <strong>and</strong>validation. This upcoming year will also see the transition to the new user interfacesdeveloped (in part) under the NetDIRSIG effort <strong>and</strong> revised training <strong>and</strong> documentation toeducate the user community.4.2 Facility/Process ModelingResearch Team: Jacob Clements (Ph.D. student), John Schott, Michael Richardson, ScottBrown, David MessingerProject Scope: This project represents the initiation of a long term effort to develop <strong>and</strong>evaluate new approaches to data processing, database management (metadata tagging) <strong>and</strong>analysis of multisensor-multimodal data with an aim of radically changing the way data areanalyzed <strong>and</strong> the types of information that can be extracted from multiple ways to “touch” atarget.Project Status: The initial thrusts for the project fall into three categories. One aims todevelop ways to register multisensor data using 3 dimensional geometric models of theworld. This effort will be an extension of earlier efforts at RIT to develop semi-autonomousmethods for registering 2D image data <strong>and</strong> methods to construct geometric target modelsfrom 3D LIDAR point clouds (see Figure 4.2-1 (Walli 2003) <strong>and</strong> 4.2-2 (Lach <strong>and</strong> Kerekes2007) ). The 3D registration task will be initiated Fall (2007).4.2-1a: The image crop has induced a -25 pixel shift in x & y for the inverse transformsampling. Automated control points are highlighted.66
4.2-1b: Confirming the registration results through visual inspection of overlaid <strong>and</strong>original images. The dark image to the left is the difference maps showing very low signals(i.e. complete registration).4.2-2: Use of LIDAR point clouds (left) to form facetized model (middle) that can beregistered to EO imagery or used to generate simulated images (right).A second thrust category is aimed at ways to organize <strong>and</strong> visualize multisensor-multitemporaldata. It is common for us to have many measurements of a location of interest. These may beoverhead images from a range of platforms <strong>and</strong> sensors acquired over a wide time history,ground photos, data from other sensor types <strong>and</strong> text <strong>and</strong> graphical data. A focus for this researchis to develop ways to allow an analyst to seamlessly interact with these various data types. Oneof the initial questions will focus on issues around how well the data need to be registered <strong>and</strong>how to project the data in space <strong>and</strong> time in ways the analyst can efficiently visualize <strong>and</strong>analyze. These first two thrusts will feed each other with the registration task providing betterdata to the visualization task <strong>and</strong> the visualization task helping to set various requirements on theregistration task. As part of this visualization <strong>and</strong> interaction task we expect to engage RIT’sComputer Gaming department to try to bring new perspectives <strong>and</strong> approaches to ways tointeract with data. Our goal is to totally emerse the analyst in the data using the advancedhardware <strong>and</strong> software available on state of the art general purpose computers. This task has asits initial focus a water treatment plant that falls in the RIT MegaScene site that is adjacent to theCamp Eastman site that RIT regularly uses for field tests. As a result, we already have extensivecoverage of the site with a variety of sensors <strong>and</strong> are continuing to acquire data on a regular basis(Figure 4.2-3 shows a variety of image samples). This thrust area is just getting started with aninitial emphasis on identifying potential commercial software to support data manipulation <strong>and</strong>interaction <strong>and</strong> organization of existing data.67
(a)(b)(c)(d)Figure 4.2-3: Multi-sensor Image Data over the VanLare Water Treatment Facility (a)(b), Compass RGB Image (c) (d) Oblique RGB Color (image courtesy of PictometryInternational) (e) SEBAS LWIR Image(e)The third thrust area is focused on efforts to merge data <strong>and</strong> models in a fashion that blurs thedistinction between data <strong>and</strong> models. A good example of the goal here is the meteorologicalcommunity where we have a wide variety of surface, satellite imaging <strong>and</strong> non imaging sensors<strong>and</strong> forecast models that are used collectively to extract meteorological information <strong>and</strong> makeinformed forecast (predictions of behavior). With this as a guide we are looking to merge 3Dgeometric site models with image <strong>and</strong> non image data <strong>and</strong> process models (e.g. models ofprocesses associated with a particular site) to allow an analyst ways to interact with the data <strong>and</strong>the models to address more complex intelligence questions. For example, I know what the site isin general (e.g. chemical plant) but not what it is producing (compound x, y, z), how much,when, where it is going, or what confidence do I have (i.e. what other hypothesis might be valid<strong>and</strong> how could I deny or confirm an alternate hypothesis)? Clearly the registration <strong>and</strong>visualization thrusts are critical enablers to the data/model fusion tasks. The initial efforts on thistask have been to identify the water treatment site described above as an initial study site. Wehave developed a working relationship with the facility operators <strong>and</strong> are beginning to developconceptual models for various processes at the site. We already have an initial DIRSIG model of68
the site (see Figure 4.2-4), however, we suspect a more rigorous site model may be required tosupport this effort. Ongoing efforts are aimed at defining signatures associated with variousprocess models <strong>and</strong> definition of ways to merge various data sources into a common data/modelenvironment. These include GIS data, a wide range of overhead images, ground photos, textdata, plant process models, thermodynamic models, etc….Figure 4.2-4: DIRSIG image (left) <strong>and</strong> real image (right) of study site.The goal of this thrust area is to develop an initial demonstration of a fused data/process modelof the site which can be used to evaluate hypothesis concerning various operating conditions fora facility, including confidence estimates.References:Karl Walli, “Multisensor Image Registration Utilizing the LoG Filter <strong>and</strong> FWT”,Unpublished Masters Thesis, <strong>Rochester</strong> Institute of Technology, New York, 2003.Stephen R. Lach <strong>and</strong> John P. Kerekes, "Multisource Data Processing for Semi-AutomatedRadiometrically-Correct Scene Simulation", URBAN/URS, Paris, April 2007.69
5.0 Publications5.1 Books <strong>and</strong> Journal ArticlesKerekes, J.P. <strong>and</strong> Schott, J.R. "Hyperspectral <strong>Imaging</strong> Systems," chapter in HyperspectralData Exploitation: Theory <strong>and</strong> Applications, C.-I. Chang, editor, Wiley-Interscience,Hoboken, NJ, 2007.Li, Y., Vodacek, A., Zhu, Y. An automatic statistical segmentation algorithm forextraction of fire <strong>and</strong> smoke regions. doi:10.1016/j.rse.2006.10.023. <strong>Remote</strong> <strong>Sensing</strong> ofEnvironment. 108:171-178. (2007).Li, Y., Vodacek, A., Raqueno, N., Kremens, R., Garrett, A.J., Bosch, I., Makarewicz,J.D., Lewis, T.W. Circulation <strong>and</strong> stream plume modeling in ConesusLake. doi:10.1007/s10666-007-9090-x. Published online April 21, 2007, EnvironmentalModeling <strong>and</strong> Assessment. (2007).Ononye, A.E., Vodacek, A., Saber, E. Automated extraction of fire line parameters frommultispectral infrared images. doi:10.1016/j.rse.2006.09.029. <strong>Remote</strong> <strong>Sensing</strong> ofEnvironment. 108:179-188. (2007).Schott, J.R., <strong>Remote</strong> <strong>Sensing</strong>: The Image Chain Approach, 2nd Ed., Oxford UniversityPress, 2007.Weith-Glushko, S.A.; Walli, K.C.; Salvaggio, C., Automatic tie point selection using theLaplacian of Gaussian (LoG) spatial filter, Submitted for publication in the SPIE Journalof Applied <strong>Remote</strong> <strong>Sensing</strong> (2008)Boonmee, M.; Schott, J.R.; Messinger, D.W.; Salvaggio, C., Validation <strong>and</strong> sensitivityanalysis of the Optimized L<strong>and</strong> Surface Temperature <strong>and</strong> Emissivity Retrieval(OLSTER) algroithm using thermal infrared hyperspectral imagery, Submitted forpublication in Sensors (2007)Hattenberger, T.J.; Fairchild, M.D.; Johnson, G.M.; Salvaggio, C., A psychophysicalinvestigation of global illumination algorithms used in augmented reality, Accepted forpublication in ACM Transactions on Applied Perception (2007)5.2 Published ProceedingsM<strong>and</strong>el, J., J.D. Beezley, L.S. Bennethum, S. Chakraborty, J.L. Coen, C.C. Douglas, J.Hatcher, M. Kim, <strong>and</strong> A. Vodacek. A dynamic data driven wildl<strong>and</strong> fire model Y. Shi,G.D. van Albada, P.M.A. Sloot <strong>and</strong> J.J. Dongarra (Eds). Computational Science - ICCS70
2007, Lecture Notes in Computer Science. Springer. Vol. 4487. p. 1042-1049.doi:10.1007/978-3-540-72584-8_137 (2007).Douglas, C.C., D. Li, R.A. Lodder, R.E. Ewing, Y. Efendiev, G. Qin, J. Coen, M. Kritz,J.D. Beezely, J. M<strong>and</strong>el, M. Isk<strong>and</strong>arani, A. Vodacek, G. Haase. DDDAS approaches towildl<strong>and</strong> fire modeling. Proceedings of the First China-Japan-Korea-Joint Conferenceon Numerical Mathematics, August 3-7, Sapporo, Japan, H. Okamoto, D. Sheen, Z. Shi,T. Ozawa, T. Sakajo, <strong>and</strong> Y. Chen (eds.), Hokkaido University Mathematics Report 112.(2006).Douglas, C.C., R.A. Lodder, R.E. Ewing, Y. Efendiev, G. Qin, J. Coen, M. Kritz, J.D.Beezley, J. M<strong>and</strong>el, M. Isk<strong>and</strong>arani, A. Vodacek, G. Haase. DDDAS Approaches toWildl<strong>and</strong> Fire Modeling <strong>and</strong> Contaminant Tracking. Proc. Winter SimulationConference, WSC 06. p. 2117-2124. doi:10.1109/WSC.2006.323011 (2006).Kerekes, J.P. "Parameter Studies for Spectral Imager Application Performance,"Proceedings of the 2006 IEEE International Geoscience <strong>and</strong> <strong>Remote</strong> <strong>Sensing</strong> Symposium(IGARSS), pp. 352-355, Denver, Colorado, 2006.Kerekes, J.P. "Model-based Exploration of HSI Spaceborne Sensor Requirements withApplication Performance as the Metric," Proceedings of the 2006 IEEE InternationalGeoscience <strong>and</strong> <strong>Remote</strong> <strong>Sensing</strong> Symposium (IGARSS), pp. 1613- 1616, Denver,Colorado, 2006.P. Chouinard <strong>and</strong> J. Kerekes, "Decision Fusion of Hyperspectral <strong>and</strong> SAR Data forTrafficability Assessment," Proceedings of the 2006 IEEE International Geoscience <strong>and</strong><strong>Remote</strong> <strong>Sensing</strong> Symposium (IGARSS), pp. 2313-2316, Denver, Colorado, 2006.K. Strackerjan, L. Smith, <strong>and</strong> Kerekes, J.P., "Modeling the Spectral Effects of Water <strong>and</strong>Soil as Surface Contaminants in a High Resolution Optical Image Simulation,"Proceedings of the 2006 IEEE International Geoscience <strong>and</strong> <strong>Remote</strong> <strong>Sensing</strong> Symposium(IGARSS), pp. 3757-3760, Denver, Colorado, 2006.Barsi, J.A., Simon J. Hook, Frank D. Palluconi, John R. Schott, <strong>and</strong> Nina G. Raqueno,“L<strong>and</strong>sat TM <strong>and</strong> ETM+ thermal b<strong>and</strong> calibration,” Proceedings of SPIE, Vol. 6296,62960F, San Diego August 2006.Dobbs, B., Niek J. S<strong>and</strong>ers, <strong>and</strong> John R. Schott,” The incorporation of atmosphericvariability in hyperspectral synthetic scene simulation,” Proceedings of SPIE, Vol. 6302,63020C, San Diego August 2006.Ientilucci, E.J., Bajorski, P., "Statistical Models for Physically Derived Target Sub-Spaces", In Proc. SPIE, <strong>Imaging</strong> Spectrometry XI, Vol. 6302, San Diego, CA, August2006.Klempner, S.L., Brent Bartlett, <strong>and</strong> John R. Schott, “Ground truth-based variability71
analysis of atmospheric inversion in the presence of clouds,” Proceedings of SPIE, Vol.6301, 630109, San Diego August 2006.Julia A. Barsi, Simon J. Hook, Frank D. Palluconi, John R. Schott; Nina G. Raqueno,“L<strong>and</strong>sat TM <strong>and</strong> ETM+ thermal b<strong>and</strong> calibration”, Proceedings Vol. 6296, October2006.S. Lach <strong>and</strong> J. Kerekes, “Multisource Data Processing for Semi-AutomatedRadiometrically-Correct Scene Simulation,” Proceedings of the IEEE Urban <strong>Remote</strong><strong>Sensing</strong> Joint Event, Paris, France, April 2007.Casey, J., Lach, S. <strong>and</strong> Kerekes, J.P., "Processing Misregistered Hyperspectral Data,"Proceedings of Algorithms <strong>and</strong> Technologies for Multispectral, Hyperspectral, <strong>and</strong>Ultraspectral Imagery XIII, SPIE Vol. 6565, Defense <strong>and</strong> Security Symposium, Orl<strong>and</strong>o,Florida, 2007.5.3 Technical Reports5.4 PresentationsVodacek, A., “Water Quality <strong>and</strong> DDSAS,” 2006 DDDAS <strong>and</strong> Environmental ProblemsWorkshop, National <strong>Laboratory</strong> for Scientific Computing (LNCC), Petropolis, Brazil,July 12, 2006.Li, Y. <strong>and</strong> A. Vodacek. “Comparison of the Simulated Optical Properties of a RiverPlume with In Situ Measurements <strong>and</strong> MODIS 250 m Reflectance Data in Lake Ontario,”Ocean Optics XVIII, Montreal, Quebec, October 9-13, 2006.Zhu, Y., <strong>and</strong> A. Vodacek. “Updated Optical Property Measurements for Lake Ontario,”Ocean Optics XVIII, Montreal, Quebec, October 9-13, 2006.Wang, Z., <strong>and</strong> A. Vodacek. “A Fast Approach to Infrared Scene Generation,” EastFIREConference, Fairfax, Virginia, June 5, 2007.Schott, J.R., “Incorporation of Physics Based Models into a Hyperspectral TargetDetection Algorithm”, Office of Naval Research Symposium, Woods Hole, MA,September 2006.Schott, J.R., “Incorporation of Physics Based Modeling to <strong>Remote</strong>ly SensedSpectroscopic Synthetic Image Generation <strong>and</strong> Algorithm Development”,University of <strong>Rochester</strong>, December 2006.Spivey, A., Y. Zhu, Y. Li, <strong>and</strong> A. Vodacek. “Lake Ontario Water Quality MonitoringModel,” ASLO Aquatic Sciences Meeting, Santa Fe, New Mexico, February 9, 2007.72
6.0 DIRS Student Thesis <strong>and</strong> Capstone ProjectsIn recognition of the work of our students over the years, we list not only the current capstoneprojects, but also the work of all the students who worked on DIRS projects since the laboratorywas organized in 1981.Ph.D. DissertationsSnyder, W., An in-scene parameter estimation method for quantitative image analysis, Unpublished doctoraldissertation, <strong>Rochester</strong> Institute of Technology, New York, 1994.Feng, X., Design <strong>and</strong> performance evaluation of a modular imaging spectrometer instrument, Unpublished doctoraldissertation, <strong>Rochester</strong> Institute of Technology, New York, 1995.Gross, H., An image fusion algorithm for spatially enhancing spectral mixture maps, Unpublished doctoraldissertation, <strong>Rochester</strong> Institute of Technology, New York, 1996 US Air Force.Kuo, D., Synthetic image generation of factory stack <strong>and</strong> cooling tower plumes. Unpublished doctoral dissertation,<strong>Rochester</strong> Institute of Technology, New York, 1997 US Air Force.Fairbanks, R., A characterization of the impact of clouds on remotely sensed water quality. Unpublished doctoraldissertation, <strong>Rochester</strong> Institute of Technology, New York 1999 US Air Force.S<strong>and</strong>ers, L., An Atmospheric Correction Technique for Hyperspectral Imagery, Unpublished doctoral dissertation,<strong>Rochester</strong> Institute of Technology, New York, 1999.Hern<strong>and</strong>ez-Baquero, E., Characterization of the Earth's surface <strong>and</strong> atmosphere from multispectral <strong>and</strong> hyperspectralthermal imagery, Unpublished doctoral dissertation, <strong>Rochester</strong> Institute of Technology, New York, 2000 US AirForce.Bishop, Jonathan., Modeling of Plume Dispersion <strong>and</strong> Interaction with the Surround of Synthetic <strong>Imaging</strong>Applications, Unpublished doctoral dissertation, <strong>Rochester</strong> Institute of Technology, New York, 2001 US Air Force.Burton, Robin, Elastic LADAR Modeling for Synthetic <strong>Imaging</strong> Applications. Unpublished doctoral dissertation,<strong>Rochester</strong> Institute of Technology, New York, 2002 US Air Force.Meyers, Jason, Modeling Polarimetric <strong>Imaging</strong> using DIRSIG. Unpublished doctoral dissertation, <strong>Rochester</strong>Institute of Technology, New York, 2002 US Air Force.Lee, Kyungsuk, A Subpixel Target Detection Algorithm for Hyperspectral Imagery, Unpublished doctoraldissertation, <strong>Rochester</strong> Institute of Technology, New York, 2004.Introne, Robert, Enhanced Spectral Modeling of Sparse Aperture <strong>Imaging</strong> Systems, Unpublished doctoraldissertation, <strong>Rochester</strong> Institute of Technology, New York, 2004 US Air Force.Ientilucci, Emmett, Hyperspectral Sub-Pixel Target Detection using Hybrid Algorithms <strong>and</strong> Physics BasedModeling, Unpublished doctoral dissertation, <strong>Rochester</strong> Institute of Technology, New York, 2006.Shell, James, Polarimetric <strong>Remote</strong> <strong>Sensing</strong> in the Visible to Near Infrared, Unpublished doctoral dissertation,<strong>Rochester</strong> Institute of Technology, New York, 2006 US Air Force.Blevins, Daniel, Modeling Scattering <strong>and</strong> Absorption for a Differential Absorption LIDAR System, Unpublisheddoctoral dissertation, <strong>Rochester</strong> Institute of Technology, New York, 2006 US Air Force.73
Li, Ying, <strong>Remote</strong> <strong>Sensing</strong> Algorithm Development for Wildl<strong>and</strong> Fire Detection <strong>and</strong> MappingUnpublished doctoral dissertation, <strong>Rochester</strong> Institute of Technology, New York, 2006.Gartley, Michael, Polarimetric Modeling of <strong>Remote</strong>ly Sensed Scenes in the Thermal InfraredUnpublished doctoral dissertation, <strong>Rochester</strong> Institute of Technology, New York, 2007.Li, Yan, An Integrated Water Quality Modeling System with Dynamic <strong>Remote</strong> <strong>Sensing</strong> Feedback,Unpublished doctoral dissertation, <strong>Rochester</strong> Institute of Technology, New York, 2007.M.S. ThesesA.J. Sydlik, 1981, "A technique for calculating atmospheric scattering <strong>and</strong> attenuation effects of aerial photographicimagery from totally airborne acquired data" Canadian ForcesArthur Byrnes, 1983, “A Comparison Study of Atmospheric Radiometric Calibration Methods for AerialThermgrams” Canadian ForcesLawrence Maver, 1983, "The effects of shadow visibility on image interpretability"George Grogan, 1983, "A model to predict the reflectance from a concrete surface as a function of the sun-objectimageangular relationship"Ian. Macleod, 1984, "An airborne thermal remote sensing calibration technique" Canadian ForcesWilliam Volchok, 1985, "A study of multispectral temporal scene normalization using pseudo-invariant features,applied to L<strong>and</strong>sat TM imagery"Joseph Biegel, 1986, "Evaluation of quantitative aerial thermography"Tim Hawes, 1987, "L<strong>and</strong> cover classification of L<strong>and</strong>sat thematic mapper images using pseudo-invariant featurenormalization applied to change detection" U.S. Air ForceCarl Salvaggio, 1987, "Automated segmentation of urban features from L<strong>and</strong>sat thematic mapper imagery for use inpseudo-invariant feature temporal image normalization"Wayne Farrell, 1987, “Investigation of the Accuracy of Array Radiometry for Measuring Pulsed Radiation Sources”Canadian ForcesJohn Francis, 1989, "Pixel-by-pixel reduction of atmospheric haze effects in multispectral digital imagery"Denis Robert, 1989, "Textural features for classification of images" Canadian ForcesJan North, 1989, "Fourier image synthesis <strong>and</strong> slope spectrum analysis"Michael Davis, 1990, "Bidirectional spectral reflectance field instrument"Wendy Rosenblum, 1990, "Optimal selection of textural <strong>and</strong> spectral features for scene segmentation"Eric Shor, 1990, "Longwave infrared synthetic scene simulation"James Warnick, 1990, "A quantitative analysis of a self-emitting thermal IR scene simulation system"Curtis Munechika, 1990, "Merging panchromatic <strong>and</strong> multispectral images for enhanced image analysis" U.S. AirForceXiaofan Feng, 1990, "Comparison of methods for generation of absolute reflectance factor measurements for BRDFstudies"Rol<strong>and</strong>o Raqueño, 1990, "Automated boundary detection of echocardiograms" (M.S. Computer Science)Wendy Rosenblum, May 1990, “Optimal selection of textural <strong>and</strong> spectral features for scene segmentation”Eric Shor, May 1990, “3-D longwave infrared synthetic scene simulation”Jonathan Wright, 1991, "Evaluation of LOWTRAN <strong>and</strong> MOTRAN for use over high zenith angle/long path lengthviewing" U.S. Air ForceCraig Eubanks, 1991, "Comparison of ellipso-polarimetry <strong>and</strong> dark field methods for determining of thicknessvariations in thin films"Marc Lapointe, 1991, “Substitution of the Statistical Range for the Variance in Two Local Noise SmoothingAlgorithms” Canadian ForcesRobert Mericsko, 1992, "Enhancements to atmospheric correction techniques for multiple thermal images"Gustav Braun, 1992, "Quantitative evaluation of six multi-spectral, multi-resolution image merger routines"Sharon Cady, 1992, "Multi-scene atmospheric normalization of airborne imagery: application to the remotemeasurement of lake acidification"David Ehrhard, 1992, "Application of Fourier-based features for classification of synthetic aperture radar imagery"U.S. Air ForceBernard Brower, 1992, "Evaluation of digital image compression algorithms for use on lap top computers"74
Sharon Cady, April 1992, “Multi-scene atmospheric normalization of airborne imagery: Application to the remotemeasurement of lake acidification”Robert Merisko, 1992, “Enhancement to atmospheric-correction techniques for multiple thermal images”Donna Rankin, 1992, "Validation of DIRSIG an infrared synthetic scene generation model"Adam Hanson, 1993, “Character recognition of optically blurred textual images using moment invariants”Craig Laben, 1993, "A comparison of methods for forming multitemporal composites from NOAA advanced veryhigh resolution radiometer data"Kaleen Moriarty, 1993, “Automated image-to-image rectification for use in change detection analysis as applied toforest clearcut mapping”Tom Servoss, 1993, "Infrared symbolic scene comparator"Richard Stark, 1993, "Synthetic image generator model: application of specular <strong>and</strong> diffuse reflectivity components<strong>and</strong> performance evaluation in the visible region" U.S. Air ForceEleni Paliouras, 1994, "Characterization of spatial texture for use in segmentation of synthetic aperture radarimagery"Robert Rose, 1994, "The generation <strong>and</strong> comparison of multispectral synthetic textures"Joseph Sirianni, 1994, "Heat transfer in DIRSIG an infrared synthetic scene generation model"Gary Ralph, 1994, "Characterization of the radiometric performance of an IR scene projector" Canadian ForcesSerge Dutremble, 1995, "Temporal sampling of forward looking infrared imagery for subresolution enhancementpost processing" Canadian ForcesElizabeth Frey, 1995, “An examination of distributional assumptions in L<strong>and</strong>sat TM imagery”Steven Nessmiller, 1995, "A comparison of the performance of non-parametric classifiers with Gaussian maximumlikelihood for the classification of multispectral remotely sensed data" U.S. Air ForceJim Salicain, 1995, "Simulation of camera model sensor geometry effects"Alex<strong>and</strong>er J. Granica, 1996, "Modeling of the radiometric characteristics of a simulated flourescent imager"Todd A. Kraska, 1996, "<strong>Digital</strong> <strong>Imaging</strong> <strong>and</strong> <strong>Remote</strong> <strong>Sensing</strong> Image Generation Model: infrared airborne validation& input parameter analysis" U.S. Air ForceFrank J. Tantalo, 1996, "Modeling the MTF <strong>and</strong> noise characteristics of an image chain for a synthetic imagegeneration system"Russell A. White, 1996, "Validation of <strong>Rochester</strong> Institute of Technology’s (RIT’s) <strong>Digital</strong> Image <strong>and</strong> <strong>Remote</strong><strong>Sensing</strong> Image Generation (DIRSIG) model-reflective region" U.S. Air ForceJeffrey Allen, 1997, "Methods of digital classification accuracy assessment"Paul Llewellyn Barnes, 1997, "In-scene atmospheric correction for multispectral imagery"Todd Birdsall, 1997, "The development of an analytical model for the Kodak digital science color infrared cameras<strong>and</strong> its aerial imaging applications"Phil Edwards, 1997, "A Canadian Resource Guide for a Water Quality Study of Lake Ontario" Canadian ForcesGary Robinson, 1997, "Evaluation of two applications of spectral mixing models to image fusion" U.S. Air ForceDavid Schlingmeier, 1997, "Resolution enhancement of thermal infrared images via high resolution class-map <strong>and</strong>statistical methods" Canadian ForcesTom Haake, 1998, "Modeling Topography Effects with DIRSIGDavid Joseph, 1998, "DIRSIG: A broadb<strong>and</strong> validation <strong>and</strong> evaluation of potential for infrared imagingspectroscopy"Julia Laurenzano, 1998, "A comparative analysis of spectral b<strong>and</strong> selection techniques" U.S. Air ForceFrancois Alain, 1999, “Simulation of <strong>Imaging</strong> Fourier Transform Spectrometers Using DIRSIG” Canadian ForcesDilkushi Anuja de Alwis, 1999, “Simulation of the formation <strong>and</strong> propagation of the thermal bar on Lake Ontario”Daisei Konno, 1999, “Development <strong>and</strong> Testing of Improved Spectral Unmixing Techniques”Emmett Ientilucci, 1999, “Synthetic simulation <strong>and</strong> modeling of image intensified CCDs (IICCD)”Pete Arnold, 2000, “Modeling <strong>and</strong> Simulating Chemical Weapon Dispersal Patterns in DIRSIG”Julia Barsi, 2000, “MISI <strong>and</strong> L<strong>and</strong>sat ETM+ : thermal calibration <strong>and</strong> atmospheric correction”Robert Gray, 2000, “Modeling Forests for Synthetic Image Generation” Computer ScienceMary Ellen Miller, 2000, "An approach for assessment of Great Lakes Water Quality using <strong>Remote</strong> <strong>Sensing</strong>”Nikole Wilson, 2000, "Hyperspectral <strong>Imaging</strong> for Bottom Type Classification <strong>and</strong> Water Depth Determination"Kirk Knobelspiesse, 2000, "Atmospheric Compensation for SeaWiFS Images of Lake Superior"John Klatt, 2001, “Error Characterization of Spectral Products using a Factorial Designed Experiment” CanadianForcesAndrew Fordham, 2002, “B<strong>and</strong> Selection <strong>and</strong> Algorithm Development for <strong>Remote</strong> <strong>Sensing</strong> of Wildfires”75
Neil Scanlan, 2003, “Comparative Performance Analysis of Texture Characterization Models in DIRSIG” CanadianForcesKarl Walli, 2003, “Multisensor Image Registration Utilizing the LoG Filter <strong>and</strong> FWT”, US Air ForceKris Barcomb, 2004, “High Resolution, Slant Angle Scene Generation <strong>and</strong> Validation of Concealed Targets inDIRSIG”, US Air ForceGabriel Dore, 2004, “Multiframe Super-Resolution of Color Image Sequences Using a Global Motion Model”,Canadian ForcesErin Peterson, 2004, “Synthetic L<strong>and</strong>mine Scene Development <strong>and</strong> Validation in DIRSIG”,US Air ForceNancy Baccheschi, 2005, “Generation of a Combined Dataset of Simulated RADAR <strong>and</strong> Electro-Optical Imagery”,US Air ForceNoah Block, 2005, “A Sensitivity Study of a Polychromatic Sparse Aperture System”.David Grimm, 2005, “Comparison of Hyperspectral Imagery Target Detection Algorithm Chains”,US Air Force.Melissa Hofer (Computer Science), 2005, “A website <strong>and</strong> corresponding database to support the <strong>Digital</strong> <strong>Imaging</strong><strong>and</strong> <strong>Remote</strong> <strong>Sensing</strong> (DIRS) lab in the Chester F. Carlson Center for <strong>Imaging</strong> Science at the <strong>Rochester</strong> Institute ofTechnology”Gretchen Sprehe, 2005, "Application of Phenology to Assist in Hyperspectral Species Classification in a NorthernHardwood Forest"Jason West, 2005, “Matched Filter Stochastic Background Characterization for Hyperspectral Target Detection”, USAir ForcePierre Chouinard, 2006, “Decision Fusion of Hyperspectral <strong>and</strong> Synthetic Aperture Radar Imagery for TrafficabilityAssessment”, Canadian Forces.Brian Dobbs, 2006, “The incorporation of atmospheric variability into DIRSIG”Kristin-Elke Strackerjan, 2006, Modeling the Spectral Effects of Water <strong>and</strong> Soil as Surface Contaminants in a HighResolution Optical Image Simulation”, Canadian ForcesAdam Cisz, 2006, “Performance Comparison of Hyperspectral Target Detection Algorithms”.Seth Weith-Glushko, 2007, “Quantitative analysis of infrared contrast enhancement algorithms”Domenico Luisi, 2007, “Conceptual design <strong>and</strong> Specification of a MICROSATELLITE Forest fire DetectionSystem” Canadian Forces.B.S. ProjectsJeffrey Sefl, 1983, "Determination of the transformation relationship of pseudo-invariant features of two L<strong>and</strong>satimages"Kirk Smedley, 1986, "<strong>Imaging</strong> l<strong>and</strong>/water demarcation lines for coastal mapping"David Sapone, 1988, "Verification of a thermal model through radiometric methods"Joshua Colwell <strong>and</strong> Eric Higgins, 1988, "Determination of the modulation transfer function of a thermal infraredline scanner"Donald Marsh, 1989, "Photometric processing <strong>and</strong> interpretation of ratioed imagery by multispectral discriminateanalysis for separation of geologic types"Fred Stellwagon, 1989, "Classification of mixed pixels"Brian Jalet, 1991, "Evaluation of methods of cloud removal in multidate NOAA/AVHRR imaging <strong>and</strong> itsapplication to vegetational growth monitoring"Mike Heath, 1991, "Perspective scene generation employing real imagery"Stephen Ranck, 1991, "Establishment of a simple geographic information system utilizing digital data"James Schryver, 1991, "Topographical analysis of a raster geographic information system"Robert Rose, 1992, "Design of the information dissemination technique for a heat loss study"Joseph Sirianni, 1992, "Production of realistic-looking sky radiance in the SIG process"Andy Martelli, 1992, "Color calibration of an Agfa matrix QCR camera for Ektar 100 <strong>and</strong> 125 color print films"Mike Branciforte, 1993, "An automated video tracking unit based on a matched filter segmentation algorithm"Brian Heath, 1993, "Use of a quad cell in tracking a unit"Debbie Wexler, 1993, "Texture generation using a stochastic model"Michael Platt, 1994, "Evaluation of the feasibility of using digital terrain elevation models for the generation ofmultispectral images at L<strong>and</strong>sat resolution"Cory Mau, 1994, "Incorporation of wind effects in IR scene simulation"76
Paul Barnes, 1995, "Introduction of vegetation canopy models into DIRSIG"Jeff Ducharme, 1995, "Atmospheric downwelled radiance"Chip Garnier, 1995, "Integrating sphere calibration"Jeff Allen, 1996, "Comparison of modeled <strong>and</strong> real vegetation imagery"Emmett Ientilucci, 1996, "Blackbody calibration of MISI"Charles Farnung, 1997, "DIRSIG camouflage phenomenology"Peter Arnold, 1997, "BRDF approximation using a mathematical cone function"Julia Barsi, 1997, "The generation of a GIS database in support of Great Lakes Studies"Jason Calus, 1997, "Modeling of focal plane geometry in DIRSIG"Arnold Hunt, 1997, "Validation of BRDF model in DIRSIG"Michael C. Baglivio, 1998, “Error Characterization of the Alpha Residuals Emissivity Extraction Technique”Brian Bleeze, 1998, “Modeling the MTF <strong>and</strong> Noise Characteristics of Complex Image Formation Systems”Chia Chang, 1998, “Evaluation of Inversion Algorithms on DIRSIG Generated Plume Model Simulations”Peter Kopacz, 1998, “Simulation of Geometric Distortions in Line Scanner Imagery”Jason Hamel, 1999, “Simulation of Spectra Signatures of Chemical Leachates from L<strong>and</strong>fills”Daniel Newl<strong>and</strong>, 1999, “Evaluation of Stepwise Spectral Unmixing with HYDICE Data”J. Meghan Salmon, 2000, "Derivative Spectroscopy for <strong>Remote</strong> <strong>Sensing</strong> of Water Quality"Janel Schubbuck, 2000, "Thermal Calibration of MISI"Matt Banta, 2001, “Lunar Calibration Techniques”Christy Burtner, 2001, “Texture Characterization in DIRSIG”Adam Goodenough, 2001.”Evaluating Water Quality Monitoring with Hyperspectral Imagery”Robert Light, 2001, "Hamamatsu R5900-01-L16 Photomultiplier Tube Spectral / Spatial Characterization"Erin O'Donnell, 2001, “Historical Radiometric Calibration of L<strong>and</strong>sat 5”Nikolaus Schad, 2001, “Hyperspectral Classification with Atmospheric Correction”Cindy Scigaj, 2001, “Design <strong>and</strong> Implementation of a LIDAR <strong>Imaging</strong> System”Eric Sztanko, 2001. “<strong>Imaging</strong> Fourier Transform Spectrometer: Design, Construction, <strong>and</strong> Evaluation”Eric Webber, 2001, “Sensitivity Analysis of Atmospheric Compensation Algorithms for Multispectral SystemsConfiguration”Adam Cisz, 2002, “Multispectral Fire Detection: Thermal/IR, Potassium, <strong>and</strong> Visual”Rose of Sharon Daly, 2002, “Polarimetric <strong>Imaging</strong>”Matthew D. Egan, 2002, “Detection <strong>and</strong> Analysis of Industrial Gas Plumes”Carolyn S. Kennedy, 2002, “The Testing <strong>and</strong> Assessment of Texturing Tools Used to Build Scenes in DIRSIG”David Pogorzala, 2002, “Setting Fire to CIS, Small - Scale Combustion Chamber <strong>and</strong> Instrumentation”Jonathan Antal, 2002, “Error Characterization of Hyperspectral Products with Emphasis on Atmospheric CorrectionTechniques”Kenneth R. Ewald, 2002, “Creation of ISO Target 16067-1”Jared Clock, 2003, “Inexpensive Color Infrared Camera”Gary Hoffmann, 2003, “Visual Enhancement of the Archimedes Palimpsest Using a Target Detection Algorithm”Jill Marcin, 2003, “Effects of Contamination on Spectral Signatures”Br<strong>and</strong>on Migdal, 2004, “Watermark Extraction Methods for Linearly Distorted Images to Maximize Signal-to-NoiseRatio”Alvin Spivey, 2004, “An approach to synthetic scene completion <strong>and</strong> periodic noise removal by image inpainting<strong>and</strong> resynthesis”Seth Weith-Glushko, 2004, “Automatic Tie-Point Generation for Oblique Aerial Imagery: An Algorithm”Rachael Gold, 2005 “Performance Analysis of the Invariant Algorithm for Target Detection in HyperspectralImagery”Michael Muldowney, 2005, “Time Series Analysis of Late Summer Microcystis Algae Blooms through <strong>Remote</strong><strong>Sensing</strong>”Brian Staab, 2005, “Investigation of Noise <strong>and</strong> Dimensionality Reduction Transforms on Hyperspectral Data asApplied to Target Detection”Christopher Bayer, 2005, “Development of algorithm for fusion of hyperspectral <strong>and</strong> multispectral imagery with theobjective of improving spatial resolution while retaining spectral data”Michael Denning, 2007, “Classification of astronomical infrared sources using Spitzer space telescope data”Justin Kwong, 2007, “Impact of calibration errors on physics based target detection”Sarah Paul, 2007, “Investigation of VisiBall glasses claims”77
7.0 Special Events7.1 DIRS Annual Research SymposiumThe DIRS Annual Research Symposium was held on June 5, 2007. It was another wellattended event providing an opportunity to share results with our corporate <strong>and</strong> governmentsponsors. Topics covered in this year’s event are outlined as follows:• Semi-automated Scene Building – Stephen Lach (Ph.D. Student)• Synthetic Modeling using Photonic Mapping – Adam Goodenough (Ph.D. Student)• Mechanical Draft Cooling Tower Modeling – Matthew Montanaro (Ph.D. Student)• Polarimetric <strong>Imaging</strong> Systems: analysis <strong>and</strong> modeling – David Messinger (ResearchFaculty)• DIRSIG: Current State of Development – Scott Brown (Research Staff)• Physics-based Algorithm Development Status – Emmett Ientilucci (Research Staff)• Geometric Modeling <strong>and</strong> Processing of MISI HSI Data – Jason Casey (M.S. Student)• Fusion of LIDAR <strong>and</strong> HSI Data for Target Detection – Michael Foster (Ph.D. Student)• Water Quality Prediction using MODIS <strong>and</strong> ALGE – Anthony Vodacek (Faculty)• Airborne <strong>Imaging</strong> Applications – Don McKeown (Research Staff)We also had opportunity to discuss research priorities <strong>and</strong> received excellent feedback fromour partners.78