GRAIL: Scalable Reachability Index for Large Graphs â - CiteSeerX
GRAIL: Scalable Reachability Index for Large Graphs â - CiteSeerX
GRAIL: Scalable Reachability Index for Large Graphs â - CiteSeerX

You also want an ePaper? Increase the reach of your titles
YUMPU automatically turns print PDFs into web optimized ePapers that Google loves.
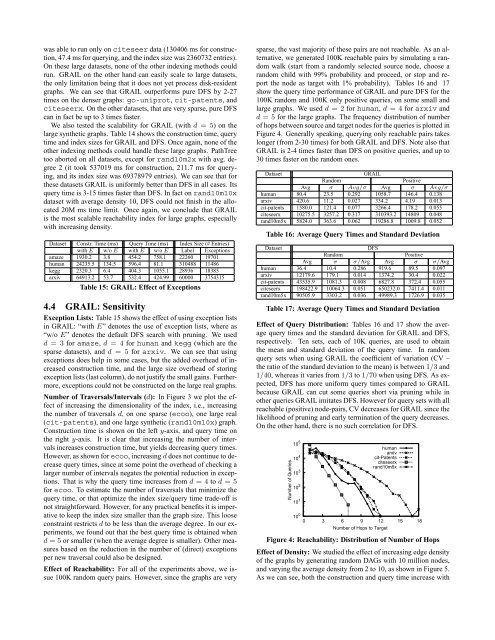
was able to run only on citeseer data (130406 ms <strong>for</strong> construction,47.4 ms <strong>for</strong> querying, and the index size was 2360732 entries).On these large datasets, none of the other indexing methods couldrun. <strong>GRAIL</strong> on the other hand can easily scale to large datasets,the only limitation being that it does not yet process disk-residentgraphs. We can see that <strong>GRAIL</strong> outper<strong>for</strong>ms pure DFS by 2-27times on the denser graphs: go-uniprot, cit-patents, andciteseerx. On the other datasets, that are very sparse, pure DFScan in fact be up to 3 times faster.We also tested the scalability <strong>for</strong> <strong>GRAIL</strong> (with d = 5) on thelarge synthetic graphs. Table 14 shows the construction time, querytime and index sizes <strong>for</strong> <strong>GRAIL</strong> and DFS. Once again, none of theother indexing methods could handle these large graphs. PathTreetoo aborted on all datasets, except <strong>for</strong> rand10m2x with avg. degree2 (it took 537019 ms <strong>for</strong> construction, 211.7 ms <strong>for</strong> querying,and its index size was 69378979 entries). We can see that <strong>for</strong>these datasets <strong>GRAIL</strong> is uni<strong>for</strong>mly better than DFS in all cases. Itsquery time is 3-15 times faster than DFS. In fact on rand10m10xdataset with average density 10, DFS could not finish in the allocated20M ms time limit. Once again, we conclude that <strong>GRAIL</strong>is the most scalable reachability index <strong>for</strong> large graphs, especiallywith increasing density.Dataset Constr. Time (ms) Query Time (ms) <strong>Index</strong> Size (# Entries)with E w/o E with E w/o E Label Exceptionsamaze 1930.2 3.8 454.2 758.1 22260 19701human 24235.5 134.5 596.4 81.1 310488 11486kegg 2320.3 6.4 404.3 1055.1 28936 18385arxiv 64913.2 53.7 532.4 424.99 60000 3754315Table 15: <strong>GRAIL</strong>: Effect of Exceptions4.4 <strong>GRAIL</strong>: SensitivityException Lists: Table 15 shows the effect of using exception listsin <strong>GRAIL</strong>: “with E” denotes the use of exception lists, where as“w/o E” denotes the default DFS search with pruning. We usedd = 3 <strong>for</strong> amaze, d = 4 <strong>for</strong> human and kegg (which are thesparse datasets), and d = 5 <strong>for</strong> arxiv. We can see that usingexceptions does help in some cases, but the added overhead of increasedconstruction time, and the large size overhead of storingexception lists (last column), do not justify the small gains. Furthermore,exceptions could not be constructed on the large real graphs.Number of Traversals/Intervals (d): In Figure 3 we plot the effectof increasing the dimensionality of the index, i.e., increasingthe number of traversals d, on one sparse (ecoo), one large real(cit-patents), and one large synthetic (rand10m10x) graph.Construction time is shown on the left y-axis, and query time onthe right y-axis. It is clear that increasing the number of intervalsincreases construction time, but yields decreasing query times.However, as shown <strong>for</strong> ecoo, increasingddoes not continue to decreasequery times, since at some point the overhead of checking alarger number of intervals negates the potential reduction in exceptions.That is why the query time increases from d = 4 to d = 5<strong>for</strong> ecoo. To estimate the number of traversals that minimize thequery time, or that optimize the index size/query time trade-off isnot straight<strong>for</strong>ward. However, <strong>for</strong> any practical benefits it is imperativeto keep the index size smaller than the graph size. This looseconstraint restricts d to be less than the average degree. In our experiments,we found out that the best query time is obtained whend = 5 or smaller (when the average degree is smaller). Other measuresbased on the reduction in the number of (direct) exceptionsper new traversal could also be designed.Effect of <strong>Reachability</strong>: For all of the experiments above, we issue100K random query pairs. However, since the graphs are verysparse, the vast majority of these pairs are not reachable. As an alternative,we generated 100K reachable pairs by simulating a randomwalk (start from a randomly selected source node, choose arandom child with 99% probability and proceed, or stop and reportthe node as target with 1% probability). Tables 16 and 17show the query time per<strong>for</strong>mance of <strong>GRAIL</strong> and pure DFS <strong>for</strong> the100K random and 100K only positive queries, on some small andlarge graphs. We used d = 2 <strong>for</strong> human, d = 4 <strong>for</strong> arxiv andd = 5 <strong>for</strong> the large graphs. The frequency distribution of numberof hops between source and target nodes <strong>for</strong> the queries is plotted inFigure 4. Generally speaking, querying only reachable pairs takeslonger (from 2-30 times) <strong>for</strong> both <strong>GRAIL</strong> and DFS. Note also that<strong>GRAIL</strong> is 2-4 times faster than DFS on positive queries, and up to30 times faster on the random ones.Dataset<strong>GRAIL</strong>RandomPositiveAvg σ Avg/σ Avg σ Avg/σhuman 80.4 23.5 0.292 1058.7 146.4 0.138arxiv 420.6 11.2 0.027 334.2 4.19 0.013cit-patents 1580.0 121.4 0.077 3266.4 178.2 0.055citeseerx 10275.5 3257.2 0.317 310393.2 14809 0.048rand10m5x 5824.0 363.6 0.062 19286.8 1009.8 0.052Table 16: Average Query Times and Standard DeviationDatasetDFSRandomPositiveAvg σ σ/Avg Avg σ σ/Avghuman 36.4 10.4 0.286 919.6 89.5 0.097arxiv 12179.6 179.1 0.014 1374.2 30.4 0.022cit-patents 43535.9 1081.3 0.008 6827.8 372.4 0.055citeseerx 198422.9 10064.3 0.051 650232.0 7411.4 0.011rand10m5x 90505.9 3303.2 0.036 49989.3 1726.9 0.035Table 17: Average Query Times and Standard DeviationEffect of Query Distribution: Tables 16 and 17 show the averagequery times and the standard deviation <strong>for</strong> <strong>GRAIL</strong> and DFS,respectively. Ten sets, each of 10K queries, are used to obtainthe mean and standard deviation of the query time. In randomquery sets when using <strong>GRAIL</strong> the coefficient of variation (CV –the ratio of the standard deviation to the mean) is between 1/3 and1/40, whereas it varies from 1/3 to 1/70 when using DFS. As expected,DFS has more uni<strong>for</strong>m query times compared to <strong>GRAIL</strong>because <strong>GRAIL</strong> can cut some queries short via pruning while inother queries <strong>GRAIL</strong> imitates DFS. However <strong>for</strong> query sets with allreachable (positive) node-pairs, CV decreases <strong>for</strong> <strong>GRAIL</strong> since thelikelihood of pruning and early termination of the query decreases.On the other hand, there is no such correlation <strong>for</strong> DFS.Number of Queries10 5 humanarxiv10 4cit-Patentsciteseerxrand10m5x10 310 210 110 00 3 6 9 12 15 18Number of Hops to TargetFigure 4: <strong>Reachability</strong>: Distribution of Number of HopsEffect of Density: We studied the effect of increasing edge densityof the graphs by generating random DAGs with 10 million nodes,and varying the average density from 2 to 10, as shown in Figure 5.As we can see, both the construction and query time increase with