Statistics for Science Fair Cheat Sheet
Statistics for Science Fair Cheat Sheet
Statistics for Science Fair Cheat Sheet

Create successful ePaper yourself
Turn your PDF publications into a flip-book with our unique Google optimized e-Paper software.
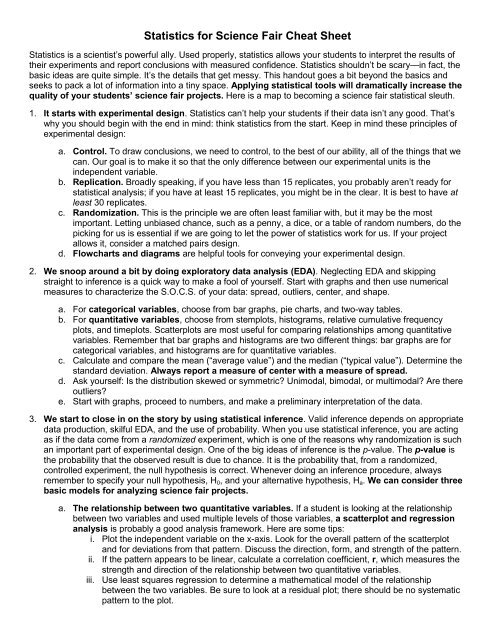
<strong>Statistics</strong> <strong>for</strong> <strong>Science</strong> <strong>Fair</strong> <strong>Cheat</strong> <strong>Sheet</strong><strong>Statistics</strong> is a scientist’s powerful ally. Used properly, statistics allows your students to interpret the results oftheir experiments and report conclusions with measured confidence. <strong>Statistics</strong> shouldn’t be scary—in fact, thebasic ideas are quite simple. It’s the details that get messy. This handout goes a bit beyond the basics andseeks to pack a lot of in<strong>for</strong>mation into a tiny space. Applying statistical tools will dramatically increase thequality of your students’ science fair projects. Here is a map to becoming a science fair statistical sleuth.1. It starts with experimental design. <strong>Statistics</strong> can’t help your students if their data isn’t any good. That’swhy you should begin with the end in mind: think statistics from the start. Keep in mind these principles ofexperimental design:a. Control. To draw conclusions, we need to control, to the best of our ability, all of the things that wecan. Our goal is to make it so that the only difference between our experimental units is theindependent variable.b. Replication. Broadly speaking, if you have less than 15 replicates, you probably aren’t ready <strong>for</strong>statistical analysis; if you have at least 15 replicates, you might be in the clear. It is best to have atleast 30 replicates.c. Randomization. This is the principle we are often least familiar with, but it may be the mostimportant. Letting unbiased chance, such as a penny, a dice, or a table of random numbers, do thepicking <strong>for</strong> us is essential if we are going to let the power of statistics work <strong>for</strong> us. If your projectallows it, consider a matched pairs design.d. Flowcharts and diagrams are helpful tools <strong>for</strong> conveying your experimental design.2. We snoop around a bit by doing exploratory data analysis (EDA). Neglecting EDA and skippingstraight to inference is a quick way to make a fool of yourself. Start with graphs and then use numericalmeasures to characterize the S.O.C.S. of your data: spread, outliers, center, and shape.a. For categorical variables, choose from bar graphs, pie charts, and two-way tables.b. For quantitative variables, choose from stemplots, histograms, relative cumulative frequencyplots, and timeplots. Scatterplots are most useful <strong>for</strong> comparing relationships among quantitativevariables. Remember that bar graphs and histograms are two different things: bar graphs are <strong>for</strong>categorical variables, and histograms are <strong>for</strong> quantitative variables.c. Calculate and compare the mean (“average value”) and the median (“typical value”). Determine thestandard deviation. Always report a measure of center with a measure of spread.d. Ask yourself: Is the distribution skewed or symmetric? Unimodal, bimodal, or multimodal? Are thereoutliers?e. Start with graphs, proceed to numbers, and make a preliminary interpretation of the data.3. We start to close in on the story by using statistical inference. Valid inference depends on appropriatedata production, skilful EDA, and the use of probability. When you use statistical inference, you are actingas if the data come from a randomized experiment, which is one of the reasons why randomization is suchan important part of experimental design. One of the big ideas of inference is the p-value. The p-value isthe probability that the observed result is due to chance. It is the probability that, from a randomized,controlled experiment, the null hypothesis is correct. Whenever doing an inference procedure, alwaysremember to specify your null hypothesis, H 0 , and your alternative hypothesis, H a . We can consider threebasic models <strong>for</strong> analyzing science fair projects.a. The relationship between two quantitative variables. If a student is looking at the relationshipbetween two variables and used multiple levels of those variables, a scatterplot and regressionanalysis is probably a good analysis framework. Here are some tips:i. Plot the independent variable on the x-axis. Look <strong>for</strong> the overall pattern of the scatterplotand <strong>for</strong> deviations from that pattern. Discuss the direction, <strong>for</strong>m, and strength of the pattern.ii. If the pattern appears to be linear, calculate a correlation coefficient, r, which measures thestrength and direction of the relationship between two quantitative variables.iii. Use least squares regression to determine a mathematical model of the relationshipbetween the two variables. Be sure to look at a residual plot; there should be no systematicpattern to the plot.
iv. Consider per<strong>for</strong>ming inference about the regression slope. This is a t-test with the nullhypothesis that there is no linear relationship. See section B (below) <strong>for</strong> more on t-tests.v. Least squares regression and the correlation coefficient can only be used <strong>for</strong> data with alinear relationship. If the relationship is not linear, more advanced methods can be used totrans<strong>for</strong>m the relationship so least squares regression can be used.b. Comparing data from two different groups. If your student is examining differences between twogroups of data, then an examination of boxplots and a t-test is probably the statistical path ofchoice.i. Plot the data using a side-by-side boxplot. Based on the plots, ask, “Does there appear tobe a difference between these groups?” “Does the experimental group seem to be larger orsmaller than the control group?”ii. Based on the context of the project, determine the alternative hypothesis, H a . Do you thinkthat the experimental group has a smaller mean than the control group? That theexperimental group has a larger mean than the control group? Or simply that the groups aredifferent from one another?iii. Define a level of significance (e.g. P< 0.05). Carry out the two-sample t-test, examine the P-value, and determine if the difference between the groups is statistically significant.iv. Evaluate the practical significance of the difference between the groups.v. Report the results of the inferential analysis in the context of your experiment.vi. If you are trying to determine if a set of data is different from a specific value, then the t-procedures are probably still the statistical tool of choice. However, instead of using a twosamplet-test, use a one-sample t-test. Also, if your student used a matched pairs design,the t-procedures are slightly different; consult one of the references below <strong>for</strong> details.vii. When comparing differences between more than two groups, ANOVA may be a moreappropriate choice. See one of the references below <strong>for</strong> details.c. Inference <strong>for</strong> categorical variables. If a student is doing a genetics project, they are probablyinterested in knowing whether the results of their experiment match the expected distribution ofphenotypes or genotypes. Other projects that have categorical variables that are expected to take aspecific distribution can also be analyzed with this technique.i. Start with a two-way table. Calculate marginal distributions and determine the differencesbetween the marginal distributions of the experimental and control group(s).ii. If possible, use a bar graph or pie chart to show the distribution differences among thevarious groups. Remember that bar graphs are often easier to make and understand.iii. Use a chi-square test <strong>for</strong> goodness of fit. Determine the test statistic, Χ 2 , and the p-value.iv. If the chi-square test finds a significant result, examine the distribution to find the largestcomponents of the chi-square statistic.4. We combine the results of exploratory data analysis and inferential analysis with our analyticalintuition to figure out what the data are telling us.5. We clearly present our results using the language of statistics.a. State the statistical hypothesis along with your scientific hypothesis in the hypothesis section ofyour presentation/paper. Be sure to express the reasoning behind the hypothesis.b. Use a flowchart to show the experimental design. In the methods/procedures section, point out howreplication, control, and randomization were utilized.c. Show both exploratory data analysis and inferential analysis in the data analysis section. Discussthe meaning of graphs and numerical measures. State the level of significance used in your tests(e.g. P