QIP Spreadsheet 2011-12- Final (3).xlsx - Windsor Regional Hospital
QIP Spreadsheet 2011-12- Final (3).xlsx - Windsor Regional Hospital
QIP Spreadsheet 2011-12- Final (3).xlsx - Windsor Regional Hospital
- No tags were found...
You also want an ePaper? Increase the reach of your titles
YUMPU automatically turns print PDFs into web optimized ePapers that Google loves.
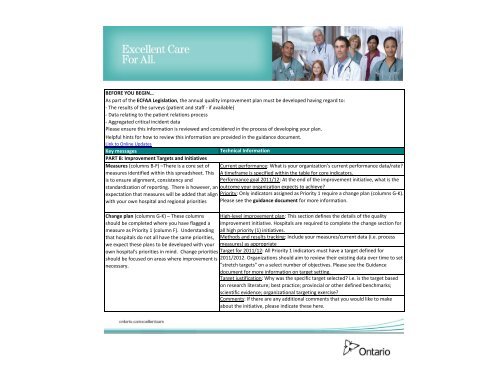
BEFORE YOU BEGIN…As part of the ECFAA Legislation, the annual quality improvement plan must be developed having regard to:‐ The results of the surveys (patient and staff ‐ if available)‐ Data relating to the patient relations process‐ Aggregated critical incident dataPlease ensure this information is reviewed and considered in the process of developing your plan.Helpful hints for how to review this information are provided in the guidance document.Link to Online UpdatesKey messagesTechnical InformationPART B: Improvement Targets and InitiativesMeasures (columns B‐F) –There is a core set of Current performance: What is your organization’s current performance data/rate?measures identified within this spreadsheet. This A timeframe is specified within the table for core indicators.is to ensure alignment, consistency andPerformance goal <strong>2011</strong>/<strong>12</strong>: At the end of the improvement initiative, what is thestandardization of reporting. There is however, an outcome your organization expects to achieve?expectation that measures will be added that align Priority: Only indicators assigned as Priority 1 require a change plan (columns G‐K).with your own hospital and regional priorities Please see the guidance document for more information.Change plan (columns G‐K) – These columns High‐level improvement plan: This section defines the details of the qualityshould be completed where you have flagged a improvement initiative. <strong>Hospital</strong>s are required to complete the change section formeasure as Priority 1 (column F). Understanding all high priority (1) initiatives.that hospitals do not all have the same priorities, Methods and results tracking: Include your measures/current data (i.e. processwe expect these plans to be developed with your measures) as appropriateown hospital's priorities in mind. Change priorities Target for <strong>2011</strong>/<strong>12</strong>: All Priority 1 indicators must have a target defined forshould be focused on areas where improvement is <strong>2011</strong>/20<strong>12</strong>. Organizations should aim to review their existing data over time to setnecessary.“stretch targets” on a select number of objectives. Please see the Guidancedocument for more information on target setting.Target justification: Why was the specific target selected? i.e. is the target basedon research literature; best practice; provincial or other defined benchmarks;scientific evidence; organizational targeting exercise?Comments: If there are any additional comments that you would like to makeabout the initiative, please indicate these here.
PART B: Improvement Targets and Initiatives[Insert <strong>Hospital</strong> Logo]<strong>Windsor</strong> <strong>Regional</strong> <strong>Hospital</strong> | 1995 Lens Avenue | <strong>Windsor</strong>Indicates WRH Core Quality indicatorsPlease do not edit or modify provided text in Columns A, B & CAIM MEASURE CHANGEQuality dimension Objective Outcome Measure/IndicatorCurrentperformancePerformancegoal <strong>2011</strong>/<strong>12</strong>Priority Improvement initiative Methods and results trackingTarget for<strong>2011</strong>/<strong>12</strong>Target justificationCommentsSafetyImprove providerhand hygienecomplianceOverall HH compliance (based on 4 moments of HH): % of observedstaff who wash their hands appropriately accotrding to the MoHLTCmoments of hand hygiene criteria. Average for Jan-Dec. 2010(adjusted)92.69521) Continue with assessment and monitoring ofcompliance with the performance of the 4 moments ofhand hygiene - auditing all staff and departments2) Continue to report results of hand hygieneperformance weekly and escalate auditing of those staffand departments that are below established thresholdWeekly and monthly hand hygiene audits as perestablished schedule- On spot and co-auditing withInfection Prevention and Control to continueweelyMonday Morning Directors Huddle andDepartmental weekly safety huddles and monthlyClincal Red Green process -aim for 95 %compliance95no established benchmark;provincial average 2009-10provincial average was 72% for 2of 4 moments3) Provide ongoing education about the need for HandHygiene performanceOn spot feedback provided with each audit90% completion of annual elearning programReduce incidence of<strong>Hospital</strong> acquiredinfections<strong>Hospital</strong> Acquired Infections(HAI): the number of hospital acquiredinfections expressed as a rate per 1000 patient days. The infectionsincluded are: Multiple-Resistant Staph Aureus (MRSA), Vancomycin-Resistant Enterococci (VRE) Clostridium Difficile (C diff). WRH Averagefor Jan-Dec. 20100.7560.875/1000patient days21) Continue monitoring and communication of incidenceof admit with and newly acquired hospital acquired(VRE, MRSA and Cdiff) incidents2) Reinforce Infection control practices for dealing withpatients with those admitted and newly acquiredinfections3) Provide ongoing education about Infection Preventionand Contro practices (notification, signage, use ofpersonal protective equipment2 time per week Infection Prevention and Controlreporting of inhouse status of infectionsWeekly staff safety huddles on each unitAuditing of unit base practices by Clinical Practiceand Infection Prevention and Control RN's90% completion of annual elearning programdocumentation of on spot/on unit educationsessions in Infection Prevention and Controldatabase0.875/1000 patientdaysno established Canadian or Ontariobenchmark as VRE and MRSAreported include blood borneinfections our target is set at 10%improvement based on our pastperformanceReduce incidence ofpatient falls withinjuryPatient Falls with Injury: the number of reported inpatient falls withinjury expressed as a rate per 1000 patient days. WRH Average for Jan-Dec. 20100.<strong>12</strong>0.25/1000patient days21) Continue to monitor compliance with Fall riskassessment and implementation of appropriate fallreducation interventions and performance of comfortrounds2) Monitor and communicate the number of falls numberof total falls and falls with injuryOngoing auditing conducted by Clinical Practiceand Operational ManagersMonday Morning Directors Huddle andDepartmental weekly safety huddles0.25/1000 patientdaysno established benchmark; ourtarget is set at 10% improvementbased on WRH past performanceReduce rate ofirreplaceablespecimen incidentsReduce high alertmedicationIncidentsPatient Specimen Incidents: the total number of irreplaceable specimens(those which would be difficult or impossible to recollect) rec’d by the labper month. Average for Jan-Dec. 2010High Alert Medication Incidents: the total number of medicationerrors/month occurring involving high risk drugs (insulin, anticoagulants,chemotherapy agents, sedation and narcotics). Includes near misses andthose that reached the patient. Average for3.25180 irreplaceablespecimens0 High AlertMedicationIncidents113) Perform root cause analysis/investigations for all falls Falls prevention team to track results ofwith Injury to identify trending and communicate investigations in excel data base to identify andfindings and corrective actioncommunicate opportunities for improvement1) Continue monitoring and communication of the Monday Morning Directors Huddle andincidents of patient specimen incidents for irreplaceable Departmental weekly safety huddles and monthlyand unacceptable incidentsClinical Red Green process3) Perform root cause analysis/investigations for allirreplacable specimen incidence for trending andcorrective actionTrack results of investigation through theformation of a new database3) Provide ongoing education opportunities for unit staff Track and monitor compliance with completion ofabout correct procedure in dealing with patient specimen elearning course Target 100%incidents1) Improve the reporting and documentation of Highalert medication incidents including near misses andthose that reach the patient2) Perform investigations for all High Alert Medicationincidents looking for trends to improve medicationadministration process3) Review all medication administration policies andpracticesWeekly and monthly tracking of all medicationincidents including high ralert medicationHigh Alert team to track results of investigationthrough audit process and communicate findings0 irreplaceablespecimens0 High AlertMedicationIncidentsno established benchmark; this is ahigh risk to patient safetyno established benchmark; this is ahigh risk to patient safety
AIM MEASURE CHANGEQuality dimension Objective Outcome Measure/IndicatorSafety (cont'd)EffectivenessReduce medicationReconciliationErrorsReduce clostridiumdifficile associateddiseases (CDI)Reduce unnecessarydeaths in hospitalsImproveorganizationalfinancial healthMedication Reconciliation Error resulting in Medication Incidents:This indicator includes the number of medication incidents (reaching thepatient) resulting from medication reconciliation errors.Average forSept -Dec. 2010CDI rate per 1,000 patient days: Number of patients newly diagnosedwith hospital-acquired CDI, divided by the number of patient days in thatmonth, multiplied by 1,000 - Average for Jan-Dec. 2010, consistent withpublicly reportable patient safety dataHSMR: number of observed deaths/number of expected deaths x 100 - FY2009/10, CIHIActual vs Expected Cose Per Equivalent Weighted Case: is the Ratioof Actual to Expected Cost per Equivalent Weighted Case and is calculatedas the total Acute Inpatient and Newborn expenses divided by total AcuteInpatient and Newborn cases divided by our Peer groups expected the totalAcute Inpatient and Newborn expenses divided by total Acute Inpatientand Newborn cases, Sept - Dec 2010Currentperformance540.145101Performancegoal <strong>2011</strong>/<strong>12</strong>0 MedicationIncidents dueto Med RecProcess6.O − 1.0 10Priority Improvement initiative Methods and results tracking<strong>12</strong>90 11) Continue monitoring and communication of the Monday Morning Directors Huddle andincidents of Medication Reconciliation Error resulting in Departmental weekly safety huddlesMedication Incidents2) Redesign Medication Reconciliation documentationform to align with the various stages of patient stay ieadmission, transfer and discharge3) Trial various models for Medication Reconciliation Medication Reconciliation team to track anddocumentation completion for Medical patients to monitor results of various modelsestablish which is most effective and produces bestoutcomes1) Continue monitoring and communication of incidence 2 time per week Infection Prevention and Controlof clostridium difficile associated diseases (admitted withreporting of inhouse status of infectionsand newly acquired)Weekly staff safety huddles on each unit2) Reinforce Infection control practices for dealing withpatients with clostridium difficile associated diseases(CDI)3) Conduct case investigation process after incidence ofhospital acquired clostridium difficile associated diseasesto determine root case1) Continue to conduct review of patient mortality byservice and communication of findings and areas forimprovement in careAuditing of unit base practices by Clinical Practiceand Infection Prevention and Control RN'sTrack results in Infection Prevention and Controldata setEach service will conducted chart audits andreport findings to Medical Quality AssuranceCommittee quarterly2) Monitoring and support for compliance with physician Monitor compliance Acuity Summary sheets -aimdocumentation expectations.for 80%, Completion of History and Physicalswithin 24hr of admission - aim for 90% -Dictateddischarge summary - aim 90%3) Implement process to support the identification ofpatients with sepsis, and a program for measuring andimproving processes of careSustain and monitor through Monthly Red Green team,Board Reporting, Continued work Hay benchmarkingprocessCurrently under development.HSMR results for Sepsis Diagnoses, quarterly toMQA.Monthly Financial statementsTarget for<strong>2011</strong>/<strong>12</strong>0 MedicationIncidents due toMed Rec Process090− 1.0Target justificationno established benchmark; this is ahigh risk to patient safetyno established benchmark; this is ahigh risk to patient safety2010 Ont provincial average-0.297The CIHI established benchmark is100; our goal has been set at 90 inorder to be high performingorganization and promote patientsafetyH-SAACommentsReduce unnecessary Readmission within 30 days for selected CMGs to any facility: Thehospital readmission number of patients with specified CMGs readmitted to any facility for nonelectiveinpatient care within 30 days of discharge, compared to the numberof expected non-elective readmissions - Q1 2010/11, DAD, CIHI16.9%14.411) Implement and monitor the utilization of the regionalCongestive Health Failure pathway2) Implement IHI ( Institute for Health CareImprovement) readmission chart review process toidentify contributing factorsMonthly pathway report for CHFTo be determined14.4%Benchmark based on DAD dataPercent - Expected Readmissions toAny <strong>Hospital</strong> (Evidence BasedTarget)Reduce unecessarytime spent in acutecareImproveorganizationalfinancial healthPercentage ALC days: Total number of inpatient days designated asALC, divided by the total number of inpatient days. Q2 2010/11, DAD,CIHITotal Margin (consolidated): Percent by which total corporate(consolidated) revenues exceed or fall short of total corporate(consolidated) expense, excluding the impact of facility amortization, in agiven year. Q3 2010/11, OHRS13.2%9% 1$4,800,000 0 11) Implement <strong>Regional</strong> Utilization Management software Daily reports will be implemented and resultsin order to tracking and monitor Alternative Level of monitored by Utilization Management andCare (ALC) dataOperational Managers. Target is 9%2) Maximize the use and referral to internal and external Track and monitor referrals to Resettlement,resources/programs which are aimed at reducing time CCAC, Assess and Restore and Ambulation,spent in acute careRehab, Palliative program3) Liaise with ESC LHIN to identify ALC issues anddevelop and implement initiatives/strategies to addressSustain and monitor through Monthly Red Green team,Board Reporting, Continued work Hay benchmarkingprocessMonthly reports developed and shared, resultingin clear identification of issues and impact ofiniatiives implementedMonthly Financial statements9%0The target is based on the Erie StClair LHIN targetH-SAA
AIM MEASURE CHANGEQuality dimension Objective Outcome Measure/IndicatorCurrentperformancePerformancegoal <strong>2011</strong>/<strong>12</strong>Priority Improvement initiative Methods and results trackingTarget for<strong>2011</strong>/<strong>12</strong>Target justificationCommentsAccessReduce wait timesin the EDED Length of Stay - High Acuity - Admitted: The ED LOS for patientsbeing admitted indicator is the length of time from triage in the ED untilthose patients being admitted leave the ED department for an inpatientplacement. It is the proportion of admitt63.7 791Monitor and track nature and types of delays in placingadmitted patients to an appropriate inpatient bedImplement and monitor policy for patients admitted toright serviceMonitor and track delays in patients unit via EDtransfer report from in house Bed Board reports -dailyMonitor through monthly UM committee report79established by the MoHLTC toreduce ED Wait Times; the WRHP4R target is 79% of admittedpatients with ED LoS ≤ 8hPatient-centredReduce wait timesin the EDReduce wait timesin the EDImprove admittedpatient flowReduce wait timesin the EDImprove patientsatisfactionED Length of Stay - High Acuity Non Admitted: The ED LOS forpatients with high acuity or complex conditions (CTAS1-3) but who arenot admitted indicator is the length of time from triage in the ED untilthose patients leave the ED department.ED Length of Stay -Low Acuity: The ED LOS for patients with lowacuity or les complex conditions (CTAS 4-5) but who are not admittedindicator is the length of time from triage in the ED until those patientsleave the ED department. It is the proportion% Discharged by 1100 : average % Med Surg inpatients discharges thatoccur before 1100 /month% Discharged by 1400 : average % Med Surg inpatients discharges thatoccur before 1100 /monthER Wait times: 90th Percentile ER length of stay for Admitted patients.Q3 2010/11, NACRS, CIHIER Wait times: 90th percentile ER Length of Stay for Complexconditions. Q3 2010/11, NACRS, CIHIPatient Satisfaction Rating : The patient satisfaction indicator is theproportion of patients who reported overall positive satisfaction with thecare and services at <strong>Windsor</strong> <strong>Regional</strong> <strong>Hospital</strong>. The indicator is based theresults of a random survey of ED, Peds, Med Surg and Maternal Newbornpatients. The indicator is defined by the satisfaction survey provider, NRCPicker and ask questions related several dimensions of care such asinvolvement of family, emotional support, physical comfort etc.92.788.526 by 110068 by 1400929332 by 110070 by 1400111Monitor delays and turnaround time of supports service Audit turnaround time monthly for ED patients forIncrease access to DI services for ED patients ( ie 24hrCT)Audit and monitor ED ED Length of stay forimprovement weekly92Implement changes to chart flow process including using Audit and monitor ED Length of stay forpending boardsimprovement weeklyContinue to use ambulatory hallway guidelines tomanage care needs of low acuity patientsDaily audits on patients targets to target reason fordelayNurse Practioner scheduling to match peak times of low Audit and monitor through monthly cases seen peracuity patientsNurse Practioner report93Increase Nurse Practioner coverage hoursMonitor Daily compliance with targets throughDART tool1) Implement <strong>Regional</strong> Utilization Management software Patient Navigation will track results throughin order to improve patient flow daily and the ability to various daily/weekly reports 32predict daily discharges more effectively2) Improve communication with patients and familyabout discharge planning and expectations (fromadmission to actual discharge day)Monitor ongoing communication via white boardcompliance reports and daily bullet rounds3) Review and utilize length of stay improvementplanning teams to target strategies for improvingdischarge planning timesMonitor and track strategies utilized by teams toimprove length of stay and discharge time throughUtilization Management team and committeereportsMonitor and track delays in patients unit via EDtransfer audit data from ICSIS Pro Bed Boardreports - dailyMonitor through monthly UM committee reporttracking of discrepancy reports70established by the MoHLTC andbased on target to reduce ED waittimes; the WRH P4R target is tohave 92% of these patients with EDLoS targetestablished by the MoHLTC andbased on target to reduce ED waittimes; the WRH P4R target is tohave 92% of these patients with EDLoS targetNo standard benchmark wasidentified in the literature; our thetarget has been internally set toeffectively manage patient flowbased on past performance.Monitor and track nature and types of delays in placingadmitted patients to an appropriate inpatient bedBased on LHIN Pay forPerformance targets26.832.2 18hrImplement and monitor compliance with ED serviceadmission protocol.7.5 7.5 1Monitor turnaround time from supports service to EDBased on LHIN Pay for8hrpatient - DI, Lab , RRTPerformance targets91 95 2 95 10% over the Ontario averageImprove patientsatisfactionNRC Picker / HCAPHS: "Would you recommend this hospital to yourfriends and family?" (add together percent of those who responded"Definitely Yes")75.8890 11) Based on Ontario average2)90… N)


