

Section 4: Inverse Functions
Section 4: Inverse Functions
Section 4: Inverse Functions

You also want an ePaper? Increase the reach of your titles
YUMPU automatically turns print PDFs into web optimized ePapers that Google loves.
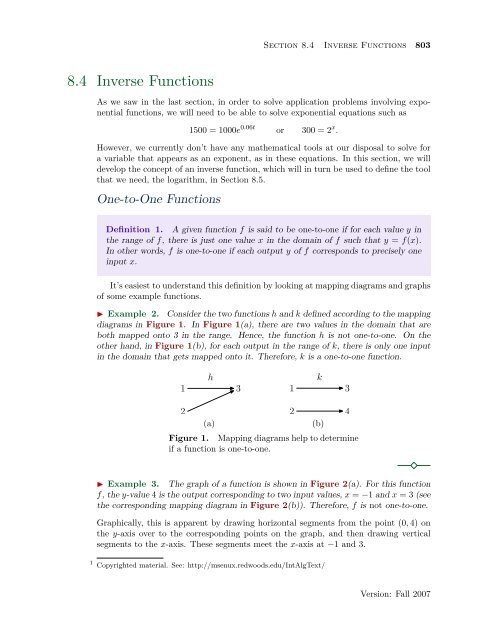
<strong>Section</strong> 8.4 <strong>Inverse</strong> <strong>Functions</strong> 8038.4 <strong>Inverse</strong> <strong>Functions</strong>As we saw in the last section, in order to solve application problems involving exponentialfunctions, we will need to be able to solve exponential equations such as1500 = 1000e 0.06t or 300 = 2 x .However, we currently don’t have any mathematical tools at our disposal to solve fora variable that appears as an exponent, as in these equations. In this section, we willdevelop the concept of an inverse function, which will in turn be used to define the toolthat we need, the logarithm, in <strong>Section</strong> 8.5.One-to-One <strong>Functions</strong>Definition 1. A given function f is said to be one-to-one if for each value y inthe range of f, there is just one value x in the domain of f such that y = f(x).In other words, f is one-to-one if each output y of f corresponds to precisely oneinput x.It’s easiest to understand this definition by looking at mapping diagrams and graphsof some example functions.◮ Example 2. Consider the two functions h and k defined according to the mappingdiagrams in Figure 1. In Figure 1(a), there are two values in the domain that areboth mapped onto 3 in the range. Hence, the function h is not one-to-one. On theother hand, in Figure 1(b), for each output in the range of k, there is only one inputin the domain that gets mapped onto it. Therefore, k is a one-to-one function.1h31k3224(a)(b)Figure 1. Mapping diagrams help to determineif a function is one-to-one.◮ Example 3. The graph of a function is shown in Figure 2(a). For this functionf, the y-value 4 is the output corresponding to two input values, x = −1 and x = 3 (seethe corresponding mapping diagram in Figure 2(b)). Therefore, f is not one-to-one.Graphically, this is apparent by drawing horizontal segments from the point (0, 4) onthe y-axis over to the corresponding points on the graph, and then drawing verticalsegments to the x-axis. These segments meet the x-axis at −1 and 3.1Copyrighted material. See: http://msenux.redwoods.edu/IntAlgText/Version: Fall 2007
804 Chapter 8 Exponential and Logarithmic <strong>Functions</strong>yf−143x−13f4(a)Figure 2.(b)A function which is not one-to-one.◮ Example 4. In Figure 3, each y-value in the range of f corresponds to just oneinput value x. Therefore, this function is one-to-one.Graphically, this can be seen by mentally drawing a horizontal segment from each pointon the y-axis over to the corresponding point on the graph, and then drawing a verticalsegment to the x-axis. Several examples are shown in Figure 3. It’s apparent thatthis procedure will always result in just one corresponding point on the x-axis, becauseeach y-value only corresponds to one point on the graph. In fact, it’s easiest to justnote that since each horizontal line only intersects the graph once, then there can beonly one corresponding input to each output.yfxFigure 3. Aone-to-one functionThe graphical process described in the previous example, known as the horizontalline test, provides a simple visual means of determining whether a function is one-toone.Version: Fall 2007
<strong>Section</strong> 8.4 <strong>Inverse</strong> <strong>Functions</strong> 805Horizontal Line TestIf each horizontal line intersects the graph of f at most once, then f is one-to-one.On the other hand, if some horizontal line intersects the graph of f more thanonce, then f is not one-to-one.Remark 5. It follows from the horizontal line test that if f is a strictly increasingfunction, then f is one-to-one. Likewise, every strictly decreasing function is also oneto-one.<strong>Inverse</strong> <strong>Functions</strong>If f is one-to-one, then we can define an associated function g, called the inversefunction of f. We will give a formal definition below, but the basic idea is that theinverse function g simply sends the outputs of f back to their corresponding inputs.In other words, the mapping diagram for g is obtained by reversing the arrows in themapping diagram for f.◮ Example 6. The function f in Figure 4(a) maps 1 to 5 and 2 to −3. Therefore,the inverse function g in Figure 4(b) maps the outputs of f back to their correspondinginputs: 5 to 1 and −3 to 2. Note that reversing the arrows on the mapping diagramfor f yields the mapping diagram for g.1f55g12−3−32(a)(b)Figure 4. Reversing the arrows on the mappingdiagram for f yields the mapping diagram for g.Since the inverse function g sends the outputs of f back to their correspondinginputs, it follows that the inputs of g are the outputs of f, and vice versa. Thus, thefunctions g and f are related by simply interchanging their inputs and outputs.The original function must be one-to-one in order to have an inverse. For example,consider the function h in Example 2. h is not one-to-one. If we reverse the arrowsin the mapping diagram for h (see Figure 1(a)), then the resulting relation will notbe a function, because 3 would map to both 1 and 2.Before giving the formal definition of an inverse function, it’s helpful to review thedescription of a function given in <strong>Section</strong> 2.1. While functions are often defined bymeans of a formula, remember that in general a function is just a rule that dictateshow to associate a unique output value to each input value.Version: Fall 2007
806 Chapter 8 Exponential and Logarithmic <strong>Functions</strong>Definition 7. Suppose that f is a given one-to-one function. The inverse functiong is defined as follows: for each y in the range of f, define g(y) to be theunique value x such that y = f(x).To understand this definition, it’s helpful to look at a diagram:yyfg(y)xFigure 5.The input for g is any y-value in the range of f. Thus, the input in the above diagramis a value on the y-axis. The output of g is the corresponding value on the x-axis whichsatisfies the condition y = f(x). Note in particular that the x-value is unique becausef is one-to-one.The relationship between the original function f and its inverse function g can bedescribed by: 2Property 8.If g is the inverse function of f, thenx = g(y) ⇐⇒ y = f(x).In fact, this is really the defining relationship for the inverse function. An easy wayto understand this relationship (and the entire concept of an inverse function) is torealize that it states that inputs and outputs are interchanged. The inputs of g are theoutputs of f, and vice versa. It follows that the Domain and Range of f and g areinterchanged:Property 9.If g is the inverse function of f, thenDomain(g) = Range(f) and Range(g) = Domain(f).2 The ⇐⇒ symbol means that these two statements are equivalent: if one is true, then so is the other.Version: Fall 2007
<strong>Section</strong> 8.4 <strong>Inverse</strong> <strong>Functions</strong> 807The defining relationship in Property 8 is also equivalent to the following twoidentities, so these provide an alternative characterization of inverse functions:Property 10.If g is the inverse function of f, theng(f(x)) = x for every x in Domain(f)andf(g(y)) = y for every y in Domain(g).Note that the first statement in Property 10 says that g maps the output f(x) backto the input x. The second statement says the same with the roles of f and g reversed.Therefore, f and g must be inverses.Property 10 can also be interpreted to say that the functions g and f “undo”each other. If we first apply f to an input x, and then apply g, we get x back again.Likewise, if we apply g to an input y, and then apply f, we get y back again. Sowhatever action f performs, g reverses it, and vice versa.◮ Example 11. Suppose f(x) = x 3 . Thus, f is the “cubing” function. Whatoperation will reverse the cubing process? Taking a cube root. Thus, the inverse of fshould be the function g(y) = 3√ y.Let’s verify Property 10:andg(f(x)) = g(x 3 ) = 3√ x 3 = xf(g(y)) = f( 3√ y) = ( 3√ y) 3 = y.◮ Example 12. Suppose f(x) = 4x − 1. f acts on an input x by first multiplyingby 4, and then subtracting 1. The inverse function must reverse the process: first add1, and then divide by 4. Thus, the inverse function should be g(y) = (y + 1)/4.Again, let’s verify Property 10:andg(f(x)) = g(4x − 1) =(4x − 1) + 14= 4x 4 = x( ) ( )y + 1 y + 1f(g(y)) = f = 4 − 1 = (y + 1) − 1 = y.44Version: Fall 2007
808 Chapter 8 Exponential and Logarithmic <strong>Functions</strong>Remarks 13.1. The computation g(f(x)), in which the output of one function is used as the input ofanother, is called the composition of g with f. Thus, inverse functions “undo” eachother in the sense of composition. Composition of functions is an important conceptin many areas of mathematics, so more practice with composition of functions isprovided in the exercises.2. If g is the inverse function of f, then f is also the inverse of g. This follows fromeither Property 8 or Property 10. (Note that the labels x and y for the variablesare unimportant. The key idea is that two functions are inverses if their inputs andoutputs are interchanged.)Notation: In order to indicate that two functions f and g are inverses, we usuallyuse the notation f −1 for g. The symbol f −1 is read “f inverse”. In addition, to avoidconfusion with the typical roles of x and y, it’s often useful to use different labels forthe variables. Rewriting Property 8 with the f −1 notation, and using new labels forthe variables, we have the defining relationship:Property 14.v = f −1 (u) ⇐⇒ u = f(v)Likewise, rewriting Property 10, we have the composition relationships:Property 15.f −1 (f(z)) = z for every z in Domain(f)andf(f −1 (z)) = z for every z in Domain(f −1 )However, the new notation comes with an important warning:Warning 16.f −1 does not mean 1 fThe −1 exponent is just notation in this context. When applied to a function, itstands for the inverse of the function, not the reciprocal of the function.The Graph of an <strong>Inverse</strong> FunctionHow are the graphs of f and f −1 related? Suppose that the point (a, b) is on the graphof f. That means that b = f(a). Since inputs and outputs are interchanged for theinverse function, it follows that a = f −1 (b), so (b, a) is on the graph of f −1 . Now (a, b)Version: Fall 2007
<strong>Section</strong> 8.4 <strong>Inverse</strong> <strong>Functions</strong> 809and (b, a) are just reflections of each other across the line y = x (see the discussionbelow for a detailed explanation), so it follows that the same is true of the graphs of fand f −1 if we graph both functions on the same coordinate system (i.e., as functionsof x).For example, consider the functions from Example 11. The functions f(x) = x 3and f −1 (x) = 3√ x are graphed in Figure 6 along with the line y = x. Several reflectedpairs of points are also shown on the graph.y5fy = xx5f −1Figure 6. Graphs of f(x) = x 3 andf −1 (x) = 3√ x are reflections across theline y = x.To see why the points (a, b) and (b, a) are just reflections of each other across theline y = x, consider the segment S between these two points (see Figure 7). It willbe enough to show: (1) that S is perpendicular to the line y = x, and (2) that theintersection point P of the segment S and the line y = x is equidistant from each of(a, b) and (b, a).yy=x(a,b)PS(b,a)xFigure 7. Switching the abscissa andordinate reflects the point across theline y = x.1. The slope of S isa − bb − a = −1,Version: Fall 2007
810 Chapter 8 Exponential and Logarithmic <strong>Functions</strong>and the slope of the line y = x is 1, so they are perpendicular.2. The line containing S has equation y−b = −(x−a), or equivalently, y = −x+(a+b).To find the intersection of S and the line y = x, set x = −x + (a + b) and solve forx to getx = a + b2 .Since y = x, it follows that the intersection point is( a + bP =2 , a + b ).2Finally, we can use the distance formula presented in section 9.6 to compute thedistance from P to (a, b) and the distance from P to (b, a). In both cases, thecomputed distance turns out to be|a − b|√2.Computing the Formula of an <strong>Inverse</strong> FunctionHow does one find the formula of an inverse function? In Example 11, it was easy tosee that the inverse of the “cubing” function must be the cube root function. But howwas the formula for the inverse in Example 12 obtained?Actually, there is a simple procedure for finding the formula for the inverse function(provided that such a formula exists; remember that not all functions can be describedby a simple formula, so the procedure will not work for such functions). The followingprocedure works because the inputs and outputs (the x and y variables) are switchedin step 3.Computing the Formula of an <strong>Inverse</strong> Function1. Check the graph of the original function f(x) to see if it passes the horizontalline test. If so, then f is one-to-one and you can proceed.2. Write the formula in xy-equation form, as y = f(x).3. Interchange the x and y variables.4. Solve the new equation for y, if possible. The result will be the formula forf −1 (x).Version: Fall 2007
<strong>Section</strong> 8.4 <strong>Inverse</strong> <strong>Functions</strong> 811◮ Example 17.Example 12.Let’s start by finding the inverse of the function f(x) = 4x−1 fromStep 1: A check of the graph shows that f is one-to-one (see Figure 8).Figure 8. The graph of f(x) = 4x−1passes the horizontal line test.Step 2: Write the formula in xy-equation form: y = 4x − 1Step 3: Interchange x and y: x = 4y − 1Step 4: Solve for y:Thus, f −1 (x) = x + 1 .4x = 4y − 1=⇒ x + 1 = 4y=⇒ x + 14Figure 9 demonstrates that the graph of f −1 (x) = (x + 1)/4 is a reflection of thegraph of f(x) = 4x − 1 across the line y = x. In this figure, the ZSquare command inthe ZOOM menu has been used to better illustrate the reflection (the ZSquare commandequalizes the scales on both axes).= y(a)Figure 9.(b)Symmetry across the line y = xVersion: Fall 2007
812 Chapter 8 Exponential and Logarithmic <strong>Functions</strong>◮ Example 18. This time we’ll find the inverse of f(x) = 2x 5 + 3.Step 1:verify).A check of the graph shows that f is one-to-one (this is left for the reader toStep 2: Write the formula in xy-equation form: y = 2x 5 + 3Step 3: Interchange x and y: x = 2y 5 + 3Step 4: Solve for y:√x − 3Thus, f −1 (x) = 5 .2x = 2y 5 + 3=⇒ x − 3 = 2y 5=⇒ x − 32=⇒ 5 √x − 32= y 5Again, note that the graph of f −1 (x) = 5√ (x − 3)/2 is a reflection of the graph off(x) = 2x 5 + 3 across the line y = x (see Figure 10).= y(a)Figure 10.(b)Symmetry across the line y = x◮ Example 19.Find the inverse of f(x) = 5/(7 + x).Step 1:verify).A check of the graph shows that f is one-to-one (this is left for the reader toStep 2: Write the formula in xy-equation form: y = 57 + xStep 3: Interchange x and y: x = 57 + yVersion: Fall 2007
<strong>Section</strong> 8.4 <strong>Inverse</strong> <strong>Functions</strong> 813Step 4: Solve for y:x = 57 + y=⇒ x(7 + y) = 5Thus, f −1 (x) = 5 − 7x .x=⇒ 7 + y = 5 x=⇒ y = 5 x − 7 = 5 − 7xx◮ Example 20. This example is a bit more complicated: find the inverse of thefunction f(x) = (5x + 2)/(x − 3).Step 1:verify).A check of the graph shows that f is one-to-one (this is left for the reader toStep 2: Write the formula in xy-equation form: y = 5x + 2x − 3Step 3: Interchange x and y: x = 5y + 2y − 3Step 4: Solve for y:x = 5y + 2y − 3=⇒ x(y − 3) = 5y + 2=⇒ xy − 3x = 5y + 2This equation is linear in y. Isolate the terms containing the variable y on one side ofthe equation, factor, then divide by the coefficient of y.Thus, f −1 (x) = 3x + 2x − 5 .xy − 3x = 5y + 2=⇒ xy − 5y = 3x + 2=⇒ y(x − 5) = 3x + 2=⇒ y = 3x + 2x − 5◮ Example 21. According to the horizontal line test, the function h(x) = x 2 iscertainly not one-to-one. However, if we only consider the right half or left half ofthe function (i.e., restrict the domain to either the interval [0, ∞) or (−∞, 0]), thenVersion: Fall 2007
814 Chapter 8 Exponential and Logarithmic <strong>Functions</strong>the function would be one-to-one, and therefore would have an inverse (Figure 11(a)shows the left half). For example, suppose f is the functionf(x) = x 2 , x ≤ 0.In this case, the procedure still works, provided that we carry along the domain conditionin all of the steps, as follows:Step 1:Step 2:The graph in Figure 11(a) passes the horizontal line test, so f is one-to-one.Write the formula in xy-equation form:y = x 2 , x ≤ 0Step 3: Interchange x and y:x = y 2 , y ≤ 0Note how x and y must also be interchanged in the domain condition.Step 4: Solve for y:y = ± √ x, y ≤ 0Now there are two choices for y, one positive and one negative, but the condition y ≤ 0tells us that the negative choice is the correct one. Thus, the last statement is equivalenttoy = − √ x.Thus, f −1 (x) = − √ x. The graph of f −1 is shown in Figure 11(b), and the graphs ofboth f and f −1 are shown in Figure 11(c) as reflections across the line y = x.fy5y5fy5y = xx5x5f −1x5f −1(a) (b) (c)Figure 11.Version: Fall 2007


