A multi-scale framework for mapping and analysis ... - ResearchGate
A multi-scale framework for mapping and analysis ... - ResearchGate
A multi-scale framework for mapping and analysis ... - ResearchGate

You also want an ePaper? Increase the reach of your titles
YUMPU automatically turns print PDFs into web optimized ePapers that Google loves.
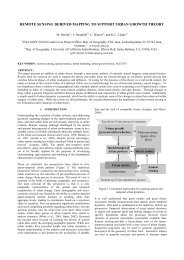
Proceedings of 22 nd EARSEL Symposium “Geoin<strong>for</strong>mation <strong>for</strong> European-wide integration, Prague, June 2002A <strong>multi</strong>-<strong>scale</strong> <strong>framework</strong> <strong>for</strong> <strong>mapping</strong> <strong>and</strong> <strong>analysis</strong> of the spatial <strong>and</strong>temporal pattern of urban growthMartin Herold <strong>and</strong> Keith C. ClarkeDepartment of Geography, University of Cali<strong>for</strong>nia, Santa Barbara,Santa Barbara, CA 93106, USA, Tel. 001-805-8934196, martin@geog.ucsb.eduGunter MenzRemote Sensing Research Group, Department of Geography, University of Bonn,Meckenheimer Allee 166, 53115 Bonn, Germany 049-228-739700, menz@rsrg.uni-bonn.deKeywords: Scale, Remote Sensing, Urban growth, L<strong>and</strong> use change, Urban modelingABSTRACT: In the past, remote sensing has shown an ability to detect <strong>and</strong> describe urban growth patterns at different spatial<strong>scale</strong>s. With new remote sensing devices (e.g. IKONOS, MODIS), with innovative image processing techniques <strong>and</strong> with furtherdevelopment of decision support tools (e.g. GIS <strong>and</strong> urban l<strong>and</strong> use change models), remote sensing has new opportunities toprovide useful in<strong>for</strong>mation in support of sustainable development <strong>and</strong> "smart growth" <strong>for</strong> urban areas. Given that urban dynamicsimpact many spatial <strong>scale</strong>s, we present a <strong>framework</strong> <strong>for</strong> the <strong>mapping</strong> <strong>and</strong> <strong>analysis</strong> of predictable patterns of urban at differentspatial <strong>scale</strong>s in order to analyze the urbanization process. We discuss problems of urban area <strong>mapping</strong> at the superregional/global<strong>scale</strong>, <strong>and</strong> more directly address issues of spatial <strong>and</strong> spectral sensor requirements <strong>for</strong> urban <strong>mapping</strong> on the local<strong>and</strong> regional <strong>scale</strong>. We conduct urban growth <strong>analysis</strong> using spatial measurements of changes in the urban environment on theregional <strong>scale</strong>, <strong>and</strong> urban l<strong>and</strong> cover structure on the local <strong>scale</strong>, in the Santa Barbara, CA area. Results show how the new era ofremote sensing data <strong>and</strong> superior methods allow <strong>for</strong> a better <strong>mapping</strong>, underst<strong>and</strong>ing, modeling, <strong>and</strong> prediction of the spatial <strong>and</strong>temporal dynamics of urban growth at each of the different <strong>scale</strong>s.1 INTRODUCTIONThe dynamic processes at work in urban areas(expansion in area, increase in population, changesin economic <strong>and</strong> social structures) affect both natural<strong>and</strong> human systems, <strong>and</strong> operate across geographic<strong>scale</strong>s. There is an emerging desire to manage thedynamics or urban systems, reflected in sustainabledevelopment <strong>and</strong> smart growth initiatives <strong>and</strong>policies (Kaiser et al. 1995). However, urbanplanning <strong>and</strong> management rarely consider the <strong>scale</strong>dependentnature of urban processes, a nature onlymarginally reflected in the usual hierarchicalorganization of city <strong>and</strong> regional planninginstitutions. Figure 1 shows a conceptual representationof the spatial evolution of a city in the UnitedStates. The patterns are the result of socioeconomic,natural, technological <strong>and</strong> social factors that bothdrive <strong>and</strong> are profoundly affected by the evolvingspatial structure of cities in the l<strong>and</strong>scape. Urbanarea expansion starts with a historical core thatgrows <strong>and</strong> disperses to new individual developmentcenters or cores usually located near a maintransportation axis (commonly, surfaced roads) <strong>and</strong>directly dependent upon the urban core. Given thisgeneral locational pattern, those areas follow atrajectory of organic growth or outward expansion,<strong>and</strong> finally coalesce <strong>and</strong> urbanize the open space ininterstices between the central urban core <strong>and</strong>satellite centers. A last "saturated" spatialconfiguration of urban development <strong>for</strong>ms the core<strong>for</strong> further urbanization at a less detailed spatial<strong>scale</strong> following the same stages of spatial evolutionas shown in Figure 1. This "pulsating" conceptualrepresentation emphasizes the <strong>scale</strong> variations givenone example of urban expansion, since obviouslydifferent cities in a region are at different stages inthe cycle at any given time. Urbanization can also beseen as a complex interaction between distinctprocesses that relate to specific <strong>scale</strong>s themselves:e.g. the evolution of city transportation <strong>and</strong>communications networks; competition betweencommercial centers; industrial agglomeration;differential regional urban growth <strong>and</strong> l<strong>and</strong> usechange; <strong>and</strong> the housing market (Alberti & Waddell2000, Weber 2001). The study of these processesinvolves the investigation of specific spatial <strong>and</strong>temporal growth patterns. The resulting in<strong>for</strong>mationgained can improve the representation <strong>and</strong> modelingof the dynamics only if we also consider <strong>and</strong> clearlydefine the <strong>scale</strong> of urban change specific processes.
Figure 1: Hypothetical sequence of the spatial evolution of an urban area.Table 1: A <strong>multi</strong>-<strong>scale</strong> <strong>framework</strong> <strong>for</strong> the <strong>mapping</strong> <strong>and</strong> <strong>analysis</strong> of urban l<strong>and</strong> use change with remote sensing.Figure 2: Urban extent of the Santa Barbara/Goleta urban region represented in different datasets compared to the map made byvisual air photo interpretation used in this study.Remote sensing methods have been widelyapplied in the <strong>mapping</strong> of l<strong>and</strong> surface features inurban areas (e.g. Haack et al. 1997, Jensen <strong>and</strong>Cowen 1999), emphasizing the fact that remotesensing represents a key source of data, that isspatially consistent <strong>and</strong> covers large areas with bothhigh geometric detail <strong>and</strong> high temporal frequency.Where revisit is possible, <strong>and</strong> satellite programs areeither long-lived or durable, the historical time seriescritical <strong>for</strong> detecting <strong>and</strong> <strong>mapping</strong> urban change arepossible. Recent developments in civilian remotesensing have radically improved the <strong>mapping</strong> ofurban areas from remote sensing, <strong>and</strong> include theIKONOS satellite (Tanaka <strong>and</strong> Sugimura 2001),hyper-spectral sensors (Ben Dor et al. 2001, Heroldet al. 2002b) <strong>and</strong> MODIS (Schneider et al. 2001),<strong>and</strong> now can provide a more detailed <strong>and</strong> accurate
urban area <strong>mapping</strong> at different spatio-temporal<strong>scale</strong>s. Improvements in data availability <strong>and</strong> data<strong>analysis</strong> methods offer the chance to provideaccurate maps at nearly all the spatial <strong>scale</strong>s relevantto urban dynamics. Accordingly this paper developsthese ideas towards a <strong>multi</strong>-<strong>scale</strong> view of remotesensing data <strong>analysis</strong> <strong>for</strong> urban growth <strong>and</strong> l<strong>and</strong> usechange. The general concept underlying our ideas,<strong>and</strong> illustrated in Table 1, is a <strong>multi</strong>-<strong>scale</strong> <strong>framework</strong><strong>for</strong> the <strong>mapping</strong> <strong>and</strong> <strong>analysis</strong> urban l<strong>and</strong> usedynamics with remote sensing. We highlight fourlevels of geographical <strong>scale</strong>. Each <strong>scale</strong> is associatedwith specific urban dynamics, determines theirspatial characteristics, is influenced by differentdrivers <strong>and</strong> factors of growth, <strong>and</strong> shows <strong>scale</strong>specificeffects <strong>and</strong> patterns as result of the processseparation. Based on the <strong>framework</strong>, we discuss<strong>scale</strong> issues related to both remote sensing data<strong>analysis</strong> <strong>and</strong> the investigation <strong>and</strong> modeling of urbanchange dynamics.2 SCALE IN REMOTE SENSING2.1 Spatial <strong>scale</strong>Scale--the spatial <strong>and</strong> temporal dimension of anobject or process--is crucial to geographic <strong>analysis</strong>(Meentemayer 1989, Lam <strong>and</strong> Quattrochi 1992).Four meanings of <strong>scale</strong> are often used: cartographic<strong>scale</strong>, geographic <strong>scale</strong>, operational <strong>scale</strong> <strong>and</strong>measurement <strong>scale</strong>. For remote sensing based urbanarea <strong>mapping</strong>, the spatial extent of the study areadefines the geographic <strong>scale</strong>. Measurement <strong>scale</strong> isdetermined by image pixel size or, more typically,the image spatial (or geometric) resolution or"Instantaneous Field of View" (IFOV, Jensen 1996).In general, the level of geometric detail in l<strong>and</strong> coverrepresentation by remotely sensed data is determinedby the spatial heterogeneity of the target l<strong>and</strong> coverstructures <strong>and</strong> the sensor spatial resolution. Differentstudies have emphasized the investigation ofresolution-dependent variables <strong>and</strong> critical spatialresolutions <strong>for</strong> the detection <strong>and</strong> <strong>analysis</strong> of realworld phenomena at different <strong>scale</strong>s (Woodcock <strong>and</strong>Strahler 1987).Remotely sensed data have been applied to the<strong>analysis</strong> of urban l<strong>and</strong> cover <strong>and</strong> l<strong>and</strong> use at severalspatial <strong>scale</strong>s. Given the regional to global <strong>scale</strong>(Table 1) the main measurement objective has beenthe spatial extent of the urban area. Every relatedstudy requires a clear definition of what isconsidered an urban area versus a rural area. Ingeneral, the demarcation between urban <strong>and</strong> ruralareas on the edges of cities may not be distinct. TheUS Bureau of the Census quantitatively definesurban areas based on population, l<strong>and</strong> area <strong>and</strong>population density, <strong>and</strong> by spatial arrangement. Asecond common approach in delineating urban areasfrom their rural surroundings is by using imageprocessingtechniques based on spectral response.Similar to the urban definitions from administrativedata, discrimination of the urban extent fromimagery is problematic <strong>and</strong> requires consideration ofcross methodological issues. Weber (2001) stated:"it is necessary to develop a precise <strong>and</strong> cleardefinition of urban l<strong>and</strong> use <strong>and</strong> l<strong>and</strong> covercategories so as to be able to define the limit ofurban areas" <strong>and</strong> "the morphology of urban areasmight to be the most objective <strong>and</strong> easily obtainedcriterion <strong>for</strong> defining contiguous built up areas." Forthe accurate use of remote sensing data in urbanextent delineation Barnsley et al. (1995) <strong>and</strong> Weber(2001) proposed a combination of remote sensingclassification with population data <strong>and</strong> spatialdistance <strong>analysis</strong>.The problem of defining <strong>and</strong> discriminating urban<strong>and</strong> rural l<strong>and</strong> in remote sensing based <strong>analysis</strong> ishighlighted in Figure 2, which presents the variousdelineations of Santa Barbara's urban extent usingdifferent remote sensing sources compared to theurban extent derived from visual air photointerpretation (considered the "true" urban extent).The exaggeration of urban areas in nighttimeacquired DMSP is obvious due to atmosphericinfluences, the coarse spatial resolution (2.7 kmpixel size) <strong>and</strong> uncertainties in georectification. TheIGBP-DISCover data set was the first completeglobal l<strong>and</strong> cover data set developed from remotesensing data <strong>and</strong> is at a one-kilometer spatialresolution. Urban areas are represented in DISCoverin the "Urban <strong>and</strong> Built Up" category. However,they were not mapped from NOAA/AVHRR data, aswas the rest of the dataset. This reflects the difficultyof <strong>mapping</strong> urban areas at a coarse global <strong>scale</strong>.Even at the relatively high 1 km DISCoverresolution urban areas are characterized by smallextents <strong>and</strong> fragmented shapes <strong>and</strong> with an indistinctspectral pattern compared to other l<strong>and</strong> coverclasses. The urban areas in the IGBP dataset show asignificant under-representation as they wereobtained from the Defense Mapping Agency'sOperational Navigation Charts generated in the1950's <strong>and</strong> 1970's. Considering the problems withthe <strong>mapping</strong> of urban areas at the super-regional <strong>and</strong>global <strong>scale</strong>, precise classification remainscomplicated. However, with new sensor systems likeMODIS the super-regional <strong>scale</strong> <strong>mapping</strong> of urbanareas should be significantly improved in the nearfuture (Schneider et al. 2001).The urban areas in the National L<strong>and</strong> CoverDatabase (NLCD) were derived from L<strong>and</strong>sat TMdata <strong>and</strong> include the areas that are built up at a 30 m
pixel resolution. The NLCD dataset is a typicalremote sensing data product based on pixel-by-pixeldigital classification, <strong>and</strong> represents the physicallybuild up structures rather the actual extent of theurban l<strong>and</strong> use area. Most regional <strong>scale</strong> analysesfocused on a specific urban area have applied datafrom the L<strong>and</strong>sat TM <strong>and</strong> SPOT sensors. The <strong>multi</strong>spectralspatial sensor resolution ranges from 20-30meters. These resolutions are still too coarse <strong>for</strong> aclear geometric identification of urban l<strong>and</strong> coverobjects (Welch 1982, Woodcock <strong>and</strong> Strahler 1987,Jensen <strong>and</strong> Cowen 1999). Accordingly, differentapproaches were used to improve the <strong>mapping</strong>accuracy or acquire additional thematic in<strong>for</strong>mationusing data from these sensors:• Spatial, textural, contextual or filter processing ofthe image data <strong>for</strong> more detailed <strong>mapping</strong> (Gong<strong>and</strong> Howarth 1992, Foster 1993),• Inclusion of ancillary in<strong>for</strong>mation in the imageclassification process (Mesev 1998, Sadler et al.1991),• Utilization of spectral mixture <strong>analysis</strong> <strong>for</strong> moredetailed characterization of urban/near urbanenvironment (Ridd 1995),• Improving spatial resolution using sensor fusionalgorithms (Ranchin et al. 2001),• Visual interpretations of urban l<strong>and</strong> use structuresin satellite images (Ehlers et al. 1990).In contrast to the regional <strong>and</strong> global <strong>scale</strong>s, theprimary remote sensing <strong>mapping</strong> objectives on thelocal <strong>scale</strong> are specific l<strong>and</strong> cover objects or mapfeatures such as building structures, roads orindividual vegetation patches (Table 1). Theaccurate <strong>mapping</strong> of these targets requires higherspatial sensor resolutions. Figure 3 highlights thisissue by representing the resolution-dependentrepresentation of high residential built up areas. Theblue (dark) graph represents the change in localvariance (3x3 neighborhood) as it was derived fromWoodcock <strong>and</strong> Strahler (1987). The peak at 10-15 mspatial resolution shows the areas where thepixelsize is about the spatial dimensions of l<strong>and</strong>cover objects in a high-density residential area. Thegraph in red (light) shows the change in fractaldimension, hence the level of generalization in howbuilt up areas are represented in l<strong>and</strong> coverclassification results derived from air photos (3 mresolution, degraded in increments to 15 m),Daedalus scanner data (15 m) <strong>and</strong> L<strong>and</strong>sat TM data(30 m). The general decrease shows the increasinglygeneralized representation of the built up structuresas the spatial resolution declines <strong>and</strong> the shape of theobjects are more determined by the quadrangular<strong>for</strong>m of the grid cells <strong>and</strong> not by real worldcharacteristics. Accordingly, different studies havesuggested a spatial sensor resolution of higher than 5m <strong>for</strong> an accurate spatial representation of urbanl<strong>and</strong> cover objects such as building structures orurban vegetation patches based on qualitativeconsiderations <strong>and</strong> experience (Welch 1982,Woodcock & Strahler 1987, Jenson <strong>and</strong> Cowen1999). However, open systematic quantitativeinvestigations of spatial sensor resolutionrequirements <strong>for</strong> urban area <strong>mapping</strong> are stillinsufficient to date.Figure 3: Representation of built up structures in high-densityresidential areas dependent on spatial resolution shown <strong>for</strong><strong>analysis</strong> using local variance (blue, dark) <strong>and</strong> <strong>for</strong> fractaldimension (red, light).2.2 Spectral ScaleThe spectral capabilities or spectral resolution ofa remote sensing device are usually characterized bythe number of spectral b<strong>and</strong>s <strong>and</strong> the wavelengths<strong>and</strong> b<strong>and</strong>width covered by these b<strong>and</strong>s (Jensen1996). In terms of urban area remote sensing, thespectral response is fairly complex <strong>and</strong> indistinct dueto the heterogeneity of the urban environment,typically consisting of built up structures (e.g.buildings, transportation nets), <strong>multi</strong>ple differentvegetation covers (e.g. parks, gardens, agriculturalareas), bare soil zones <strong>and</strong> water bodies (Barnsley etal., 1993, Ridd 1995). Consequently, there is noexplicit "spectral urban signal" (Figures 4 <strong>and</strong> 5).Figure 4: Mean spectral signatures derived from AVIRIS offive major l<strong>and</strong> cover classes in the Santa Barbara, CA areashown with spectral coverage of IKONOS <strong>and</strong> LANDSAT.
Common <strong>multi</strong>-spectral data allow <strong>for</strong> aneffective pixel-based separation of vegetation, water<strong>and</strong> built-up l<strong>and</strong> cover categories on a purelyspectral basis. The separation of built-up <strong>and</strong> baresoil/rock areas as well as areas of nonphotosyntheticvegetation are often problematicusing these data due to their similar spectralresponse from the most common satellite sensorsystems (Figure 4, Sadler et al., 1991). The furtherseparation of urban l<strong>and</strong> cover types, such asdifferent impervious surfaces (roads, roof types) ordifferent vegetation types require data with higherspectral resolution (spectral upscaling). In thiscontext, hyper-spectral remote sensing does allow<strong>for</strong> more detailed urban l<strong>and</strong> cover <strong>mapping</strong> (BenDor et al. 2001, Herold et al. 2002b).intervals. The AVIRIS sensor is represented by themost suitable 10 channels <strong>for</strong> separating these urbanl<strong>and</strong> cover types. The lowest Bhattacharyya distance<strong>for</strong> all urban targets with some significant low peaksis found with the IKONOS data. The lowseparability peaks disappear <strong>for</strong> LANDSAT TM,<strong>and</strong> the highest Bhattacharyya distance, or largestseparability, values are found <strong>for</strong> AVIRIS data. Thisis a clear indication of the limitations of theIKONOS sensor in separating urban l<strong>and</strong> covercategories due to its limited spectral in<strong>for</strong>mation.Figure 6: Minimum class separability (Bhattacharyya distance)of urban l<strong>and</strong> cover classes <strong>for</strong> three sensors (rf=roof, rd=road).Figure 5: Spectral signatures of different urban l<strong>and</strong> covertypes from AVIRIS data acquired in the Santa Barbara, CAregion (Note: The major water vapor absorption b<strong>and</strong>s areinterpolated).Spectral scaling in <strong>mapping</strong> urban areas has toconsider the spectral properties of urban materials(see Figure 5), the capabilities of recent sensorsystems <strong>and</strong> the most suitable wavelengths <strong>for</strong>effective spectral separation of urban areas ingeneral. On one h<strong>and</strong>, the comprehensive spectralin<strong>for</strong>mation provide by hyperspectral sensors isconsidered "too much", due to the high correlationbetween the b<strong>and</strong>s <strong>and</strong> the fact that a selectednumber of b<strong>and</strong>s can provide most of thein<strong>for</strong>mation required to map urban areas (Herold etal. 2002b). On the other h<strong>and</strong>, recent space-bornesystems, like IKONOS, QUICKBIRD <strong>and</strong>LANDSAT ETM, are limited in their spectralresolution. This fact is shown in spectral coverage ofIKONOS <strong>and</strong> LANDSAT compared to urban spectra(Figure 4 <strong>and</strong> 5) <strong>and</strong> in the diagram presented inFigure 6. The graph in Figure 6 highlights thespectral separability of different urban l<strong>and</strong> covertypes <strong>for</strong> three different sensor configurations. TheIKONOS <strong>and</strong> LANDSAT TM data were simulatedfrom AVIRIS using the spectral response functionsavailable from the satellite data provider in 10 nmThese results show that there are specific <strong>scale</strong>relatedissues related to the spectral dimension in<strong>mapping</strong> of urban l<strong>and</strong> cover, especially thelimitations of current satellite sensor systems.Further <strong>analysis</strong> should consider <strong>and</strong> address thesequestions to provide a more detailed evaluation ofspectral properties of urban materials <strong>and</strong> theirspectral separability, including the investigation ofthe most suitable wavelengths to clearly assess <strong>and</strong>refine spectral scaling issues in remote sensing <strong>for</strong>urban zones.3 SCALE IN ANALYSIS AND MODELINGIn the previous section we discussed <strong>scale</strong>-relatedissues in <strong>mapping</strong> of urban areas from remotesensing. Considering the general <strong>framework</strong> shownin Table 1, the following section discusses <strong>and</strong>investigates the <strong>scale</strong>-dependent <strong>analysis</strong> <strong>and</strong>modeling of urban dynamics.3.1 Urban modelingDifferent l<strong>and</strong> use change models have recentlybeen described <strong>and</strong> compared in two reports.(Agarwal et al. 2000, EPA 2000). Consideringmodels with a focus on simulating the spatialpatterns of urban growth <strong>and</strong> l<strong>and</strong> use change, the
measuring spatial structures <strong>and</strong> analyzing theirtemporal changes as the result of specific processes(from structure to process). This perspectiveincorporates "real world" remote sensing-basedmeasurements of urban dynamics rather thangeneralized consideration as is commonly used intheories <strong>and</strong> models of urban spatial structure <strong>and</strong>change.4 CONCLUSIONThe study of urban growth <strong>and</strong> l<strong>and</strong> use changedynamics based on remote sensing requires theconsideration of spatial <strong>scale</strong>. Given recentdevelopments in remote sensing technology, wepresented <strong>and</strong> discussed a general <strong>framework</strong> thatstructures the use of remote sensing to observe <strong>and</strong>analyze specific urban change dynamics from localto global <strong>scale</strong>s. The <strong>multi</strong>-<strong>scale</strong> perspective <strong>and</strong> thel<strong>and</strong> cover heterogeneity of urban environmentsrequire that suitable attention by given to selectionof the most suitable spatial <strong>and</strong> spectral sensorsettings <strong>for</strong> <strong>mapping</strong> urban areas. We alsoemphasize this <strong>multi</strong>-<strong>scale</strong> character in the <strong>analysis</strong><strong>and</strong> modeling of spatial <strong>and</strong> temporal urban growthpatterns. Use of the approach can significantlybenefit from the utilization of remote sensing dataproducts. We have presented examples from remotesensing based urban growth analyses using thespatial metrics of change on the regional <strong>and</strong> thelocal <strong>scale</strong> in the Santa Barbara, CA area. Theresults show how the new era of remote sensing data<strong>and</strong> methods allow <strong>for</strong> a better <strong>mapping</strong>,underst<strong>and</strong>ing <strong>and</strong> modeling of the spatial <strong>and</strong>temporal dynamics of urban growth at different<strong>scale</strong>s.5 REFERENCESAgarwal, C. Green, G.L. Grove, M. Evans, T. <strong>and</strong> Schweik, C.2000. A Review <strong>and</strong> Assessment of L<strong>and</strong>-Use ChangeModels: Dynamics of Space, Time, <strong>and</strong> Human Choice,published by the US Forest Service <strong>and</strong> the Center <strong>for</strong> theStudy of Institutions, Population, <strong>and</strong> EnvironmentalChange (CIPEC), Indiana University.Alberti M. <strong>and</strong> Waddell P. 2000. An Integrated UrbanDevelopment <strong>and</strong> Ecological Simulation Model, IntegratedAssessment, 1, pp. 215-227.Barnsley, M.J., Barr, S.L., <strong>and</strong> Sadler, G.J., 1995. Mapping theurban morphological zone using satellite remote sensing<strong>and</strong> GIS, Proc. Annual Conference of the Remote SensingSociety, University of Southampton, September 1995,Remote Sensing Society, 209-216.Barnsley, M.J., S.L. Barr, A. Hamid, P.A.L. Muller, G.J.Sadler, <strong>and</strong> J.W. Shepherd, 1993. Analytical Tools toMonitor Urban Areas. Mather, P.M. (ed). GeographicalIn<strong>for</strong>mation H<strong>and</strong>ling-Research <strong>and</strong> Applications. pp. 147-184.Barr, S. <strong>and</strong> Barnsley, M. 1997. A region-based, graph-orienteddata model <strong>for</strong> the inference of second order in<strong>for</strong>mationfrom remotely-sensed images, International Journal ofGeographical In<strong>for</strong>mation Science, 11, 6, pp. 555-576.Ben-Dor, E., Levin, N. <strong>and</strong> Saaroni H. 2001. A spectral basedrecognition of the urban environment using the visible <strong>and</strong>near-infrared spectral region (0.4-1.1 m). A case study overTel-Aviv, International Journal of Remote Sensing, 22,11,pp. 2193-2218.Ehlers, M., Jadkowski, M. A., Howars, R. R. <strong>and</strong> Brostuen, D.E. 1990. Application of SPOT Data <strong>for</strong> Regional GrowthAnalysis <strong>and</strong> Local Planning. PhotogrammetricEngineering <strong>and</strong> Remote Sensing, 56, 2, pp. 175-180.EPA - Environmental Protection Agency, 2000. Projecting l<strong>and</strong>use change: A summary of models <strong>for</strong> assessing the effectsof community growth <strong>and</strong> change on l<strong>and</strong> use pattern,http://www.epa.gov/cbep/tools/reportfinal3.pdf, access:April 2001.Foster, B.C. 1993. Coefficient of variation as a measure ofurban spatial attributes using Spot HRV <strong>and</strong> L<strong>and</strong>sat TM.International Journal of Remote Sensing, 14, pp. 2403-2409.Gong, P. <strong>and</strong> P.J. Howarth, 1992. Frequency-based contextualclassification <strong>and</strong> gray-level vector reduction <strong>for</strong> l<strong>and</strong> useidentification, Photogrammetric Engineering <strong>and</strong> RemoteSensing, 58, pp. 423-437.Haack, B. N., Guptill, S. C., Holz, R. K., Jampoler, S. M.,Jensen, J. R. <strong>and</strong> Welch, R. A. 1997. Urban <strong>analysis</strong> <strong>and</strong>planning, in Philipson et al. eds. Manual of photographicinterpretation, 2. Ed, pp. 517-554.Herold, M., Clarke, K. C., <strong>and</strong> Scepan, J. 2002a. RemoteSensing <strong>and</strong> L<strong>and</strong>scape Metrics to describe Structures <strong>and</strong>Changes in Urban L<strong>and</strong>use, Environment <strong>and</strong> Planning A,(in press).Herold, M., Gardner, M., Hadley, B. <strong>and</strong> Roberts, D. 2002b.The spectral dimension in urban l<strong>and</strong> cover <strong>mapping</strong> fromhigh-resolution optical remote sensing data, Proceedings ofthe 3rd Symposium on Remote Sensing of Urban Areas,June 2002, Istanbul, Turkey, on CD Rom.Jensen, J. R. <strong>and</strong> Cowen, D. C. 1999. Remote sensing ofurban/suburban infrastructure <strong>and</strong> socio-economicattributes, Photogrammetric Engineering <strong>and</strong> RemoteSensing, 65, 5, pp. 611-622.Jensen, J. R. 1996. Introductory digital image processing: aremote sensing perspective, Prentice Hall Series inGeographic In<strong>for</strong>mation Science, 316 p.Kaiser, E., Godschalk, D., <strong>and</strong> Chapin, S. F. Jr., 1995. UrbanL<strong>and</strong> Use Planning. Urbana, IL: University of Illinois.Lam, N. <strong>and</strong> D.A. Quattrochi, 1992. On the issues of <strong>scale</strong>,resolution <strong>and</strong> fractal <strong>analysis</strong> in the <strong>mapping</strong> sciences.Professional Geographer, 44, 1, pp. 88-98.McGarigal, K., S. A. Cushman, M. C. Neel, <strong>and</strong> Ene., E. 2002.FRAGSTATS: Spatial Pattern Analysis Program <strong>for</strong>Categorical Maps. URL: www.umass.edu/l<strong>and</strong>eco/research/fragstats/fragstats.html.Meentemayer, V. 1989. Geographical perspectives of space,time <strong>and</strong> <strong>scale</strong>, L<strong>and</strong>scape ecology, 3, pp. 163 - 173.Mesev, V. 1998. The use of Census data in urban imageclassification. Photogrammetric Engin. <strong>and</strong> RemoteSensing, 64, 5, pp. 431-438.Ranchin, T., Wald, L. <strong>and</strong> Mangolini, M. 2001. Improvingspatial resolution of remotely-sensed images by means ofsensor fusion: a general solution using ARSIS methods,Donnay, J. P., Barnsley, M. J. <strong>and</strong> Longley, P. A. (eds.).Remote sensing <strong>and</strong> urban <strong>analysis</strong>, Taylor <strong>and</strong> Francis,London <strong>and</strong> New York, pp. 21-37.Ridd, M. K. 1995, Exploring a VIS (vegetation-impervioussurface-soil)model <strong>for</strong> urban ecosystem <strong>analysis</strong> through
emote sensing: comparative anatomy <strong>for</strong> cities,International Journal of Remote Sensing, 16, 12, pp. 2165-2185.Sadler, G.J., M.J. Barnsley, <strong>and</strong> S.L. Barr, 1991. In<strong>for</strong>mationextraction from remotely sensed images <strong>for</strong> urban l<strong>and</strong><strong>analysis</strong>. Proceeding of the 2nd European Conference onGeographical In<strong>for</strong>mation Systems EGIS'91, Brussels,Belgium, April, EGIS Foundation, Utrecht, pp. 955-964.Schneider, A., McIver, D.K., Friedl, M.A. <strong>and</strong> Woodcock, C.2001. Mapping urban areas using coarse resolutionremotely sensed data, Proceedings of IEEE/ISPRSworkshop on remote sensing <strong>and</strong> data fusion over urbanareas, Rome, November 2001, on CD Rom.Tanaka, S. <strong>and</strong> Sugimura, T. 2001. A new frontier of remotesensing from IKONOS images, International Journal ofRemote Sensing, 22, 1, pp. 1-5Weber, C. 2001. Remote sensing data used <strong>for</strong> urbanagglomeration delimitation, Donnay, J. P., Barnsley, M. J.<strong>and</strong> Longley, P. A. (eds.). Remote sensing <strong>and</strong> urban<strong>analysis</strong>, Taylor <strong>and</strong> Francis, London <strong>and</strong> New York, pp.155-167.Welch, R. 1982. Spatial resolution requirements <strong>for</strong> urbanstudies. International Journal of Remote Sensing, Vol. 3,No. 2, pp. 139-146.Woodcock, C. E. <strong>and</strong> Strahler, A. H. 1987. The factor <strong>scale</strong> inremote sensing, Remote Sensing of Environment, 21, pp.311-332.