WATER POVERTY IN THE NORTHEASTERN HILL REGION (INDIA)
WATER POVERTY IN THE NORTHEASTERN HILL REGION (INDIA)
WATER POVERTY IN THE NORTHEASTERN HILL REGION (INDIA)

Create successful ePaper yourself
Turn your PDF publications into a flip-book with our unique Google optimized e-Paper software.
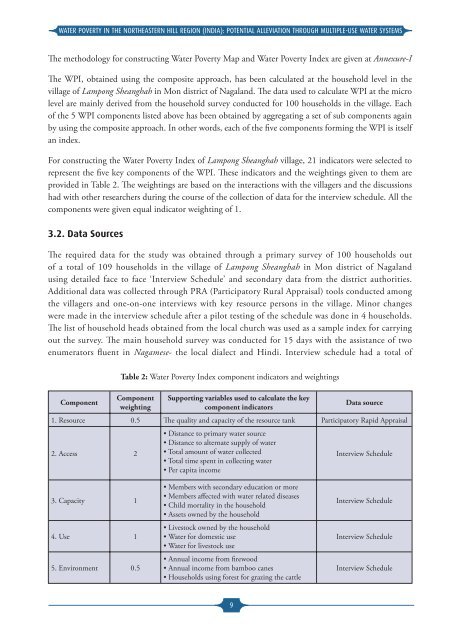
<strong>WATER</strong> <strong>POVERTY</strong> <strong>IN</strong> <strong>THE</strong> NOR<strong>THE</strong>ASTERN <strong>HILL</strong> <strong>REGION</strong> (<strong>IN</strong>DIA): POTENTIAL ALLEVIATION THROUGH MULTIPLE-USE <strong>WATER</strong> SYSTEMSThe methodology for constructing Water Poverty Map and Water Poverty Index are given at Annexure-IThe WPI, obtained using the composite approach, has been calculated at the household level in thevillage of Lampong Sheanghah in Mon district of Nagaland. The data used to calculate WPI at the microlevel are mainly derived from the household survey conducted for 100 households in the village. Eachof the 5 WPI components listed above has been obtained by aggregating a set of sub components againby using the composite approach. In other words, each of the five components forming the WPI is itselfan index.For constructing the Water Poverty Index of Lampong Sheanghah village, 21 indicators were selected torepresent the five key components of the WPI. These indicators and the weightings given to them areprovided in Table 2. The weightings are based on the interactions with the villagers and the discussionshad with other researchers during the course of the collection of data for the interview schedule. All thecomponents were given equal indicator weighting of 1.3.2. Data SourcesThe required data for the study was obtained through a primary survey of 100 households outof a total of 109 households in the village of Lampong Sheanghah in Mon district of Nagalandusing detailed face to face ‘Interview Schedule’ and secondary data from the district authorities.Additional data was collected through PRA (Participatory Rural Appraisal) tools conducted amongthe villagers and one-on-one interviews with key resource persons in the village. Minor changeswere made in the interview schedule after a pilot testing of the schedule was done in 4 households.The list of household heads obtained from the local church was used as a sample index for carryingout the survey. The main household survey was conducted for 15 days with the assistance of twoenumerators fluent in Nagamese- the local dialect and Hindi. Interview schedule had a total ofComponentTable 2: Water Poverty Index component indicators and weightingsComponentweightingSupporting variables used to calculate the keycomponent indicatorsData source1. Resource 0.5 The quality and capacity of the resource tank Participatory Rapid Appraisal2. Access 2• Distance to primary water source• Distance to alternate supply of water• Total amount of water collected• Total time spent in collecting water• Per capita incomeInterview Schedule3. Capacity 14. Use 15. Environment 0.5• Members with secondary education or more• Members affected with water related diseases• Child mortality in the household• Assets owned by the household• Livestock owned by the household• Water for domestic use• Water for livestock use• Annual income from firewood• Annual income from bamboo canes• Households using forest for grazing the cattleInterview ScheduleInterview ScheduleInterview Schedule9