WATER POVERTY IN THE NORTHEASTERN HILL REGION (INDIA)
WATER POVERTY IN THE NORTHEASTERN HILL REGION (INDIA)
WATER POVERTY IN THE NORTHEASTERN HILL REGION (INDIA)

Create successful ePaper yourself
Turn your PDF publications into a flip-book with our unique Google optimized e-Paper software.
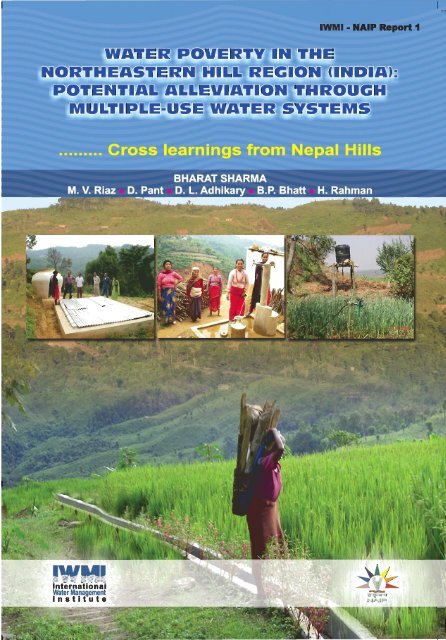
<strong>WATER</strong> <strong>POVERTY</strong> <strong>IN</strong> <strong>THE</strong> NOR<strong>THE</strong>ASTERN <strong>HILL</strong> <strong>REGION</strong> (<strong>IN</strong>DIA): POTENTIAL ALLEVIATION THROUGH MULTIPLE-USE <strong>WATER</strong> SYSTEMSWater Poverty in the Northeast Hill Region (India) :Potential Alleviation through Multiple- Use Water Systems1. The Key Issue…………Cross-learnings from Nepal HillsBharat Sharma,M.V. Riaz, Dhruba Pant, Deepak Adhikary, B.P. Bhatt, H. RahmanThe northeast region of India being highly rich in water resources potential, has not benefitted muchfrom such a natural wealth. The region, endowed with an enormous water potential of about 34percent of the country’s total water resources, represents only 7.9 percent of the total Indian landmass.The per capita and per hectare availability of water in India is highest in this region (Goswami, 2002).However, the societal (both productive and consumptive) water use is less than 5 per cent of the existingpotential. The unutilised and excessive water supplies during the rainy season create a mayhem ofdevastations almost every year with ravaging floods, land slides, soil erosion and other infrastructuralfailures and miseries and unrest in large parts. Extreme water scarcity during the post-rainy seasonseriously constrains the farmers’ access to a reliable water source and to a meaningful economic activityat the farm and extreme hardships for the household. This aptly presents a ‘water poverty’ scenario in anotherwise ‘water-abundant’ region.Though majority of the population is still dependent upon agriculture, livestock and allied land-basedactivities, the irrigated and diversified agriculture is an exception rather than the norm. The region isgenerally under mono-cropping during rainy season (rice, maize, coarse cereals, local pulses etc.) withvery low yield levels. Shifting cultivation, also known as ‘slash and burn agriculture’ (Jhum cultivation)is the chief means of livelihood of tribal people in these areas who have evolved this mode of cultivationin response to a difficult terrain and little access to agricultural inputs, including irrigation water.Under the prevailing conditions the vast potential of high value crops (exotic vegetables and fruits,spices and aromatic plants), floriculture, and livestock and poultry remains largely under-exploited.Additionally, large amounts of cereals, pulses and oilseeds and meat need to be regularly imported(unfortunately from water scarce regions) and stocked into the region to ensure food security andrespond to the food shortages and exigencies.Several farm-level water management innovations and traditional practices have been tried in thepast namely; integrated watershed management with a water harvesting structure as an integral part,sustainable multi-commodity farming systems, zabo (ruza) system of cultivation, bamboo drips,pani-kheti, Apatani system (Agarwal and Narain, 1997) and more recently storing rainwater inplastic-lined ponds (Jalkund) or ferro-cement tanks (Samuel and Satpathy, 2008). Several of thesemethods have found favor at local and/ or policy level and included into the development programsfor the region. As most of these interventions meet only the agricultural water needs (with littleeffort to integrate the domestic water needs) and generally do not have sufficient supplies when therequirements peak during the non-rainy season, their outscaling and adoption has been limited. It3
<strong>WATER</strong> <strong>POVERTY</strong> <strong>IN</strong> <strong>THE</strong> NOR<strong>THE</strong>ASTERN <strong>HILL</strong> <strong>REGION</strong> (<strong>IN</strong>DIA): POTENTIAL ALLEVIATION THROUGH MULTIPLE-USE <strong>WATER</strong> SYSTEMSmeasures are some of the dominant factors that cause and/ or intensify floods in the northeast region’.The flood hazard of as recent as 2004 was the most serious. The excessive precipitation besides causingcatastrophic flood hazards in plains and dangerous landslides, also causes excessive leaching lossesmaking the soils impoverished and acidic. Numerous springs, small streams and rivulets and largeamounts of continuous base flows suitable to meet water deficits during non-rainy periods largelyremain unutilised.The vast water resources of the region make little contributions towards economic activities. Againstan ultimate irrigation potential of about 4.26 M ha in the region, the area presently under irrigationis less than 20 % of the potential. Only 4.3% of existing groundwater potential has been developed sofar although availability of groundwater at relatively shallow depth (< 20 m) is very high in the region(Goswami and Das, 2003). Sourcewise irrigation potential developed in the NE region states is givenin Table 1. Inspite of the abundant water resources, the ratio of percent irrigated area to net sown areavaries from about 5 percent in Asom to 28 percent in Arunachal Pradesh with the average for the NEregion as a whole at 10.6 %. This is less than one-fouth of the national average of net irrigated area inthe country which currently stands at 43.2 %.Non-availability of irrigation water, especially during the non-rainy season either discourages farmersto use adequate inputs for crop production or retain the cultivated land as fallow. Even during therainy season, terminal droughts due to early withdrawal of monsoon are quite common. This leadsto poor crop yields and little incentive for diversified or high value agriculture (Sharma, 1996).Assured water supply, though for a limited area, is a pre-requisite for moving up the value chain andsustainable livelihoods. Additionally, non-availability of water for minimal domestic and livestockneeds causes water poverty and miseries to the population and is a major contributing factor forspread of a number of malnutrition and sanitation related diseases.The structure of economy of the states in the region indicates a low level of development. The shareof prinmary in the Net State Domestic Products (NSDP) is between 30 and 40% and share ofTable 1: Sourcewise net irrigated area* (‘000 hectare) in the northeast region states of IndiaTotal netirrigatedareaPercent irrigatedarea to net sownareaStateNet sownarea Canals TanksWells/TubewellsOthersourcesAsom 2,774 33 3 11 93 140 5.0Arunachal Pradesh 164 - - - 46 46 28.0Manipur 215 - - - 48 48 22.3Meghalaya 229 59 - - - 59 25.8Mizoram 94 15 - - - 15 15.9Nagaland 321 - - - 66 66 20.6Sikkim 110 1 - - 7 8 7.3Tripura 280 15 2 9 35 61 21.8N E Region 4,187 123 5 20 295 443 10.6* (Average over the years 2000 -2006)6
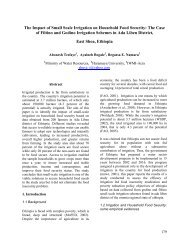
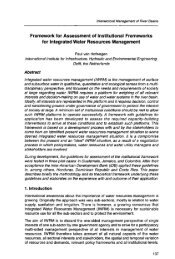
<strong>WATER</strong> <strong>POVERTY</strong> <strong>IN</strong> <strong>THE</strong> NOR<strong>THE</strong>ASTERN <strong>HILL</strong> <strong>REGION</strong> (<strong>IN</strong>DIA): POTENTIAL ALLEVIATION THROUGH MULTIPLE-USE <strong>WATER</strong> SYSTEMSWater resources availability: Too-much - too-little syndrome in the Himalayan hilly regions(Photo credit: Deepak Adhikary, IDE)agriculture is generally above 20%. Services provided by the government form a substantial driver ofconsumer demand in smaller states. Agriculture in the region is subsistence oriented as indicated bylow consumption of fertilisers, low coverage under irrigation and low yields compared to the nationalaverage. Paddy is the main crop of the region. Much agriculture is practised in single season. Whereflooding does not damage crops, the cropping is done in Sali (kharif, rainy) season and in regionsaffected by floods, crops are taken after the floods recede. Other crops taken in the region includemustard, potato, maize and a wide variety of vegetables but all with very low yields. Hilly states showwide prevalence of horticultural crops such as arecanut, citrus, pineapple, banana and ginger. Theregion is bulk producer of tea under commercially run tea estates.In most hilly states, people tend to have backyards or ‘homesteads’ (termed bari in local language) whichgrow a number of crops produced mostly for home consumption. These include bamboo, coconut,arecanut, yams, banana and a range of vegetables. Homesteads also support small scale livestock suchas pigs, goat and poultry including ducks. Presently, production from these homesteads is highlyinadequate to meet the family needs. These homesteads have the potential to provide main nutrition andlivelihoods to the families, especially women if these are provided with small but assured sources of water andrelated inputs and some markets and thus act as instruments for alleviating poverty.To arrive at suitable interventions for improving the access to water resources and alleviate waterpoverty of the population of the northeast region, it is essential that first we map the water povertyof a representative inhabitation and identify the contributing factors. The next section deals with themethodology and outcome of a village level study on water poverty mapping for a village in Mon districtof Nagaland state.3. Mapping Water Poverty in the Northeast RegionWater poverty mapping (WPM) can be defined as the mapping of water poverty indicators, aggregatedto a suitable spatial scale for the purpose of identifying areas of high levels of water poverty, so as toassist in targeting of water related policies and infrastructure to ensure the most effective use of scarceresources (natural, financial, and institutional) to meet the development objectives of the region. Water7
<strong>WATER</strong> <strong>POVERTY</strong> <strong>IN</strong> <strong>THE</strong> NOR<strong>THE</strong>ASTERN <strong>HILL</strong> <strong>REGION</strong> (<strong>IN</strong>DIA): POTENTIAL ALLEVIATION THROUGH MULTIPLE-USE <strong>WATER</strong> SYSTEMSpoverty mapping combines the strengths of the Water Poverty Index (WPI) as a composite measureof water poverty, with that of poverty mapping and geographic targeting as a way of allocating scarceresources more efficiently than traditional means tested, universal or other methods for identifying themost water-poor households and communities (Cullis and Gorgens, 2006).The objective of this study is to utilise the Water Poverty Index (Lawrence, Meigh and Sullivan, 2002)to estimate the extent and target the households affected by water poverty. Water Poverty Index and thesubsequent water poverty mapping is intended to act as a framework for a policy tool that can be usedto monitor the current or future state of water poverty in the region. The details of the components ofthe water poverty map will vary depending on the definition of water that is being considered and thespecific purpose for developing the WPM.3.1. Water Poverty IndexWater Poverty Index (WPI) is designed as a holistic tool to capture the whole range of issues which relateto water resources availability and their impacts on people (Sullivan, 2005). A conceptual frameworkof water poverty was developed in consultation with scientists, water practitioners and researchers atIWMI. The result was a definition of water poverty according to five key components:i. Resource: The physical availability of water supplied, taking account of the variability and qualityof the resource as well as the total amount of water.ii.Access: This implies access to water for human use, accounting for not only the distance to a safesource but also the time needed for collection of a household's water and other significant factors.Access means not simply safe water for drinking and cooking, but water for livestock, irrigatingcrops or for industrial use.iii. Capacity: Capacity implies the effectiveness of people's ability to manage water. It is interpretedin the sense of income to allow purchase of improved water, and education and health, whichinteract with income and indicate a capacity to lobby for and manage a water supply.iv.Use: The ways in which water is used for different purposes; it includes domestic, livestock,agricultural and industrial use.v. Environment: An evaluation of environmental integrity related to water and of ecosystem goodsand services from flora and fauna in the area.These five components are based on the theoretical foundation that poverty is a relative concept and isdefined by capability deprivation leading to a failure to command access to a sufficient water supply tomaintain a healthy livelihood. The five components of the WPI recognise that any measure of water povertymust include not only the physical availability of the resource, but also the socio-economic, political andenvironmental entitlements that govern a person's ability to command a secure and sustainable access tothe resource. Water poverty, therefore, encompasses a number of factors such as water availability, accessto water, capacity for sustaining access, the use of water and the environmental factors which impact onwater quality and the ecology which sustains the water resource.8
<strong>WATER</strong> <strong>POVERTY</strong> <strong>IN</strong> <strong>THE</strong> NOR<strong>THE</strong>ASTERN <strong>HILL</strong> <strong>REGION</strong> (<strong>IN</strong>DIA): POTENTIAL ALLEVIATION THROUGH MULTIPLE-USE <strong>WATER</strong> SYSTEMSThe methodology for constructing Water Poverty Map and Water Poverty Index are given at Annexure-IThe WPI, obtained using the composite approach, has been calculated at the household level in thevillage of Lampong Sheanghah in Mon district of Nagaland. The data used to calculate WPI at the microlevel are mainly derived from the household survey conducted for 100 households in the village. Eachof the 5 WPI components listed above has been obtained by aggregating a set of sub components againby using the composite approach. In other words, each of the five components forming the WPI is itselfan index.For constructing the Water Poverty Index of Lampong Sheanghah village, 21 indicators were selected torepresent the five key components of the WPI. These indicators and the weightings given to them areprovided in Table 2. The weightings are based on the interactions with the villagers and the discussionshad with other researchers during the course of the collection of data for the interview schedule. All thecomponents were given equal indicator weighting of 1.3.2. Data SourcesThe required data for the study was obtained through a primary survey of 100 households outof a total of 109 households in the village of Lampong Sheanghah in Mon district of Nagalandusing detailed face to face ‘Interview Schedule’ and secondary data from the district authorities.Additional data was collected through PRA (Participatory Rural Appraisal) tools conducted amongthe villagers and one-on-one interviews with key resource persons in the village. Minor changeswere made in the interview schedule after a pilot testing of the schedule was done in 4 households.The list of household heads obtained from the local church was used as a sample index for carryingout the survey. The main household survey was conducted for 15 days with the assistance of twoenumerators fluent in Nagamese- the local dialect and Hindi. Interview schedule had a total ofComponentTable 2: Water Poverty Index component indicators and weightingsComponentweightingSupporting variables used to calculate the keycomponent indicatorsData source1. Resource 0.5 The quality and capacity of the resource tank Participatory Rapid Appraisal2. Access 2• Distance to primary water source• Distance to alternate supply of water• Total amount of water collected• Total time spent in collecting water• Per capita incomeInterview Schedule3. Capacity 14. Use 15. Environment 0.5• Members with secondary education or more• Members affected with water related diseases• Child mortality in the household• Assets owned by the household• Livestock owned by the household• Water for domestic use• Water for livestock use• Annual income from firewood• Annual income from bamboo canes• Households using forest for grazing the cattleInterview ScheduleInterview ScheduleInterview Schedule9
<strong>WATER</strong> <strong>POVERTY</strong> <strong>IN</strong> <strong>THE</strong> NOR<strong>THE</strong>ASTERN <strong>HILL</strong> <strong>REGION</strong> (<strong>IN</strong>DIA): POTENTIAL ALLEVIATION THROUGH MULTIPLE-USE <strong>WATER</strong> SYSTEMS13 Sections (household, demography, health status, assets, access to infrastructure, land tenure,land use patterns, access to water, annual income, household consumption, impact of external andinternal shocks, ecosystem services).3.3. Area ProfileThe study was conducted in Lampong Sheanghah village of Mon district in the state of Nagaland in India.The geographic location of northeast region is strategically important as it has international borders withBangladesh, Bhutan, China, Myanmar and Tibet. The rich natural beauty, serenity and exotic flora andfauna of the area are invaluable resources for the development of eco-tourism. The region has a highconcentration of tribal population. The states of Arunachal Pradesh, Meghalaya, Mizoram and Nagalandare mostly inhabited by a number of native tribes. Each tribe has its own distinct tradition of art, culture,dance, music and life styles. The numerous fairs and festivals celebrated by these communities and theirfriendly nature are irresistible attractions for the visitors.3.3.1. NagalandAmong the northeastern states, Nagaland stands out as a land of diverse tribes, systems of governance,cultures, sheer colour and variety. As its 16 major tribes hold their festivals each calendar month of the year,Nagaland is often referred to as the ‘land of festivals’. Nagaland represents sociological and anthropologicalgold mines because it is still scientifically unexplored. The state is bounded by Asom in the west, Myanmaron the East, Manipur in the south and Arunachal Pradesh and part of Asom on the north. It lies between25 0 6’ and 27 0 4’ northern latitudes and between 93 0 20’ and 95 0 15’ eastern longitudes (Figure 1).Nagaland attained statehood in December 1963 and became the 16 th state of the Indian union. Thestate has an area of 16,579 km 2 (which constitutes 0.5% of the country’s geographical area) witha population of 19,88,636 (0.2% of the country’s population) as per 2001 Census. The numberof households in the state was 149,000 in 1981, which increased to 217,000 in 1991. The state ispredominantly rural, with 82.3 percent of the population living in villages, generally situated onhigh hilltops or slopes overlooking verdant valleys. Till January 2004, Nagaland consisted of eightadministrative districts, with 52 blocks, nine census towns and 1,286 inhabited villages. Each districtgenerally has predominant concentration of one of the major/ minor tribes of the state, makingthe districts distinct in their socio-political, traditional, cultural and linguistic characteristics. Ofthe eight districts, Tuensang is the largest, occupying 25.5 percent of the total area of the state,followed by Kohima with 18.79 percent. The Naga Hills run through this small state, which hasSaramati as its highest peak at a height of 12,600 ft. The main rivers that flow through Nagaland areDhansiri, Doyang, Dikhu and Jhanji. The terrain is mountainous, thickly wooded, and cut by deepriver valleys. There is a wide variety of plant and animal life. Nagaland has a monsoon climate withgenerally high humidity; rainfall averages between 1,800 and 2,500 mm/ annum.The Nagas, inhabitants of Nagaland, are said to belong to the Indo-Mongoloid stock, a race whose presencewas first noted ten centuries before Christ, at the time of the compilation of the Vedas. The Nagas form morethan 20 tribes, as well as numerous subtribes, each having a specific geographic distribution. Though sharingmany cultural traits, these tribes have maintained a high degree of isolation and lack cohesion as a singlepeople. The Konyaks are the largest tribe, followed by the Aos, Tangkhuls, Semas, and Angamis. Other tribes10
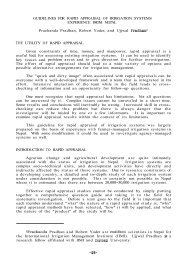
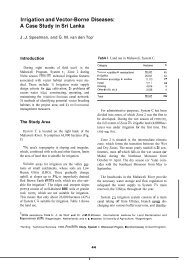
<strong>WATER</strong> <strong>POVERTY</strong> <strong>IN</strong> <strong>THE</strong> NOR<strong>THE</strong>ASTERN <strong>HILL</strong> <strong>REGION</strong> (<strong>IN</strong>DIA): POTENTIAL ALLEVIATION THROUGH MULTIPLE-USE <strong>WATER</strong> SYSTEMSinclude the Lothas, Sangtams, Phoms, Changs, Khiemnungams, Yimchungres, Zeliangs, Chakhesangs (Chokri),and Rengmas. The principal languages are Angami, Ao, Chang, Konyak, Lotha, Sangtam, and Sema.Weaving is a traditional art handed down through generations in Nagaland. Each of the major tribes has itsown unique designs and colours. Tribal dances of the Nagas give us an insight into the inborn reticence ofthese people. Some of the important festivals are Sekrenyi, Moatsu, Tuluni and Tokhu Emong. The traditionalNaga religion is animistic, though conceptions of a supreme creator and an afterlife exist. Nature is seen tobe alive with invisible forces, minor deities, and spirits with which priests and medicine men mediate. In the19th century, with the advent of British rule, Christianity was introduced, and Baptist missionaries becameespecially active in the region. As a result, the population now is predominantly Christian.Nagaland is predominantly a rural state. More than four-fifths of the population lives in small,isolated villages. Built on the most prominent points along the ridges of the hills, these villages wereonce stockaded, with massive wooden gates approached by narrow, sunken paths. The villages areusually divided into khels, or quarters, each with its own headmen and administration. Dimapur,Kohima, Mokokchung, and Tuensang are the only urban centres with more than 20,000 people.3.3.2. Mon districtMon district is the northernmost district of Nagaland. It is bounded by the state of Arunachal Pradeshto its north, Asom to its west, Myanmar to its east, Longleng District to its south-west and TuensangDistrict to its south. The town of Mon is its district headquarters.This district is the home of the Konyak Nagas and it is interesting to see tattooed faces wearingfeathers. Konyaks are adept artisans and skilled craftsmen. Here one can find excellent wood carvings,daos (machetes), guns, gunpowder, head brushes, headgear, necklaces, etc. made by these artisans andcraftsmen. The most colourful festival of the Konyaks is the "Aoling Monyu", which is observed duringthe first week of April every year.Mon town, the district headquarters, is situated at an altitude of 897.6 m above sealevel. It is about357 km away from Kohima, the state capital. Even though a civil administration runs the day-to-dayaffairs of the district, Mon district is actually ruled by tribal chiefs called Angs. These Angs controldifferent areas of Mon district. Basically, the word of an Ang is law in these parts. Nobody questionshis authority. Mon is the only district in Nagaland to have this unique institution of Angship. Hissuccession is hereditary in nature.Agriculture is the main occupation of the people by way of Jhum cultivation. A few people in some areasdo permanent cultivation near the riverbanks. Besides, handicrafts like weaving, basket making, cane andbamboo works, headgears, spears and Daos (Naga knives), leather-shields, etc. are popular but generate very lowincomes. Some of the traditional handloom products are shawls, ladies’ Mekhelas (wrap-around), waistcoats,and ties, bracelets, necklaces etc. made of beads. Further details on Mon district are given at Table 3.3.3.3. Village profile: Lampong SheanghahLampong Sheanghah village is located 12 km from Mon Town in the Mon district of Nagaland (Figure2). The name ‘Lampong Sheanghah’ means ‘village at junction’ and it lies on the road leading towards11
<strong>WATER</strong> <strong>POVERTY</strong> <strong>IN</strong> <strong>THE</strong> NOR<strong>THE</strong>ASTERN <strong>HILL</strong> <strong>REGION</strong> (<strong>IN</strong>DIA): POTENTIAL ALLEVIATION THROUGH MULTIPLE-USE <strong>WATER</strong> SYSTEMSTable 3: Details of Mon district (Nagaland, India) at a glanceArea 1,786 km 2District headquartersMon (Altitude = 897.64 m above sea level)Population 2,59,604 (Provisional Census 2001)Density of population 145 per km 2 (Provisional Census 2001)Sex ratio881:1000 (Females per 1000 males)Literacy rate 42.25 % (Male: 46.7 %; Female : 37.1%)Decennial growth of population 73.42 % (Provisional Census 2001)Average annual rainfallAverage temperatureHighest peakImportant rivers/rivuletsInternational trade centreRural development (RD) blocksNumber of hospitals (Govt.-run)Ranges from 2000 mm to 3000 mm24.4 degree CelsiusShawot (Altitude = 2,414 m above sea level)Dikhu Tizit, Tehok, Tekang, Tapi, Kaimang, Yityong, Telangsao, etc.01 (Located at Longwa – 59 km from Mon district headquarters)06 (Mon, Chen, Wakching, Tizit, Tobu, Phomching)02 (Mon: 50-bedded, Wakching: 06-bedded)Number of recognised villages 113Number of schools 194Number of colleges01 (Wangkhao Govt. College, Mon)Mon town. The village like many other villages in Mon district is largely an unexplored area having a100% tribal population. Developmental activities have been undertaken only in the last few years inthe village.3.4. Socio-Economic Characteristics of Village Lampong SheanghahThe place where Lampong Sheanghah is presently located was a very thick forest even in the late 1800’s.There was no human settlement here. The whole area was owned by the Konyak tribe which was settledin the far off village of Mon. The first settlement happened around the year 1892 when 18 householdssettled here. The present population in the village are mostly descendants of these 18 families.3.4.1. History about Konyaks TribeThe Konyaks were a feared tribe since they had the reputation of being head hunters, but all this changeddrastically with the advent of Christianity and the entry of missionaries in the area. The missionariesworked to bring the people towards the mainstream society. Due to their effort, the population in thevillage and surrounding areas is exclusively Christian. Since first introducing education, the churcheshave continued to contribute very significantly to education, health and human resource building in12
<strong>WATER</strong> <strong>POVERTY</strong> <strong>IN</strong> <strong>THE</strong> NOR<strong>THE</strong>ASTERN <strong>HILL</strong> <strong>REGION</strong> (<strong>IN</strong>DIA): POTENTIAL ALLEVIATION THROUGH MULTIPLE-USE <strong>WATER</strong> SYSTEMSLAMPONGSHEANGHAHvillageArunachalPradesh MonAsomMokokchungLonglengTuensangMyanmarWokhaZunhebotoDimapurKiphireKohimaPhekPerenManipurFigure 2: Map showing location of Mon district and the project site in the Nagaland stateSome typical faces of Naga rural population and a household(Photo credits: Vimal Riaz and Steve Mann (for Naga youth)13
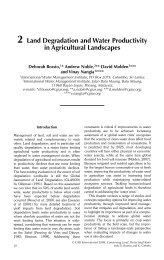
<strong>WATER</strong> <strong>POVERTY</strong> <strong>IN</strong> <strong>THE</strong> NOR<strong>THE</strong>ASTERN <strong>HILL</strong> <strong>REGION</strong> (<strong>IN</strong>DIA): POTENTIAL ALLEVIATION THROUGH MULTIPLE-USE <strong>WATER</strong> SYSTEMSNagaland. In the traditional Konyak society, the Ang or the chief was the supreme head of the village.He was considered sacred and his word was taken as law. Frequently, the specific issues would be passeddown to the khels, clans and families before the Ang could come to a decision. ‘Khel’ is a distinct Nagainstitution that brings together several clans within the village community. A village usually has two orthree khels although there could be more. Membership of a khel is decided by birth/heredity. Althoughinformally organised, with elders playing the prominent roles, this was the most important and effectiveinstitution in village governance. No village decision could be taken without the inclusion and approval ofall the khels in the village. The khel also had power to overrule individual clan decisions although this wasavoided because of the harmful consequences for khel conflicts. This is so even today despite the growth ofso many community level organisations/groups and the over-arching authority of the government. Lately,the authority of the Ang has been reduced drastically. This is due to the advent of democratic thinkingamong the community. But still, in certain internal disputes, the Ang’s word is taken as final.With the advent of democracy, the Village Council has come into prominence than any otherinstitution. The Village Council at Lampong Sheanghah consists of 13 members and a Village CouncilChairman. The tenure of Village Council is for five years. Village Council members are chosen byvillagers in accordance with the prevailing customary practices and usages. Hereditary Village Chief,Ang is an ex-officio member with voting rights. The Village Council has special powers to maintainlaw and order and administer justice within the village limits in accordance with the customarylaws and usages as accepted by the canons of justice established in Nagaland. For the purpose ofdecentralisation and to implement developmental work in the village, the Village DevelopmentBoard has also been set up. The Village Development Board formulates development priorities forthe village, prepares action plans and executes them, using the village community or other funds.All residents of the village are members of the General Body of the Village Development Board.Two General Body meetings are held in a financial year, where the Secretary of the Board presentshis reports, along with detailed audited financial statements.The Lampong Sheanghah Village is divided into 5 colonies or clusters; (a) Upper colony (Ching Kho), (b) Middlecolony (Ching Tan), (c) Lower colony (Ching Chong),(d) New Side colony (Ching Lan), and (e) New Upper colony(Fig. 3). Even though the villagers claim otherwise, the distribution of households in these colonies seems to bebased on the clan that one belongs to. There are 13 clans within the village; Ang, Langsym, Wang Nao, Wangsa,Khaman, Naham, Nyemam, Wangsu, Khanlau, Tomkhu, Wanglang, Longnye and Gamma.The Ang’s clan is regarded as the most supreme of all the clans. The Angs do not sit with membersof other clans to eat. They will not touch others’ food or eat food touched by others. There are evencertain restrictions and regulations on marriage among the clans. Even though such a large numberof clans exist in the village, Lampong Sheanghah is a relatively peaceful village when compared to itsneighbours. The only instances of violence in the village are when the warring underworld groupsfrom the neighbouring country of Myanmar occasionally clash over the collection of money fromthe villagers. The villagers are made to compulsorily offer Rs. 500 or Rs.1,000 (in case of well-offhouseholds) to these underground gangs operating from Myanmar. In addition to the money, they arealso being provided with food and other provisions on a yearly basis. In case of families who defaulton this, they are dealt with force.14
<strong>WATER</strong> <strong>POVERTY</strong> <strong>IN</strong> <strong>THE</strong> NOR<strong>THE</strong>ASTERN <strong>HILL</strong> <strong>REGION</strong> (<strong>IN</strong>DIA): POTENTIAL ALLEVIATION THROUGH MULTIPLE-USE <strong>WATER</strong> SYSTEMSCluster-wise Distribution of Households in Lempong SheanghahChing Lan( New Side Colony)13%New Upper Colony12 %Ching Chong( Lower Colony)17%Ching Kho( Upper Colony)27 %Ching Tan( Middle Colony)31%Figure 3: Cluster-wise distribution of households in Lampong Sheanghah village, Mon district, Nagaland3.4.2. Demography of the villageAccording to the Census (2001), the total population in the village is 873. Out of this, 466 are men andthe rest 407 are women. The literacy rate is 48.1%. Further details of the village are given at Table 4.As is evident from the data, the village has not been able to initiate permanent/ settled agricultureand most of it is only under Jhum- ‘slash and burn agriculture’. As discussed in later sections, theproductivity levels from the Jhum fields were extremely low. The only productive spots in the villagewere homestead gardens which could meet very little of the daily requirements of vegetables, fruits,spices or add to the livelihoods. The village did not have a source of irrigation though a number ofsmall rivulets/ springs were available in and around the village. Recently, drinking water supply wasmade available to the village through efforts of World Vision -a religious NGO in the district.3.4.3. Health(Source: Household survey by the authors)The family size of the households in Lampong Sheanghah varies from 2 to 14 members. The averagesize of a household is 8 members. This high family size could be attributed to the fact that the villagers15
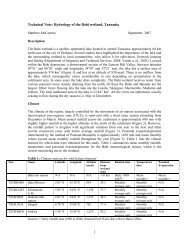
<strong>WATER</strong> <strong>POVERTY</strong> <strong>IN</strong> <strong>THE</strong> NOR<strong>THE</strong>ASTERN <strong>HILL</strong> <strong>REGION</strong> (<strong>IN</strong>DIA): POTENTIAL ALLEVIATION THROUGH MULTIPLE-USE <strong>WATER</strong> SYSTEMSTable 4: A snapshot of village Lampong Sheanghah, Mon district, Nagaland, IndiaMain workers 20.6%Unemployed 18.4%Cultivators 46.7%House hold industries 8.9%Others 44.4%Total households (as on 2005)115 (local tax paying)Households willing to do manual work 115KhelMorungJhum sitesJhum cycle2 (Ching Chun, Ching Kho)1 (Shangle Po)8 (Mankong, Yankhan, Wanma, Khemo, Nyaman, Nyakho,Tanam, Long Nyah.)Year of use: One year; Year of fallow: 7 YearsHouseholds undertaking only Jhum cultivation 114Households doing permanent cultivationNilHousehold doing permanent and Jhum 1Non cultivating householdsLand use: Under terracingUnder horticultureUnder social forestryUnder JhumCrops in JhumNilNilNil600 acre (243 ha)1,000 acre (405 ha)Paddy, millets, banana, orange, maize, yam, ginger, king-chilly,pumpkin, cucumber, bean, jackfruitare of the view that a bigger family size is always better. The sex ratio at Lampong Sheanghah villageis 115.24 with a total of 378 males and 328 females . The village has only one dispensary, that toonon-functional. A lady compounder is present in the village, but for all practical purposes, the sickhave to be taken to Mon town, Asom, Dimapur or Kohima. Due to this dismal condition of healthservices in the village, the prevalence of diseases is very high (Fig. 4). Several of these diseases arewater borne and reflect the state of water poverty. The child mortality rate in the village is also veryhigh. The absence of health services is evident from the fact that a majority of the villagers attributethe death of their children to ‘evil spirits’. Malnourishment is also highly prevalent in the village witha majority of the children being underweight. This reflects the non-availability of pulses, vegetablesand other sources of nutrition in the daily intake.All the households in the village have some sanitation facilities within their household premises. Thisreality is due to the efforts taken by the church and the NGO- World Vision which is operational in the16
<strong>WATER</strong> <strong>POVERTY</strong> <strong>IN</strong> <strong>THE</strong> NOR<strong>THE</strong>ASTERN <strong>HILL</strong> <strong>REGION</strong> (<strong>IN</strong>DIA): POTENTIAL ALLEVIATION THROUGH MULTIPLE-USE <strong>WATER</strong> SYSTEMSPrevalence of diseases in Lempong Sheanghah villageMalaria32%No Diseases56 %Tuberculosis5 %Water Borne Diseases7 %Figure 4: Number of households with sick members in the Lampong Sheanghah village.(Source: Household survey by the authors)village. The NGO also conducts regular health camps in the village to raise awareness regarding varioushealth issues in the area.3.4.4. EducationThe illiteracy level (adults over the age of 15 who have never been to school) in the village is 30% (Fig.5). There are only two schools in the village, one government run and the other run by Mr. Wango- aphilanthropist in the village. The government school has classes only up to standard 5 and the privateschool has classes up to standard 8. The importance of literacy is slowly catching up in the village andalmost all children of school going age are sent to schools.3.5. AgricultureRainfed Agriculture is the main livelihood activity of the people of Lampong Sheanghah. The majorcrops grown in the village are paddy, maize, millets and other vegetables. All the households in thevillage mainly follow Jhum or shifting cultivation. Since all the agricultural land in the village ispredominantly on hill slopes and follows practices of Jhum cultivation, the productivity of the land isrelatively very low compared to other parts of the country. Improved agricultural practices like terracecultivation, use of fertilisers and pesticides, ploughing, use of farm implements and irrigation are not17
<strong>WATER</strong> <strong>POVERTY</strong> <strong>IN</strong> <strong>THE</strong> NOR<strong>THE</strong>ASTERN <strong>HILL</strong> <strong>REGION</strong> (<strong>IN</strong>DIA): POTENTIAL ALLEVIATION THROUGH MULTIPLE-USE <strong>WATER</strong> SYSTEMS500450400350300250200150100500442 (52.1%)384 (45.2%)23 (2.7%)Can't read or write Can read only Can read and writeLiteracy levelFigure 5: Literacy level in Lampong Sheanghah, Mon district, Nagalandprevalent in this area. This is surprising, considering the fact that the vast tracts of land near Kohimathecapital of Nagaland is under terrace cultivation. Around 55% of the households in the villagehave kitchen gardens varying in area from 15 m 2 to 5,200 m 2 . The average area of kitchen garden(homesteads) is around 100 m 2 and the major vegetables grown in these gardens are onions, garlic andother green leafy vegetables. Number of households providing irrigation to these kitchen gardens isvery negligible and as such productivity is low and hardly meets requirements of a large family. Withan assured water supply and other inputs, these small pieces of land have the potential to be convertedinto highly productive economic units to meet family requirements and also surplus for the markets.3.5.1. Jhum cultivationThe predominant form of agriculture in the area is Jhum cultivation or shifting cultivation (slashand burn agriculture). This form of cultivation has been devised over generations through the innateexperience and knowledge gained by the local tribes over land, labour, environmental resources availableand the cropping/food requirements. Though often considered primitive and unproductive, Jhum is acomplex agricultural system that is well adapted under certain conditions, which requires exhaustivecomprehension of the environment to succeed. The major challenge continuing to face Nagaland is howto adapt its land use pattern and production systems to the increased population and changing lifestyles,making them biologically and economically sustainable. Shifting cultivation covers over 73 percent ofthe total arable area of the state. It is mostly concentrated in the districts of Mokokchung, Tuensang,18
<strong>WATER</strong> <strong>POVERTY</strong> <strong>IN</strong> <strong>THE</strong> NOR<strong>THE</strong>ASTERN <strong>HILL</strong> <strong>REGION</strong> (<strong>IN</strong>DIA): POTENTIAL ALLEVIATION THROUGH MULTIPLE-USE <strong>WATER</strong> SYSTEMSSites of Jhum cultivation around Mon, Nagaland: frequently exposing fragile soils to intense rains(Photo credits: Vimal Riaz and Steve Mann(for red soil Jhum)Wokha, Zunheboto and Mon. Efforts made under Nagaland Empowerment of People through EconomicDevelopment (NEPED) has demonstrated some good alternatives.Jhum, or shifting cultivation, is characterised by shifting of the primary site of cultivation in cycles,the choice of crops influenced by local needs, experience and availability of planting materials locally.Burning of Jhum fields is considered to be one of the most important operations for the success ofshifting cultivation. Proper burning of field requires a good deal of skill, knowledge, and expertiseand is believed to keep the area weed-free for a long period. It is also believed that burning adds morenutrients to the soil, enhances fertility, and reduces the time required for de-weeding. Special care istaken to ensure that the fire does not spread into adjoining forests. This is done by clearing an area ofabout 5 m between the cleared Jhum and the forest, normally a week before the burning operation.After burning, the poorly/partially burnt plants, logs and vegetations are collected and put in piles atone place and then burnt again. This secondary burning site makes a good nursery bed. This practice,particularly the burning of forests, is critically viewed because of its possible impact on the land andenvironment.3.5.2. Cultivation process followedPrior to the commencement of sowing, the village priest would be invited to initiate the formal sowingon any day after the tenth day following the new moon. Dibbling and broadcast methods of sowing aregenerally practised by farmers in Jhum. Naga farmers consider inter-culture as one of the most essentialoperations for the success of Jhum cultivation, in which weeding is an important aspect. The use ofcommon salt as weedicides is popular in shifting cultivation.In the Jhum fields, harvesting is usually a continuous process and lasts almost the whole year. Manycrops, especially vegetables, sown before and during the sowing of the main crop, mature early and areharvested continuously. The main crop is usually harvested sometime in September-October. Once theprimary crop is harvested in October, the field is rested for a very short period. And then it is clearedagain for the second year crop. Normally farmers cultivate for two years after which the land is left19
<strong>WATER</strong> <strong>POVERTY</strong> <strong>IN</strong> <strong>THE</strong> NOR<strong>THE</strong>ASTERN <strong>HILL</strong> <strong>REGION</strong> (<strong>IN</strong>DIA): POTENTIAL ALLEVIATION THROUGH MULTIPLE-USE <strong>WATER</strong> SYSTEMSfallow for 7–9 years. The fallow period used to be 15–20 years but because of pressure of land andpopulation the average Jhum cycle in recent years has reduced to 8 and even 5 years in some areas.3.5.3. Cropping pattern in JhumsThe crops sown by the shifting (Jhum) cultivators of the region are based on tradition. Mixedcropping is the main cropping system. In mixed cropping system crops are sown in irregularfashion or random planting. There are no definite crop mixtures. Every cultivator follows his ownsystem of crop combination according to his family requirements. But, the majority of farmers inthe village grow rice as the main crop and along with it grow maize, millets and other vegetables(mainly Taro) as mixed crops. Here, Jhum farmers normally grow as many crops as possible, asdecided by the community.3.5.4. Economic yield pattern under JhumThough specific data could not be collected on the economic yield under shifting cultivation,production is used as a proxy for looking at it from the viewpoint of benefits generated. Since thepeople in the village do not have a measure of their land nor the production, the land ownershipand the area of land sown have been identified by pointing out to the school playground whichwas approximately 1 acre in area and using it as a reference point. Even the production has beenidentified by helping them recall number of baskets of grains they have carried home. Each basketweighs approximately 14 kg when filled with grains. The above methods are not foolproof andnecessary corrections have been made wherever applicable to make the data as close to actual valuesas possible.3.5.5. Animal husbandryAnimal husbandry in Lampong Sheanghah includes rearing mainly pigs and cattle. Forty-five percentof the households in the village are active in pig rearing. Pigs are generally kept in enclosuresconstructed near the house. They are fed with household waste, agricultural by-products and maizewhich are all boiled together and fed to the animals. Fully grown pigs are sold for anything betweenRs 8,000 and Rs 15,000. About 34% of the families in the village rear cattle. Cattle in the villageare reared mainly for meat and not for milk; even the cow dung is not used as manure. Cows andbuffaloes are allowed to graze in the forest during the day. They are not provided any feed from thehouseholds. Since the cattle are left unattended, there have been instances of them being stolen orkilled in accidents on the road.Most households (about 71%) also reared poultry. The birds are kept solely for the purpose of meat andnot for eggs. Since chicken is expensive in these parts, poultry is a good supplement to regular incomefor the households. Some of the households keep ducks instead of hen as they fetch a better price inthe market. ICAR- Regional Centre, Nagaland had distributed live chicken (Kuroiler breed) to a largenumber of households for rearing, but a majority of them died due to disease.20
<strong>WATER</strong> <strong>POVERTY</strong> <strong>IN</strong> <strong>THE</strong> NOR<strong>THE</strong>ASTERN <strong>HILL</strong> <strong>REGION</strong> (<strong>IN</strong>DIA): POTENTIAL ALLEVIATION THROUGH MULTIPLE-USE <strong>WATER</strong> SYSTEMSPig rearing close to the homesteads is an important economic activity for the Naga households( Photo credit: Steve Mann, ILRI)3.6. Agriculture Research and Demonstration Site at the VillageICAR-Regional Centre, Nagaland along with the consortium partners is working in Lampong SheanghahVillage as part of the NAIP (National Agricultural Innovation Project) supported Project on ‘LivelihoodImprovement and Empowerment of Rural Poor through Sustainable Farming System’. The project has madea great deal of progress considering the short span of time that it has taken since inception. The majorinterventions undertaken in this site include the following:i. Terracing for Panikheti (Terrace cultivation)ii. Irrigation channels for water distribution and applicationiii. Two water harvesting structures (Dug-out ponds)iv. Plantation of horticultural and silvicultural trees and vegetablesv. Cultivation of suitable varieties of paddy, maize, sweet potato and cassavavi. Two pig rearing unitsvii. Five poultry rearing unitsSince the site is located on steep slopes of hills that are characteristic of the region, terraces have beenconstructed under the project for the cultivation of crops. This method of cultivation may in future be asubstitute for the Jhum cultivation (Shifting cultivation) that the people presently follow.Irrigation channels have also been constructed which help in providing irrigation to the various levelsof terraces along the slope. This shall help in higher production per unit of land. Two water harvesting21
<strong>WATER</strong> <strong>POVERTY</strong> <strong>IN</strong> <strong>THE</strong> NOR<strong>THE</strong>ASTERN <strong>HILL</strong> <strong>REGION</strong> (<strong>IN</strong>DIA): POTENTIAL ALLEVIATION THROUGH MULTIPLE-USE <strong>WATER</strong> SYSTEMSNAIP-ICAR experimental site for improved agricultural practices and irrigation(Photo credit: Bharat Sharma)structures have been constructed at different levels in the site to act as a reservoir of rainwater, butsuffer due to insufficient dimensions and delayed maintenance. There is an urgent need to increase thedimensions of these structures and also to build a few more in this site especially at the top for collectionof storage water for use during exigencies. Plantation of several horticultural trees like peach, lemon,mandarins and silvicultural trees like Hollock has also been done. The terraces have been planted withrice, maize, etc. and cassava and sweet potato have been planted along the slope. The villagers find thedemonstrations highly innovative and interesting and having high potential of livelihood improvement.Impact of these demonstrations on out-scaling to other sites may be available in later years.3.7 Water Resources at the Project Site (Village)Presently, there is only one developed water source which is located 0.5 km from the village. The sourceis baseflow water from the upper catchments. Water from this source is diverted through pipes to 5 water22
<strong>WATER</strong> <strong>POVERTY</strong> <strong>IN</strong> <strong>THE</strong> NOR<strong>THE</strong>ASTERN <strong>HILL</strong> <strong>REGION</strong> (<strong>IN</strong>DIA): POTENTIAL ALLEVIATION THROUGH MULTIPLE-USE <strong>WATER</strong> SYSTEMStanks which are constructed in various parts of the village. Water from these tanks is further distributedamong the households by way of GI pipes. The initial work for this distribution of water was done bythe NGO- World Vision. Further work on this front is being carried forward by ICAR, which has alsodiverted water to households by way of GI pipes. This small water supply scheme only partly meets thedomestic water needs.The average rainfall in Mon district during drymonths is very low and the water source runs dry.During these months the villagers have to rely onthe stream which flows further down the slope of thevillage. Collection of water during these dry periodsis very difficult since on an average, the villagershave to travel 630 m, that too on an uneven terrainto fetch water. It is not uncommon to find womenand children going to fetch water from nearby tapsearly in the morning. The amount of water collectedby each household depends mainly on the number offemale members in the family since it is the womenwho go out to fetch water. Households having cattlehave higher consumption of water. Water is collectedin either plastic buckets or more commonly inbamboo containers. The average amount of watercollected by one adult female is 20 litres per trip.Small children also help in fetching water. On anaverage, every household collects water 2-3 timesa day. Such meagre supplies can hardly meet theconsumptive water needs of the family and there ishardly any water supplies for productive purposes orother enterprises. This leads to a very high level of water poverty which is discussed in thefollowing sections.3.8 Water Poverty Map of Lampong SheanghahWaterbottleCoping with water scarcity in LampongSheanghah, Mon, Nagaland(Photo credit: Bharat Sharma)The households of village of Lampong Sheanghah were ranked according to their WPI score. A low scoreon the WPI indicates high water poverty and vice versa. Any value of less than 0.5 indicates high levelof water poverty. The final WPI composite index scores for each cluster/ colony inhabitants and the finalscores for the whole of Lampong Sheanghah are shown in Table 4. The same results are shown in graphicalform by way of a WPI pentagram for the various clusters/colonies of the village (Fig 6).Since WPI is a relative measure of water poverty, it is not possible to determine the absolute state ofwater poverty in the case study area from the Water Poverty Index alone. However, it is possible to drawsome valid conclusions on the relative nature of water poverty between the clusters/ colonies or amongthe various households. The following conclusions can be drawn from the WPI and the correlationcoefficients (Table 5) for the WPI components:23
<strong>WATER</strong> <strong>POVERTY</strong> <strong>IN</strong> <strong>THE</strong> NOR<strong>THE</strong>ASTERN <strong>HILL</strong> <strong>REGION</strong> (<strong>IN</strong>DIA): POTENTIAL ALLEVIATION THROUGH MULTIPLE-USE <strong>WATER</strong> SYSTEMSTable 4: Water Poverty Index (WPI) Composite Index Scores for each cluster/ colony of the village LempongSheanghah, Mon, NagalandCluster/ Colony Resource Access Capacity Use Environment WPIChing Lan(New side Colony)0 0.310 0.393 0.113 0.968 0.349Ching Kho(Upper Colony)0.500 0.457 0.424 0.198 0.826 0.477Ching Tan(Middle Colony)0.833 0.479 0.414 0.172 0.909 0.546Ching Chong(Lower Colony)0.500 0.312 0.342 0.081 0.989 0.422New Upper Colony 1.0 0.341 0.412 0.100 0.980 0.529Lampong Sheanghah 0.383 0.406 0.402 0.147 0.916 0.444Ching Lan(New Side Colony)NewUpper Colony)Ching Kho(Upper Colony)ResourceAccessCapacityUseEnvironmentChing Chong(Lower Colony)Ching Tan(Middle Colony)Figure 6: Water Poverty Index Pentagram for various clusters/ colonies in Lampong Sheanghah village, Nagaland24
<strong>WATER</strong> <strong>POVERTY</strong> <strong>IN</strong> <strong>THE</strong> NOR<strong>THE</strong>ASTERN <strong>HILL</strong> <strong>REGION</strong> (<strong>IN</strong>DIA): POTENTIAL ALLEVIATION THROUGH MULTIPLE-USE <strong>WATER</strong> SYSTEMSTable 5: Correlation coefficients for the Water Poverty Index (WPI) component scoresComponent Resource Access Capacity Use Environment WPIResource 1.00Access 0.14 1.00Capacity 0.08 0.37 1.00Use 0.13 0.45 0.25 1.00Environment 0.08 0.13 0.04 0.48 1.00WPI 0.50 0.68 0.57 0.36 0.11 1.00i. The inhabitants in the New Side cluster ( Ching Lan) have the lowest relative WPI score (0.349)and it is therefore the most water poor cluster in the village. This also shows that the developedwater resource is hardly sufficient to meet the domestic needs of existing population and anyfurther expansion shall face very high water poverty.ii.iii.iv.v.vi.The Middle cluster/ colony ( Ching Tan) has the highest relative WPI score (0.546) and is thus theleast water poor cluster in the village. In absolute terms even this WPI score does not rank veryhigh to suggest sufficiency of water resource.The two highest ranking colonies in the Water Poverty Index (Middle Colony- Ching Tan and NewUpper Colony) are colonies with relatively high access to water resources and where high capacitywater storage structures have been recently constructed.The “Access to Water Resource” component has the most significant impact on water povertysince the correlation coefficient of that component (0.68) is the maximum among all thecomponents. This explicitly explains that it is not the resource per se, but the provision ofaccess to water resource which is most important for alleviating water poverty. It is trueeven in so called ‘water abundant’ villages of Nagaland and north east region.The environment component seems to have very less effect on water poverty (Correlationcoefficient 0.11).There appears to be a high correlation between ‘Access’ and ‘Capacity’ which indicates thatthe restriction on access may be due to the lack of education or income. Alternatively, it canalso be argued that the limitation on capacity may be due to poor accessibility to water. Theopportunity cost in collecting water for household consumption seems to be very high.vii. There is an urgent need to augment the water resource in the village through construction of adequatewater storage and distribution structures (especially in New Side cluster/colony, Ching Lan).viii. Water from all the water storage structures should be provided with primary treatment so as to makeit fit for human consumption. The supply for productive purposes (livestock, homestead gardens)may be addressed separately or through enhanced supplies.25
<strong>WATER</strong> <strong>POVERTY</strong> <strong>IN</strong> <strong>THE</strong> NOR<strong>THE</strong>ASTERN <strong>HILL</strong> <strong>REGION</strong> (<strong>IN</strong>DIA): POTENTIAL ALLEVIATION THROUGH MULTIPLE-USE <strong>WATER</strong> SYSTEMSix.x.The distribution network to all the clusters needs significant improvement for enhancing the scorerelated to the ‘Access’ component.Since a major part of the ‘Capacity’ component is related to the per capita income, it is imperativeon part of any developmental agency to improve the household income for the householdswhich rank poor on that front. Since agriculture is the main occupation of a majority of thehouseholds in the village, all efforts should be directed towards improving the farm productivityin the village. This shall be possible mainly through improving access to an assured water supplysource. To start with, homestead gardens should be supplied with small but assured supply ofwater resources.The general conclusion that can be drawn from this study is that ‘Access’ and ‘Capacity’ are the twomajor factors contributing to water poverty in the village of Lampong Sheanghah. In the two mostwater poor clusters (Ching Lan, Ching Chong) and the entire village as a whole, improving the percapita income and the accessibility to water resource would lead to a much improved Water PovertyIndex and thus improved livelihoods.International Water Management Institute (IWMI) and the International Development Enterprises(IDE) have successfully implemented a project on ‘Multiple -Use Water Services (MUS)’ in the hillyareas of Nepal- an agro-ecological region of the north-western Himalayas. Findings of this project werediscussed during the NAIP Project meetings and enthused by the relevance and interest of the participantsfrom the northeast region, it was agreed to design and implement a cross-learning program for thestakeholders from the NEH region. Special capacity building program (March 3-6, 2009) implementedin collaboration with IWMI- Nepal, IDE-Nepal and Department of Irrigation of the Governmentof Nepal discussed both theoretical and practical aspects of the Multiple-Use Water Services for thehilly areas. In all 13 participants comprising of farmers, researchers and development officers fromNagaland and Sikkim states of the northeast hill region of India participated in the program organisedat Kathmandu, Nepal. The next section of the report briefly describes the concept, design, experiencesand suitable policies for implementation of the Multiple-Use Water Sevices in the hilly areas.4. Multiple-Use Water Services for the Hilly AreasMultiple Use Water Services (MUS) is a participatory, integrated, and povery reduction focussedapproach which takes people’s multiple water needs as starting point for providing integrated services.MUS is a strategy to move beyond sectoral barriers of the domestic and productive sectors andprovide for all water needs in a community (Mikhail et al; 2008). In the middle hills of Himalayas,bari is the most prevalent land type close to the homesteads and can be easily used for crops likevegetables that require protection. Despite a lack of access to canal or well irrigation, it has greatpotential for increased crop production with micro/ precision irrigation as the technology requiressmall amounts of water and can be applied on sloping lands without any danger of soil erosion.Therefore the productive portion of multiple-use water sevices can take the form of micro-irrigationof vegetables on bari land close to the homestead. Further, as rivers and streams are difficult andexpensive to access, spring water (base flow component) has become the preferred source of domesticwater for most villages (including Lampong Sheanghah and Longwa- the study villages in Nagaland26
<strong>WATER</strong> <strong>POVERTY</strong> <strong>IN</strong> <strong>THE</strong> NOR<strong>THE</strong>ASTERN <strong>HILL</strong> <strong>REGION</strong> (<strong>IN</strong>DIA): POTENTIAL ALLEVIATION THROUGH MULTIPLE-USE <strong>WATER</strong> SYSTEMSand other parts of NEH region). Domestic uses include drinking, cooking, bathing, cleaning andsanitation and meeting livestock water needs and for any additional enterprise water needs. Thisforms the consumptive component of the multiple-use water services and the families (especiallywomen) attach higher importance to this component as it greatly reduces the drudgery and improveswater availability at the household level.Most irrigation water in the middle hills comes from small rainfed streams and rivulets which have veryhigh discharge during rainy season and may have little or no water during pre-monsoon dry season.However, many households, and often entire village communities, have no access to irrigation and areprimarily dependent on rainfall for their crops. The rainfall analysis for the NEH states in India showsthat rain occurs mainly only during two quarters (March- May and June-August) with the third quarter(September-November) receiving scanty rainfall and fourth quarter (December- February) receivinglittle or no rainfall (Table 6). As such no crop cultivation is possible during this non-rainy period withoutan assured water resource. Additionally, domestic supplies shall also be severly constrained during thisperiod. All households in the villages generally have livestock including pigs, cattle and poultry mostlyfor meat purposes. Livestock watering is considerd part of the domestic water allocation and whendomestic supplies are reduced, livestock water needs will be hardly met. People adopt different copingstrategies to tide over the scarcity situations.Multiple-Use Water Services is one such innovative technology and practice with potential to meet bothproductive and consumptive water needs of the the farmers in the hilly areas (van Koppen et al., 2009).This has been successfully demonstrated and adopted in the adjoining hills in Nepal and appears a verysuccessful model for the northeastern hill states.Table 6. Percent distribution of rainfall in different states of north-eastern region, IndiaPeriod(quarter)Asom(Guwahati)ArunachalPradesh(Basar)Manipur(Imphal)Meghalaya(Barapani)Mizoram(Kolasib)Nagaland(Jharnapani)Tripura(Lembucherra)Sikkim(Gangtok)December-February2.7 7.6 19.6 0.6 2.3 5.8 3.8 6.0March-May22.0 28.4 30.6 30.0 20.9 26.2 37.7 22.0June-August54.9 44.9 43.4 29.0 58.7 53.2 43.0 40.0September-November20.3 19.1 7.0 40.4 18.7 14.8 15.5 32.0Total rainfall(mm)2,416 2,125 2,170 2,459 1,139 1,294 1,588 3,06727
<strong>WATER</strong> <strong>POVERTY</strong> <strong>IN</strong> <strong>THE</strong> NOR<strong>THE</strong>ASTERN <strong>HILL</strong> <strong>REGION</strong> (<strong>IN</strong>DIA): POTENTIAL ALLEVIATION THROUGH MULTIPLE-USE <strong>WATER</strong> SYSTEMS4.1. Development of Multiple-Use Water Schemes in Nepal HillsIn order to address the household water need for production and domestic use, InternationalDevelopment Enterprises (IDE), with some modifications to the conventional piped water systemsfor the hilly villages, designed a new scheme. The scheme includes one storage tank (Thai Jar) ofabout 3,000 liters for drinking water and the overflow from this tank is collected in an undergroundtank of about 10,000 liters for irrigation through off-takes at farmer’s field. The design was testedin 2001 in Palpa (Nepal) and was introduced to other IDE implemented projects as well, whichwas known as ‘hybrid’ system which now is known as multiple-use water schemes (MUS) in thehills of Nepal. One of the primary objectives of the introduction of new technology was to increasehousehold income through sale of the surplus agricultural produce in the market. The project laidemphasis on encouraging households in the community to produce cash crop, mainly the vegetables.Since vegetables are perishable items, the market linkage along with collection centres was importantin development of this technology. The goal of the MUS Project is to explore ways to improve poorpeople’s livelihood, reduce unpaid workloads, alleviate poverty and enhance gender equity throughmore productive use of small-scale water supplies in hill districts of Nepal (Adhikary 2009). Theworks carried out under the project show that these small-scale schemes have several advantages (Pantet al 2006):i.ii.iii.iv.v.vi.Cost effective in supplying water to remote areas.Flexibility in its adoption in different locations.Water supply both for household use and for micro-irrigation of high value crops.Adopted technologies are suitable for the difficult terrain of hilly regions.Low construction and maintenance costs and relatively short construction period (less than 3months on an average)Low pay back period (less than 2 years) with low per household investments.vii. Reduced drudgery for women and children for water collection.viii. Improved sanitation and hygiene practices.ix.x.xi.Reduced need for expensive storage tanks.Significant financial incentives for farmers to install and maintain due to income from high valuecash crops.High level of community participation in scheme constructioon and operation and maintenance.In addition, there are significant benefits from household water supplies, which reduce drudgery andunproductive use of household labor, particularly of women and children, and improved public health.The project has also developed guidelines illustrating the process for MUS implementation based on a5-year experience (Mikhail and Yoder, 2009).28
<strong>WATER</strong> <strong>POVERTY</strong> <strong>IN</strong> <strong>THE</strong> NOR<strong>THE</strong>ASTERN <strong>HILL</strong> <strong>REGION</strong> (<strong>IN</strong>DIA): POTENTIAL ALLEVIATION THROUGH MULTIPLE-USE <strong>WATER</strong> SYSTEMS4.1.2. Growth of Multiple-Use Water Schemes(MUS)A look at the expansion rate of the MUS (Figure 7) shows encouraging trend. Within a period of 5 years(2003-2008), the number of MUS projects has increased to 122 which shows its popularity in the hillyareas. The growing demand of MUS is also indicative of suitability of its adoption in different locations,which are not identical to each other in terms of geographical condition, socio-economic composition,market linkages and outside support. The rapid growth of MUS was possible also due to the partnershipdeveloped between government agencies, local elected institutions (Village Development Council), andprivate parties. However, the combination of partnership developed in each of the sites varies accordingto their effectiveness in various places.4.2. Design of Multiple-Use Water SchemesIn principle, MUS are designed to cover 10 to 40 households but in some cases up to 80 households havebeen provided service from MUS. This largely depends on the number of households to be served and theavailability of water. Design of the MUS accords first priority for the supply of water for domestic use.This is in conformity with the government water policy on water resource development which alsoassigns first priority to the drinking water followed by agricultural use (Water Resources Strategyof Nepal 2002; National Water Policy of India, 2007). The design criteria of MUS assumes 45liter/person/day for domestic use and 400-600 liter/household for productive use (Sharma andColavito, 2009). There can be a number of MUS designs depending on the type of water source,community water needs, water quality and desirable/ available technologies. Examples include:i.ii.Spring water distributed by gravity systemStream/ river water supply after treatmentNumber of MUS in Nepal hills353025292920151016131814No. of MUS503before20032003-042004-052005-062006-072007-082008-09Figure 7: Trends of MUS growth in Nepal hill districts(Source: Kailash Sharma, IDE/Nepal)29
<strong>WATER</strong> <strong>POVERTY</strong> <strong>IN</strong> <strong>THE</strong> NOR<strong>THE</strong>ASTERN <strong>HILL</strong> <strong>REGION</strong> (<strong>IN</strong>DIA): POTENTIAL ALLEVIATION THROUGH MULTIPLE-USE <strong>WATER</strong> SYSTEMSiii.iv.Ground water/ lake water lifting and distributionRain water collection and distributionBased on the experiences in Nepal hills, it was found that gravity-fed piped MUS systems were highlyuseful and effective in meeting the community water requirements. MUS systems can have varyingdesigns, depending on the productive use needs of the community. However, most of the systems tapspring sources and use gravity to pipe the water to a domestic water tank which overflows into anirrigation tank, using two separate distribution lines for domestic and productive water provision. Thisdesign puts the first priority for meeting the domestic and livestock water needs. When water is scarce,adding on-farm storage is an option. There are two major designs: Single Tank Distribution System andDouble Tank Distribution System. Therefore, whether to design a single storage tank or the two storagetank is decided by the technicians in consultation with the users in the community, who know if the wateravailability is perennial or seasonal. In case of perennial source of irrigation, the users prefer single tankstorage, as it reduces the costs but in locations where there are seasonal variations in water availability,two tanks storage with two separate pipe lines for the domestic and productive use are preferred by theusers. In most of the cases the farmers prefer two tank storages in order to:i.ii.iii.Have assured supply of water for household use.Avoid the conflicting interest for domestic and productive water use during lean season.Avoid conflict among users as a result of reduced availability of water.Selection of the suitable design mainly depends on the discharge of the water source and the length ofthe pipe network required. Features of both the systems are given below:Single Tank Distribution SystemOne storage reservoir connected to a tank at eachhouseholdSingle pipeline distributionWater used for multiple needs from household tanksHousehold water tank filled on a turn-by-turn basisGood for abundant water source scenarioTwo Tank Distribution SystemTwo reservoirs in each villageDomestic use has priority over irrigation because domesticwater overflows into the productive water tankDouble pipe line for distributionShared tapstand and offtakes for domestic and productive usesSuitable for moderately good water source scenarioIt has been observed during the field visit that farmers scheduled the water distribution for domestic andproductive use by rationing water supply for 2-3 hours for domestic use when availability is low. Thesaved water thus was used for productive use.Further depending upon the amount of water available at the source (scarce, moderate, abundant), threetypes of MUS can be constructed:i. Type A: Continuous Flow System : This type of MUS is built when the safe water discharge at thewater source is more than 1.5 times the projected water demand. Water is supplied throughout the30
<strong>WATER</strong> <strong>POVERTY</strong> <strong>IN</strong> <strong>THE</strong> NOR<strong>THE</strong>ASTERN <strong>HILL</strong> <strong>REGION</strong> (<strong>IN</strong>DIA): POTENTIAL ALLEVIATION THROUGH MULTIPLE-USE <strong>WATER</strong> SYSTEMSday from the tap stands without regulating the flow in the main tank. However, this type of systemis recommended only when the number of households is less than 40 and/ or the pipe network ismore than 4 km long.ii. Type B: Seasonally Controlled System: This design is most suitable when discharge of the water sourceis not adequate to meet the design demand throughout the year. The design has two separate watertanks- one for domestic use and the other for productive use. Water from the source is first suppliedto the domestic water tank and once this is filled, the surplus water will be directed to the productivewater tank in the vicinity. Tap stands are located in between the house clusters to serve domesticdemand. On the other hand off-takes are constructed approximately at the centre of the irrigationfield of few land owners (average 3-6 households). Water distribution is controlled from the outletsof two main tanks, depending on the water availability during different seasons of the year. Although,this design is relatively costly due to two tanks and the distribution systems, the design removes thepotential conflict between domestic and productive uses by prioritising domestic use. This is themost common design built in the Nepal hills and shall be equally suitable for the villages in theNortheast hill states of India.iii. Type C: Year-round Controlled System: In case the water source is just enough to meet the designdemand, Type C shall be a good choice. This system is similar to continuous flow system interms of the single main tank and pipe network, however in addition, each household has asmall storage tank at its premises. Based on a community developed schedule, household tanksare filled on a turn-by-turn basis.4.3. Planning and Implementation ProcessThe entire MUS process is carried out in the following four phases:i. Phase I: Pre-Construction Planning: This process includes all the activities from initiation toapproval of the scheme. The main activities are the feasibility study, survey, design, systemcosting and formation of a Water User Association (WUA). By the end of this phase a formalagreement is made among the stakeholders. The most critical activities include communityparticipation in the plan development, readiness for the adoption of micro-irrigationtechnologies and establishment of a water tariff. The community needs to be sufficientlymobilised to take a pro-active role.ii.Phase II: Construction Phase: This phase begins with the collection and procurement of constructionmaterials. Lines and levels are provided with for the pipelines and structures. The conveyancepipeline is first constructed followed by tank construction and the distribution pipelines. Finally,the tap stands and off-takes are built. After completion of all construction, testing is carried out.If the test results are found to be satisfactory, backfilling is done for the pipeline and structures.iii. Phase-III : Post-Construction Phase: After successful construction and testing of the scheme, ameeting of the Water Users Association is convened for review of the progress and nominationof the Scheme Operator and Caretaker. Operator is provided with practical training on systemoperation and maangement. Similarly, caretaker takes care of the inventory and proper upkeep of31
<strong>WATER</strong> <strong>POVERTY</strong> <strong>IN</strong> <strong>THE</strong> NOR<strong>THE</strong>ASTERN <strong>HILL</strong> <strong>REGION</strong> (<strong>IN</strong>DIA): POTENTIAL ALLEVIATION THROUGH MULTIPLE-USE <strong>WATER</strong> SYSTEMSthe system components. A project completion report is prepared at the end of the constructionphase. During an inaugural function the detailed report of the scheme implementation processis presented.iv.Phase-IV: Performance Evaluation: Periodic evaluation on the performance of the system are donewithin a few years of scheme completion. Evaluation is carried out both internally and externally.The WUA may conduct the internal evaluation while an outside funding/ donor agency mayconduct the external evaluation. It is recommended that WUA may be provided with someseed money to take care of any initial bottleneck and then it may become self-supporting andfinancially independent.4.4. The System ComponentsAs discussed earlier, the main components of the system include: (i) water storage system (water tanks),(ii) water conveyance and distribution system (pipes and stand posts), and (iii) water application system(low cost drip or micro-sprinkler system). In this section, we explain the special design characteristics ofthe storage and application systems.4.4.1. Low Cost Water Tank Technology: The Modified Thai Jar and Ferro Cement Lining DesignsCollection and storage of water while it is available and its use for dry season irrigation can give poor smallholdersa good opportunity to generate a cash income through the production and sales of high value cash cropsand livestock products. The traditional water ponds have high losses due to seepage and evaporation besidescontamination with dust and open access to animals. Modern plastic tanks and cement tanks are generallyexpensive and have small service life due to cracks, leakages etc. Based on a considerable research and fieldexperience, the following three models (Table 7) were found quite suitable for adoption in the hilly areas.Out of these storage structures, Modified Thai Jars for domestic water supplies unit and ferro-cementlined tanks for irrigation water supplies are very common. Modified Thai jars (Figure 8) have severaladvantages, including;(i)Can be constructed in various capacities (1,000 l; 1,500 l; 3,000 l).(ii) These are cheaper than commercial plastic and masonary tanks.(iii) Locally trained masons can construct these in in 3-5 days.(iv) Jars can be built above ground at a common site or partially buried at the site.(v)Jars can be used to store water from any source for multiple applications and suitable for storageof drinking water.Ferro-cement tanks are generally of larger capacity and are generally buried up to the surface with a smallboundary embankment. These tanks are generally covered with sheets for protection from animals andmisuse. These designs are also cheaper than commercial plastic and masonary tanks, simple to construct in7-10 days with assistance of locally trained mason, robust and easy to maintain and capable of withstandingminor land settlements and tremors. The material requirements for construction of various sizes of thetanks and the approximate cost are given at Annexure-II.32
<strong>WATER</strong> <strong>POVERTY</strong> <strong>IN</strong> <strong>THE</strong> NOR<strong>THE</strong>ASTERN <strong>HILL</strong> <strong>REGION</strong> (<strong>IN</strong>DIA): POTENTIAL ALLEVIATION THROUGH MULTIPLE-USE <strong>WATER</strong> SYSTEMSFigure 8: Modified Thai Jars and Ferrocement lined tanks for water storage under the MUS projects.Table 7: Basic information on low cost water storage tanks in the hilly areasTank type Storage volume Shape Approx. Cost (US $),2009 priceCement Mortar JarType A: 500 literType B: 1,000 litreJar US$ 25US$40Modified Thai JarType A: 1,500 literType B: 3,000 litreJar with narrow neckUS$56US$75Ferrocement Lined tankType A: 6,000 literType B: 10,000 litreRectangularUS$95US$1754.4.2. Low-cost Drip Irrigation SystemsThe conventional drip systems are suitable for most vegetable, horticultural and other high value cropsbut generally are cost and technology intensive and do not find favor with small-holder farmers whohave tiny plot sizes located in remote areas. Financially affordable simple and low cost drip irrigationkits appropriate for small land holdings are now available. The main features of these low-cost dripirrigation kits include:i.ii.Low-cost: About 3-5 times cheaper than conventional drip system.Simple: Components are easy to understand, assemble and operate.33
<strong>WATER</strong> <strong>POVERTY</strong> <strong>IN</strong> <strong>THE</strong> NOR<strong>THE</strong>ASTERN <strong>HILL</strong> <strong>REGION</strong> (<strong>IN</strong>DIA): POTENTIAL ALLEVIATION THROUGH MULTIPLE-USE <strong>WATER</strong> SYSTEMSiii.iv.Divisible: Available for vey small plot sizes.Low pay-back period: Normally the cost may be recovered in a single growing season.The simple drip system has three main components: (i) control head, (ii) pipe network, and (iii)fittings and emitters (Fig. 9). Operating head is provided by water pressure through the water storedin small tank put at 1.0–1.5 m height. Main technical features of the simple drip system are givenin Table 8.Simple Drip SystemFigure 9: Low-cost drip irrigation system as part of the MUSTable 8: Main technical features of a simple low-cost drip irrigation kitParameterSpecificationOperating head (Water pressure)1.0 m to 1.5 m heightStandard sizes (Irrigation coverage) Five sizes: 90 m 2, 125 m 2, 250 m 2 , 500 m 2 ; 1,000 m 2Emitter discharge2.1 to 2.4 litres/ second, depending on size of the systemDistribution uniformity Above 80%Materials usedMaximum length of lateralsDiameter of pipeHead tank : 50 to 100 litre HDPE circular tankPipes: Soft PVC with pure granulesFittings: HDPE pure and recycled material12 mMain pipe: 12 mm outside diameterLateral: 8 mm outside diameterThe main components of the system include: head tank, outlet set, mainline set, drip-pipe set and thefilters. Step-wise simple installation of the system may include the following:i.Select land and prepare crop bed: Normally the selected plot may have a size of 12m x7m dividedinto four strips of 12m x1.5m, preferably on a flat leveled land. But the system shall work on asloping land as well. Prepare the soil well for planting the seedlings.34
<strong>WATER</strong> <strong>POVERTY</strong> <strong>IN</strong> <strong>THE</strong> NOR<strong>THE</strong>ASTERN <strong>HILL</strong> <strong>REGION</strong> (<strong>IN</strong>DIA): POTENTIAL ALLEVIATION THROUGH MULTIPLE-USE <strong>WATER</strong> SYSTEMSii.iii.iv.v.vi.Erect a head structure: This is required for placing the small water storage tank. This canbe a simple table-like structure made with locally- available wood or bamboo. The headstructure must be between 0.75 m to 1.0 m above the ground and robust to take the load.Fix the outlet and filters: Fix the water outlet through the hole in the tank and put the filteringjoints securely and properly.Join mainline pipe with the outlet: Set the tank on the platform and attach vertical mainline ontothe outlet tap. Lay the horizontal mainline on one edge of the plot such that the “Ts” and “Ls”are close to the middle of each bed.Connect lateral pipes (drip pipes) with the mainline: Unroll the drip lines and connect open endof all 4 lateral drip lines with the previously attached “Ts” and “Ls”. Use the pegs to fix both endsof each lateral dripline, keeping the pipe straight.Pour the water into the head tank and mark the planting spots: With a closed gate valve, fill in the tankwith water. Check for any leakages and open the gate valve and ensure all the drippers are functioning.Let the system run for five minutes and mark the wet spots for transplanting the seedlings.For proper and trouble free operation ensure that drip pipes are correctly laid and baffl es are close to thepoints, there is no debris or dirt in the fi lters, and fi ttings are tight to prevent any leakages. With the gatevalve closed, fi ll the tank with water near the top. Open the gate valve to irrigate.It is recommended to put up a fence around the crop field to prevent damage and theft and keep away thestray animals. Irrigation requirements shall vary with the season and crop. It is recommended to irrigatedaily in the first month of the growing season and may be extended to up to 3 days at later stages.Small systems create large benefits in the hills(Photo Credit: Department of Irrigation, Kathmandu)35
<strong>WATER</strong> <strong>POVERTY</strong> <strong>IN</strong> <strong>THE</strong> NOR<strong>THE</strong>ASTERN <strong>HILL</strong> <strong>REGION</strong> (<strong>IN</strong>DIA): POTENTIAL ALLEVIATION THROUGH MULTIPLE-USE <strong>WATER</strong> SYSTEMSFor closely spaced crops low cost mini-/ micro-sprinklers are available in a pre-assembled form withmainline sub-set and a riser sub-set.4.5. Cost and Income of Multiple-Use Water SystemsDue to different designs and village/cluster sizes, distance from the source, and other factors, the cost of thesystem may vary considerably. However, when looking at the whole range of the projects, the average costof the system is around US$ 100 per household considering both cash and non-cash payments. Further byfactoring in all the hardware and software costs (agriculture intervention and support staff costs), the totalcost in the hilly areas may vary from US$ 196 to US$ 226 per household (Mikhail and Yoder, 2009).Most of the farmers adopting multiple-use water systems focus on cultivation of vegetables andhigh- value crops. They use rain-fed land that has very marginal crop yields for cereal crops withoutirrigation and utilise very small plots of land and were not marketing any surplus produce. Thesurveys conducted in Nepal hills showed that MUS households on an average earned additionalannual income of US$ 190, which means that pay back period for the system was only 1 year andis very attractive. Households also consume about 10-15% of the increased production for homeconsumption improving health and nutrition.Assured water with good agronomy and markets works wonders even under most challenging situationsPhoto credit: ICAR Complex for NEH, Sikkim Centre36
<strong>WATER</strong> <strong>POVERTY</strong> <strong>IN</strong> <strong>THE</strong> NOR<strong>THE</strong>ASTERN <strong>HILL</strong> <strong>REGION</strong> (<strong>IN</strong>DIA): POTENTIAL ALLEVIATION THROUGH MULTIPLE-USE <strong>WATER</strong> SYSTEMSThe full returns of MUS require a complementary development program. Smallholderfarmers are the most efficient high-value crop producers when they have access to appropriatetechnology and inputs, knowledge, and market channels. This can be achieved through welllocated and functional collection centres run by enterprenures and cooperatives. MUS are acritical part of any high-value agriculture strategy. The system enables the density of adoptionof micro-irrigation and high-value crop production that creates volumes needed to establishlocal collection centers and sufficient market for the establishment of local input and serviceproviders.4.6. Women EmpowermentWomen are the prime focus groups of all the multiple water-use related project activities. Uponadoption of the MUS, the roles of women change and their decision making both inside andoutside the households improves significantly. Their involvement in key positions of MUS usercommittees empowers women to lead committees and link with other agencies. The additionalincome they earn from sale of vegetables and other produce provides financial independence andenhances financial decision making. MUS also reduces women’s workload by decreasing the timeneeded to collect water (free labor), a task typically assigned to women and children. HouseholdMeeting the important domestic water needs is an integral component of the MUS.Removal of drudgery makes the women happy and confident.Photo credit: IDE, Nepal37
<strong>WATER</strong> <strong>POVERTY</strong> <strong>IN</strong> <strong>THE</strong> NOR<strong>THE</strong>ASTERN <strong>HILL</strong> <strong>REGION</strong> (<strong>IN</strong>DIA): POTENTIAL ALLEVIATION THROUGH MULTIPLE-USE <strong>WATER</strong> SYSTEMSvegetable consumption is increased and provides better nutrition for women and children, savingmedical expenses.4.7. Lessons LearntMultiple-use water systems shall be better designed and implemented when both supply side institutions(research and development organisations, state agencies, village development committeess) anddemand side institutions (farmers committee, MUS users’ group, NGO and local chief) understandand perform their role in a harmonious manner. The expected roles of supply side and demand sideinstitutions are given below:Roles of the institutionsSupply side• Situation analysis, constraint and opportunityidentification• Objective and target setting• Program/ project identification• Resource use planning and funding• Implementation, interaction• Monitoring and evaluation• Policy advocacy and formulationDemand side• Community mobilisation• Generation of community resources• Securing local support• Estabilishing backward (input supplies) and forward(output marketing) linkages• Ownership takeover and sustaining the systemImplementation of a large number of MUS programs provide the following important lessons for itssuccessful adoption in the NEH region:i.The MUS technologiesThe most innovative part of the technology was to facilitate productive utilization of locally availablesmall water sources in the hills- the springs and rivulets. The communities were positive as theycould access to water for multiple needs from a single system. The conventional systems generallydo not have such a provision. Beside, the construction of conventional system is expensive, timeconsuming and requires higher skills and capital investment. Construction of MUS system ina short period of time at an affordable cost was positively taken by the farmers. Major factor inthe introduction of technology was to convince the users’ and concerned stakholders’ to makecollaborative investment and not just the government subsidy. Further, the establishment ofmarketing linkages for sale of surplus produce was an important factor for the initial success andsustainability of MUS.ii.Time saving and reduced drudgeryOne of the significant benefit reported from these studies are the time saving and reduction indrudgery for women and children who travel long distances to provide water for the household.The time saving was significant as it used to be between 22- 30 minute per trip across the locations.The involvement of women in vegetable production and marketing has increased their confidence38
<strong>WATER</strong> <strong>POVERTY</strong> <strong>IN</strong> <strong>THE</strong> NOR<strong>THE</strong>ASTERN <strong>HILL</strong> <strong>REGION</strong> (<strong>IN</strong>DIA): POTENTIAL ALLEVIATION THROUGH MULTIPLE-USE <strong>WATER</strong> SYSTEMSlevel to put their ideas and problems to others. Also, it was reported that there has been increasedconsultation between men and women in carrying out farm activities in the recent years as comparedto past traditions.iii.Increase in household incomeMUS technology encouraged the farmers for productive activities enabling them to earn cash incomewhich was an added incentive to the household (especially women). Households who had used MUS formore than one year have reported income from vegetables, which were important for food sufficiencyand security, increased nutrient intake and thus improved family health and living standard besidesfulfilling household’s cash need especially for paying children’s school fee and other necessities. It wasreported that production of vegetable seeds fetched higher prices compared to fresh vegetables. Thiswas important for places where the market linkages are weak. The availability of fresh green vegetablethrough out the year has also contributed for household nutrition. It was reported that 10 to 15 % ofthe produce is consumed at the household.iv.Improved hygiene and sanitationThe studies have shown that the available water was of acceptable quality for drinking, as most ofthe schemes used to tap spring water. With the availability of the water, most of the participatinghouseholds constructed toilets thereby encouraging them for better and improved sanitation andhygiene at the household. However, this was not part of the MUS program. Therefore, the studiespointed towards including it under MUS development program.v.Community participationThe project emphasized on community participation both in terms of their direct participation –contributing in kind and cash - and indirect participation has strengthened the community organization.However, adoption was greater with the presence of an NGO or progressive farmers who lead theprocess of initiation, transfer and spread of these innovations. The homogeneity of the communitywith similar socio-economic characteristics had positive effect in adoption of technology. Some of thesecommunity organizations have expanded their activities e.g establishment of the collection centres forthe benefit of the users. This has enabled the users to fetch higher prices for their vegetables and hasalso strengthened community bond. These orgnisations have also been important for the operationand maintenance of the project.Some of the limitations or the constraining factors for the expansion of benefit from the MUShighlighted by these studies are:i.Availability of water sourceLocation of a suitable and reliable source of water which may adequately meet the water demands ofthe village community was the most constraining factor limiting the expansion of MUS technologyto cover greater number of household and the villages. The availability of the resource is the mostcritical starting point for implementation of the Project.39
<strong>WATER</strong> <strong>POVERTY</strong> <strong>IN</strong> <strong>THE</strong> NOR<strong>THE</strong>ASTERN <strong>HILL</strong> <strong>REGION</strong> (<strong>IN</strong>DIA): POTENTIAL ALLEVIATION THROUGH MULTIPLE-USE <strong>WATER</strong> SYSTEMSii.Non inclusion of certain householdsSome of the households for various reasons could not be included in the MUS program. The reasonswere landlessness and single headed households beside some of the households who were not initiallyconvinced of the benefits of the project.iii.Technological problemsSome of the farmers reported problem relating to the drip kit itself such as clogging of holes,breakage of pipe-fitting and low tank capacity etc. Also, farmers who wanted to expand the areafelt that the tank had inadequate capacity. But from the equity perspective, allowing expansion ofarea by some of the farmers would have affected other users. However, these issues can be resolvedwith proper capacity building and quality control of the material.5. ConclusionIn the water abundant northeastern region of India, the societal water use is less than 5 per cent of theexisting potential and vast water resources of the region remain unutilised for economic activities. Theunutilised and excessive water supplies create vast devastation and miseries during the rainy seasonand the households face acute water shortages for both consumptive (domestic, livestock, enterprise)and productive purposes during post-rainy season periods. Though majority of the population is stilldependent on agriculture, the region generally practices very low yielding rainfed monocropping orthe more destructive shifting (Jhum) cultivation. The ratio of percent irrigated area to net sown areafor the NE region as a whole is abysmally low at 10.6%. This leads to poor crop yields, low croppingintensity and little incentive for diversified or high value agriculture. Among other things, assuredwater supply, though for a limited area (homestead gardens, bari) is a pre-requisite for moving up thevalue chain and sustainable livelihoods.Water poverty mapping based on household surveys in a typical village in Mon district(Nagaland) showed that all the households fared very poorly in terms of the most componentsof Water Poverty Index (WPI): Water Use (0.15), Water Resource (0.38), Water Access (0.40)and Capacity (0.40) with an overall value of 0.44. ‘Access’ and ‘Capacity’ are the two majorfactors contributing to water poverty in the study village and applicable to similar othervillages in Nagaland and the NEH region. This was also reflected through low levels of incomeand high prevalence (44% of households) of malaria, tuberculosis and other water-bornediseases. The villages still practice traditional Jhum cultivation with very low yields of rice andmillets and ever-shortening period of Jhum-cycle. Alternative to this practice has been amplydemonstrated through excellent demonstrations of improved crops,varieties and practices atthe ICAR Livelihood Improvement Project site. But the community immediately needs simple,small, low-cost and relatively high-value agriculture models which can provide for the basicwater needs and also improve their incomes.Improving the accessibility to water resourcesand per capita income would significantly reduce the water poverty and thus improve thelivelihoods.40
<strong>WATER</strong> <strong>POVERTY</strong> <strong>IN</strong> <strong>THE</strong> NOR<strong>THE</strong>ASTERN <strong>HILL</strong> <strong>REGION</strong> (<strong>IN</strong>DIA): POTENTIAL ALLEVIATION THROUGH MULTIPLE-USE <strong>WATER</strong> SYSTEMSMultiple-Use Water Systems developed and implemented successfully in the similar agroecologicalhill regions of Nepal are cost-effective, flexible, provide water supply both for householdneeds and micro-irrigation for small high-value agriculture plots (homestead gardens), haslow pay-back period with low household investments. More importantly, these systems reducedrudgery for women, improve sanitation and hygiene, provide significant financial incentivesand ensure high-levels of community participation. The most innovative part of the technologywas to facilitate productive utilisation of locally available small water soucres in the hills- thesprings and rivulets through a water storage system (low-cost water tanks), water conveyanceand optimally placed distribution system and a simple and small water application system. Eachsystem is normally designed to meet water needs of 10 to 40 households with an all inclusive costof about US$ 200 per household . With additional annual income of about US$ 190 throughsale of surplus produce the system has a pay back period of only 1 year and is very attractive.The market linkage along with collection centers for the surplus produce was important in thedevelopment of the technology. The only constraining factors were the availability of an adequateand reliable water source in the village neighbourhood and certain technological problems in theinitial period which can be resolved through proper capacity building of the farmers and schemefunctionaries.The suggested Multiple-Use Water Systems is quite appropriate to the high rainfall hilly states of thenortheast hill region. The present and new drinking water supply schemes in these regions need to bedesigned more innovatively on the suggested pattern by integration of public health, irrigation andagriculture development schemes . The success of the schemes shall greatly depend upon the motivationand participation of the village communities for which the local NGOs, government functionaries,village chiefs and village level institutions shall play an important role. The suggested model has a greatpotential in reducing the water poverty, saving time and reducing drudgery, increase household income,improve hygiene and sanitation, empower women, ensure community participation and thus improvethe livelihoods of poor households in the north-eastern and other hill region states of India and elsewherethrough improved use of the water and land resources of the region.6. ReferencesAdhikary, D.L. 2009. Background of the micro-irrigation and MUS development in Nepal. SpecialTraining Program on “ Multiple Water Use Systems for the Hilly Areas”, (3-5 March, 2009),International Water Management Institute, Kathmandu, Nepal.Agarwal, A.; Narain, S. 1997. Dying Wisdom- Rise, fall and potential of India’s traditional waterharvesting systems. Centre for Science and Environment, New Delhi. pp. 54-70.Cullis, J., Gorgens, A. 2006. Water poverty mapping as a tool for the effective allocation of resource toaddress water poverty in South Africa. Paper presented at WISA Biennial Conference and Exhibition,Durban, South Africa, 2006.Goswami, D.C. 1992. Zonal planning in water. In. Planning perspectives for the north-eastern andeastern zone, Adiseshiah, M.S. (ed), Lancer Publishers Pvt. Ltd., New Delhi, pp. 9-22.41
<strong>WATER</strong> <strong>POVERTY</strong> <strong>IN</strong> <strong>THE</strong> NOR<strong>THE</strong>ASTERN <strong>HILL</strong> <strong>REGION</strong> (<strong>IN</strong>DIA): POTENTIAL ALLEVIATION THROUGH MULTIPLE-USE <strong>WATER</strong> SYSTEMSGoswami, D.C. 2002. Flood forecasting in the Brahmaputra River, India: A case study. In. RegionalCooperation for Flood Disaster Mitigation in the Hindukush Himalayas, Chalise, S.R and Shreshtha,M. (Eds.), ICIMOD. Internal Report, 2002. pp. 40-48.Goswami, D.C.; Das, P.J. 2003. The Brahmaputra River, India: the eco-hydrological context of water usein one of world’s most unique river systems, Ecologist Asia (Special issue on Large dams in north-eastIndia: rivers, forests, people and power), 11(1): 9-14.Sharma, K.; Colavito, L. 2009. Experience of Multiple Use Water Services (MUS) Implementation inNepal. Paper presented at IWMI-NAIP Training Programme on Multiple Water Use Systems (MUS)in the Hilly Areas. Kathmandu, Nepal (March 3-5, 2009).Lawrence, P.; Meigh, J., Sullivan, C. 2002. The water poverty index: An international comparison. KeeleEconomics Research Paper 19. Keele, Staffordshire, UK: Department of Economics, Keele University.Mikhail, M.; Yoder, R. 2009. Multiple-Use water Service Implementation in Nepal and India: Experiencesand Lessons for Scale-Up. International Development Enterprises/ Challenge Program on Water andFood/ International Water Management Institute, Colombo, Sri Lanka. Pp. 345.Mishra, A. K.., Satapathy, K.K. 2003. Food security vis-à-vis natural resources sustainability innortheastern region of India. ENVIS Bulletin: Himalayan Ecology, 11 (1), G B Pant Institute ofHimalayan Environment and Development, Kosi-Katarmal, Almora, India. (available at: http://gbpihed.nic.in/envis/HTML/vol11_1/akmishra.htm)Pandey, N.D. 2009. Policy environment of Non-conventional Irrigation Technology in Nepal. Paperpresented at IWMI-NAIP Training Programme on Multiple Water Use Systems (MUS) in the HillyAreas, Kathmandu, Nepal (March 3-5, 2009).Pant, D.; Gautam, K.R. ; Shakya, S.D., Adhikary, D.L. 2006. Multiple Use Schemes: Benefit to theSmallholder. Working Paper 114, International Water Management Institute, Colombo, Sri LankaSamuel, M.P.; Satpathy, K.K. 2008. Concerted rainwater harvesting technologies suitable for hilly agroecosystemof Northeast India, Current Science, 95(9): 1130-1132.Sharma, U.C.1996. Yield sustainability and strategies in northeastern states. Productivity, 36:682-690.Sullivan, C.A. 2005. Method to develop and describe community level water poverty index scores. CEHWallingford, UK: Oxford University Centre for Water Research.v Koppen, B., Smit, S., Moriarty, P., Penning de Vries, F., Mikhail, M., Boelee, E. 2009. Climbing theWater Ladder: Multiple- use Water Services for Poverty Reduction. The Hague, The Netherlands,IRC International Water and Sanitation Centre and International Water Management Institute. (TPSeries No. 52). 213 p.42
<strong>WATER</strong> <strong>POVERTY</strong> <strong>IN</strong> <strong>THE</strong> NOR<strong>THE</strong>ASTERN <strong>HILL</strong> <strong>REGION</strong> (<strong>IN</strong>DIA): POTENTIAL ALLEVIATION THROUGH MULTIPLE-USE <strong>WATER</strong> SYSTEMSMethodology for Constructing Water Poverty Map andWater Poverty Index43Annexure-IFor the construction of the Water Poverty Map, a Water Poverty Index has been constructed which takesinto consideration multiple indicators for estimating water poverty.Mathematical structure of the WPIThe WPI is calculated using a composite index approach similar to the one used for Human DevelopmentIndex (HDI). Various elements measured in different units are aggregated together, and the five keycomponents are combined using the general expression:WPI =∑∑Where, WPI= Water Poverty Index value for a particular location, Xi = component (Resource, Access,Use, Capacity or Environment) and, w = weightThe application of the framework provided by the WPI enables a more consistent approach to decisionmaking, and decisions can be both audited and defended. Depending on the purpose of its use, theWPI can be applied at a range of different scales. To determine the degree of need for water provision,it can be applied at the community level, and at the intermediate and national scales (Sullivan 2005).Here, for the purpose of the current study, the WPI is applied at the household level.Consistent representation of components at each scale facilitates meaningful comparisons, and variablescan be determined by stakeholders according to local needs, WPI structure for that location, and wi isthe weight applied to that component. Each component is made up of a number of sub-components,and these are first combined using the same technique in order to obtain the components. For thecomponents listed above, the equation can be re-written:WPI = wrR + waA + wcC + wuU + weEwhere w r,w a,w c,w uand w eare the relative weighing factors for each key components.Calculating the WPI in this way provides the weighted average of the five components Resources (R),Access (A), Capacity (C), Use (U), and Environment (E). Each of the components is first standardised sothat it falls in the range 0 to 1; thus the resulting WPI value is also between 0 and 1. A low score on theWPI indicates a more extreme case of water poverty. The weight given to the elements w i, represents therelative importance given to each of the them.Calculating indicesScores for each index and sub-index are calculated by the formula:xi − x minxmax−xmin ;where x i, x maxand x minare the original values for household i, for the highest value household, and for thelowest value household, respectively. The index for any one indicator lies between 0 and 100. The aim isto get index values in the range 0 to 100 for each quantity being considered, where 0 is worst, and 100is the best. When these are combined to make a composite index, then each component is on the samebasis (Sullivan 2005).Ni=1Ni=1wiXiwi
<strong>WATER</strong> <strong>POVERTY</strong> <strong>IN</strong> <strong>THE</strong> NOR<strong>THE</strong>ASTERN <strong>HILL</strong> <strong>REGION</strong> (<strong>IN</strong>DIA): POTENTIAL ALLEVIATION THROUGH MULTIPLE-USE <strong>WATER</strong> SYSTEMSLow-Cost Water Storage Structures1. MODIFIED THAI JARTank Components and Cost EstimatesAnnexure-IIComponent UnitRate 1000 liter MTJ 1500 liter MTJ 3000 liter MTJ(NRs) Qty Total Qty Total Qty TotalDIRECT CASH COMPONENTCement Bag 500 2 1000 4 2000 6 3000White cement Kg 20 2 40 3 60 4 807 mm steel rod Kg 54 2 108 3 162 5 2708# Gabion wire Kg 61 1.5 91.5 2 122 4 244Chicken wiremesh m 2 45 1 45 2 90 4 180Binding wire Kg 55 1.5 82.5 2.5 138 4 220Pipe fittings Set 700 1 700 1 700 1 700Filter No. 150 1 150 1 150 1 150Plastic sheet m 2 320 0.35 112 0.55 176 1 320Mason wage NRs/ 500 3 1500 4 2000 7 3500dayJute bags No. 10 8 80 12 120 18 180Tools LS 500 1 500 1 500 1 500SUB TOTAL 4409 6218 9344NON-CASH COMPONENTStone ft 3 22.7 2 45 3 68 4 91Sand ft 3 28.0 14 397 15 425 20 567Gravel ft 3 31.2 3 94 4 125 6 187Unskilled labour NRs/ 200 4 800 4 800 9 1800dayBamboo, rope, LS 125 1 125 1 125 1 125waterSUB TOTAL 1461 1543 2770GRAND TOTAL 5870 7760 12114Note: Above material rates are based on the 2007 Kathmandu market price. Prices mayvary regionally due to transportation costs. (1 us $ = 60 Nepali Rs.)2. FERRO-CEMENT L<strong>IN</strong>ED TANK ** All dimensions in cm44