a comparison of the abiotic characteristics of aquatic and terrestrial ...
a comparison of the abiotic characteristics of aquatic and terrestrial ...
a comparison of the abiotic characteristics of aquatic and terrestrial ...

You also want an ePaper? Increase the reach of your titles
YUMPU automatically turns print PDFs into web optimized ePapers that Google loves.
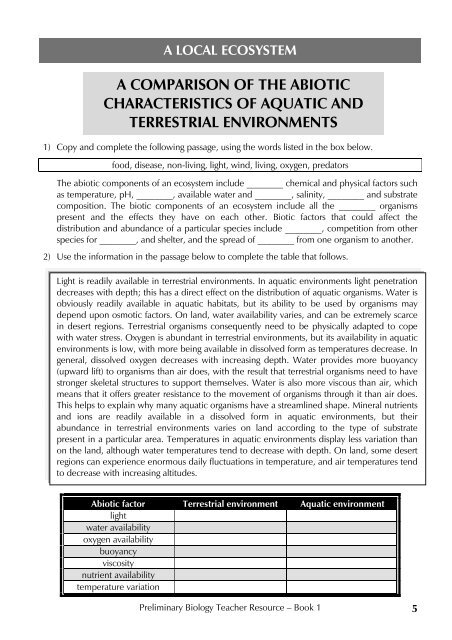
A LOCAL ECOSYSTEMA COMPARISON OF THE ABIOTICCHARACTERISTICS OF AQUATIC ANDTERRESTRIAL ENVIRONMENTSANSWERS1) Copy <strong>and</strong> complete: non-living, light, oxygen, wind, living, predators, food, disease2)Abiotic factor Terrestrial environment Aquatic environmentlightwater availabilityReadily availableVariesLight penetrationdecreases withincreasing depth.Readily available, butaccess may depend onosmotic factors.oxygen availabilitybuoyancyviscositynutrient availabilitytemperature variationReadily availableAir <strong>of</strong>fers little buoyancy, so<strong>terrestrial</strong> organisms mustdevelop structures to support<strong>the</strong>mselves.Air has low viscosity.Varies according to <strong>the</strong>substrate material in aparticular location.A large range <strong>of</strong> temperaturesoccurs on l<strong>and</strong>.Limited availability;amount <strong>of</strong> dissolvedoxygen decreases withdepth <strong>and</strong> increaseswith decreasingtemperature.Water provides a highlevel <strong>of</strong> buoyancy.Water is more viscousthan air, so it is harderto move through.Usually readilyavailable in dissolvedform.Usually experiencefewer fluctuations thanon l<strong>and</strong>.6Preliminary Biology Teacher Resource – Book 1
A LOCAL ECOSYSTEMMEASURING THE ABIOTIC FACTORS INAN ECOSYSTEMIntroductionIn this investigation, you will be measuring some physical <strong>and</strong> chemical properties <strong>of</strong> anecosystem in your local area. Choose a location that is reasonably small <strong>and</strong> easily identifiable asa discrete ecosystem, preferably with a watercourse running through it. Test <strong>the</strong> following <strong>abiotic</strong>features at two different locations (A <strong>and</strong> B) within your ecosystem.Materials neededdata logger (or light meter), cobalt chloride paper, <strong>the</strong>rmometer, universal indicator paper (or pHmeter), metre ruler, anemometer or wind meterMethodi) Moisture – <strong>the</strong> moisture content <strong>of</strong> <strong>the</strong> air or soil can be tested using ei<strong>the</strong>r <strong>the</strong> probe <strong>of</strong> adata logger, or cobalt chloride paper. This paper must be stored over calcium chloride in anairtight container before use. When exposed to moisture, <strong>the</strong> paper will change from blue toa pink or white colour. The time taken for <strong>the</strong> paper to dry out again is a measure <strong>of</strong> <strong>the</strong>moisture present.ii)iii)Light intensity – this can be measured using <strong>the</strong> relevant probe on a data logger or a lightmeter.Acidity – measure <strong>the</strong> acidity <strong>of</strong> any water or soil present at each site. Water can becollected in a test tube <strong>and</strong> tested with <strong>the</strong> appropriate probe on a data logger, or severaldrops <strong>of</strong> universal indicator solution can be added <strong>and</strong> <strong>the</strong> resulting colour checked againsta pH colour chart. Soil can be mixed with water in a test tube <strong>and</strong> tested for pH in a similarmanner to <strong>the</strong> above method, or wet universal indicator paper can be held against soil orrocks.water can be mixed withuniversal indicator solutionin a test tubeiv)Temperature – use ei<strong>the</strong>r a data logger probe or a <strong>the</strong>rmometer to measure air temperatureat each site, <strong>and</strong> allow enough time for <strong>the</strong> instrument to equilibrate with <strong>the</strong> environment.v) Wind exposure – a wind meter or anemometer can be used to determine wind speed ateach site, or a relative scale can be used in which + represents minimum wind exposure,<strong>and</strong> +++++ represents maximum wind exposure.vi)Height <strong>of</strong> plants, depth <strong>of</strong> soil <strong>and</strong> water – a metre ruler can be used to determine <strong>the</strong>average height <strong>of</strong> plant layers <strong>and</strong> depth <strong>of</strong> soil or water at each site.vii) Soil – a 50cm hole can be dug at each site <strong>and</strong> used to draw a soil pr<strong>of</strong>ile. The pr<strong>of</strong>ileshould indicate <strong>the</strong> relative ratio <strong>of</strong> leaf litter to soil grains present.Preliminary Biology Teacher Resource – Book 1 7
MEASURING THE ABIOTIC FACTORS INAN ECOSYSTEM – continuedviii) Percentage cover – estimate <strong>the</strong> percentage covered in each area by water, shrubs, mosses,herbs, trees or leaf litter. This measurement is important, as it can affect aspects <strong>of</strong> <strong>the</strong>microclimate such as light intensity, moisture <strong>and</strong> temperature.ix)Rate <strong>of</strong> water flow – <strong>the</strong> time taken for a stick or o<strong>the</strong>r object to float a certain distance canbe recorded in any watercourse present at each site.x) Turbidity – this is a measure <strong>of</strong> <strong>the</strong> particle content <strong>of</strong> any water present, <strong>and</strong> can bemeasured by collecting water samples from different locations in stoppered test tubes <strong>and</strong>rating <strong>the</strong>m from +++++ (extremely cloudy) to + (clear).Resultsa) Complete <strong>the</strong> result table below for each <strong>abiotic</strong> factor tested.moisturelight intensityaciditytemperaturewind exposureheight <strong>and</strong> depthpercentage cover (recordseparately for shrubs,mosses, trees, herbs, water,leaf litter)rate <strong>of</strong> water flowturbiditySite ASite Bb) Draw a soil pr<strong>of</strong>ile for sites A <strong>and</strong> B on <strong>the</strong> axes provided below.depth(cm)depth(cm)width (cm)SITE Awidth (cm)SITE BConclusionCompare <strong>and</strong> contrast <strong>the</strong> <strong>abiotic</strong> features <strong>of</strong> sites A <strong>and</strong> B in approximately one paragraph.8Preliminary Biology Teacher Resource – Book 1
A LOCAL ECOSYSTEMPOPULATION TRENDS IN ECOSYSTEMSRead <strong>the</strong> following passage <strong>and</strong> <strong>the</strong>n answer <strong>the</strong> questions that follow.Populations <strong>of</strong> a particular species are determined by <strong>the</strong> following factors:i) Biotic factors such as available food, competition from members <strong>of</strong> <strong>the</strong> same or different species,shelter, <strong>the</strong> action <strong>of</strong> predators, parasites or disease.ii) Abiotic factors such as sunlight, temperature, rainfall, wind <strong>and</strong> available minerals in <strong>the</strong> soil.In animal populations, food supply seems to be <strong>the</strong> major factor determining <strong>the</strong> population limitor `carrying capacity’ <strong>of</strong> a particular ecosystem, whereas for plants <strong>the</strong> availability <strong>of</strong> water <strong>and</strong>light are usually <strong>the</strong> main factors determining population sizes.When a species first arrives in an ecosystem, population growth is initially slow, as <strong>the</strong> speciesadjusts to <strong>the</strong> environment <strong>and</strong> establishes reproductive patterns. Once established, growth <strong>of</strong> <strong>the</strong>population <strong>the</strong>n becomes more rapid until environmental factors cause a leveling <strong>of</strong>f in numbers.This equilibrium situation may be represented by a relatively flat curve, usually <strong>the</strong> result <strong>of</strong> moreindividuals competing with each o<strong>the</strong>r for <strong>the</strong> same resources. In cases where cyclic changes(which appear as relatively evenly spaced `waves’ on a growth curve) occur in this part <strong>of</strong> <strong>the</strong>growth curve, this may be due to predator-prey relationships or o<strong>the</strong>r factors that affectpopulation density, such as birth <strong>and</strong> mortality rates. Where sharp, uneven population changesoccur in this part <strong>of</strong> <strong>the</strong> curve, sudden <strong>abiotic</strong> changes such as increased rainfall may be <strong>the</strong>explanation.1) The growth curve below represents changes in an insect population over time.3totalpopulation21Use <strong>the</strong> information in <strong>the</strong> passage to explain <strong>the</strong> shape <strong>of</strong> <strong>the</strong> curve at positions 1, 2 <strong>and</strong> 3.2) A study in Australia found that a locust population followed a similar growth pattern to steps1 <strong>and</strong> 2 in <strong>the</strong> graph above. However, when stage 3 was reached, <strong>the</strong> curve took on <strong>the</strong>following shape:timeGive one possible explanation for this different curve shape.3) A zooplankton population is preyed upon by small fish. As <strong>the</strong> number <strong>of</strong> fish increase,zooplankton numbers decrease. This causes <strong>the</strong> fish population to decrease, so allowing asubsequent increase in <strong>the</strong> zooplankton population. Draw in <strong>the</strong> shape <strong>of</strong> <strong>the</strong> zooplankton growthcurve at stage 3 on <strong>the</strong> above graph.Preliminary Biology Teacher Resource – Book 1 9
A LOCAL ECOSYSTEMPOPULATION TRENDS IN ECOSYSTEMSANSWERS1) At position 1, growth is initially slow as <strong>the</strong> species adjusts to <strong>the</strong> environment <strong>and</strong> establishesreproductive patterns. At position 2, <strong>the</strong> population has become established <strong>and</strong> growth ismore rapid. At position 3, environmental factors such as competition for <strong>the</strong> same resourcescause <strong>the</strong> curve to level <strong>of</strong>f.2) The population changes at stage 3 are sharp <strong>and</strong> uneven here, suggesting a sudden <strong>abiotic</strong>environmental change, such as increased rainfall, causing swarming <strong>and</strong> perhaps subsequentmigration from <strong>the</strong> area.3) This situation can be represented by a cyclical growth curve, as shown below:3totalpopulation21time10Preliminary Biology Teacher Resource – Book 1
A LOCAL ECOSYSTEMPREDATOR-PREY POPULATIONS INECOSYSTEMS1) Copy <strong>and</strong> complete <strong>the</strong> following passage, using <strong>the</strong> words listed in <strong>the</strong> box below:increases, escape, decrease, predator, prey, decrease, larger, increase, dieThe size <strong>of</strong> a population <strong>of</strong> predators is determined by <strong>the</strong> number <strong>of</strong> ________ available to <strong>the</strong>m.In a simple relationship in which a predator feeds on only one type <strong>of</strong> prey, an ________ in <strong>the</strong>prey population means that more food is available, <strong>and</strong> <strong>the</strong> predator population <strong>the</strong>refore also________. This causes <strong>the</strong> prey population to ________, in turn resulting in a ________ in <strong>the</strong>predator population. If members <strong>of</strong> <strong>the</strong> remaining prey population cannot escape, <strong>the</strong>y may all beeaten, <strong>and</strong> so ________ <strong>of</strong>f. This will also result in <strong>the</strong> demise <strong>of</strong> <strong>the</strong> ________ species. Insituations where at least some prey can ________, however, equilibrium between <strong>the</strong> two speciesis reached. In cases where a predator population feeds on more than one type <strong>of</strong> prey, <strong>the</strong>predator may consume a ________ proportion <strong>of</strong> a certain species if numbers <strong>of</strong> <strong>the</strong> o<strong>the</strong>r preyspecies have decreased.2) Cicadas can have a life cycle <strong>of</strong> up to seventeen years. In what way is this a protectionmechanism against predators?3) In Canada, <strong>the</strong> snowshoe hare is preyed upon by lynxes. Both <strong>of</strong> <strong>the</strong>se species show suddenchanges in <strong>the</strong>ir population densities every 10 years, as shown in <strong>the</strong> graph below.population curve a)curve b)On <strong>the</strong> above graph, label each curve as ei<strong>the</strong>r <strong>the</strong> hare population or <strong>the</strong> lynx population.Explain your answer.4) Use resource material to outline <strong>the</strong> way in which <strong>the</strong> prickly pear cactus in Australia has beencontrolled by an imported predator.5) A population <strong>of</strong> <strong>the</strong> protozoan, Didinium, is introduced into a closed petri dish containingano<strong>the</strong>r protozoan, Paramecium. Assuming Didinium preys upon Paramecium, draw apopulation/time curve to represent <strong>the</strong> changes in <strong>the</strong> number <strong>of</strong> each species over time.timePreliminary Biology Teacher Resource – Book 1 11
A LOCAL ECOSYSTEMPREDATOR-PREY POPULATIONS INECOSYSTEMSANSWERS1) Copy <strong>and</strong> complete: prey, increase, increases, decrease, decrease, die, predator, escape,larger.2) This is because by <strong>the</strong> time <strong>the</strong>y are mature, <strong>the</strong>y are virtually an unknown species to o<strong>the</strong>rorganisms <strong>and</strong> <strong>the</strong>refore have no natural predators.3) Curve a) is <strong>the</strong> hare populationCurve b) is <strong>the</strong> lynx population.This is because <strong>the</strong> lynxes, being predators, increase in number only after an increase in <strong>the</strong>hare population; <strong>the</strong>ir population curve <strong>the</strong>refore seems to `lag’ behind <strong>the</strong> hare curve.4) The prickly pear, being a native <strong>of</strong> South America, had no natural predators in Australiawhen it was introduced. As a result, it became a weed, spreading at <strong>the</strong> rate <strong>of</strong> 400,000hectares per year. One <strong>of</strong> its natural predators from South America, <strong>the</strong> cactoblastis moth,was finally introduced. The female moths produce thous<strong>and</strong>s <strong>of</strong> eggs, which hatch intocaterpillars. These caterpillars devour all parts <strong>of</strong> <strong>the</strong> plant, <strong>and</strong> have been highly successfulin controlling its spread.5) In a small, closed system, <strong>the</strong> prey will eventually be consumed. This will in turn result in <strong>the</strong>elimination <strong>of</strong> <strong>the</strong> Didinium population, as <strong>the</strong>ir food supply will have become exhausted.populationParameciumDidiniumtime12Preliminary Biology Teacher Resource – Book 1
A LOCAL ECOSYSTEMRELATIONSHIPS BETWEEN ORGANISMS INAN ECOSYSTEM1) Relationships between organisms in an ecosystem may be ei<strong>the</strong>r beneficial or detrimental to <strong>the</strong>irchances <strong>of</strong> survival. Rewrite <strong>the</strong> table below so that <strong>the</strong> type <strong>of</strong> relationship listed in column Amatches its description in column B.ApredationalleopathyparasitismmutualismcommensalismBA detrimental relationship in which one plantreduces <strong>the</strong> growth <strong>of</strong> ano<strong>the</strong>r one in its vicinityby secreting inhibitory chemicals.A necessary beneficial relationship between twoorganisms; both need each o<strong>the</strong>r for survival.A detrimental relationship in which one organismkills <strong>and</strong> eats ano<strong>the</strong>r one.A relationship between two organisms in whichone or both benefit; nei<strong>the</strong>r are harmed.A relationship in which one organism usesano<strong>the</strong>r organism (<strong>the</strong> host) as its food source.The host is adversely affected, but does notusually die.2) Identify each <strong>of</strong> <strong>the</strong> relationships described below as predation, alleopathy, parasitism, mutualismor commensalism.a) A lichen, which is in fact composed <strong>of</strong> an alga <strong>and</strong> a fungi living toge<strong>the</strong>r. The alga providesfood for itself <strong>and</strong> <strong>the</strong> fungus by photosyn<strong>the</strong>sising, <strong>and</strong> <strong>the</strong> fungus stores necessary water forboth organisms.b) A remora fish, which attaches itself to a shark as a means <strong>of</strong> transport. It also eats any foodremains dropped by <strong>the</strong> shark.c) Epiphytic ferns, which attach <strong>the</strong>mselves to <strong>the</strong> trunks <strong>of</strong> large rainforest trees as a means <strong>of</strong>support.d) A tapeworm feeding on digested food in <strong>the</strong> human intestine.e) The rhizobium bacteria, which lives in <strong>the</strong> root nodules <strong>of</strong> legume plants. Rhizobium obtainsfood from <strong>the</strong> plant, while at <strong>the</strong> same time converting nitrogen from <strong>the</strong> air into nitrates thatcan be used by <strong>the</strong> plant.f) Many eucalypt species produce toxic chemicals that inhibit <strong>the</strong> growth <strong>of</strong> seedlings <strong>of</strong> o<strong>the</strong>rspecies underneath <strong>the</strong>ir canopies.g) Wildebeest calves in Africa are killed <strong>and</strong> eaten by hyenas.3) Some ants have a relationship with aphids in which <strong>the</strong> ants feed <strong>of</strong>f <strong>the</strong> sugary liquid exudedfrom <strong>the</strong> aphids. In return, <strong>the</strong> ants <strong>of</strong>ten keep <strong>the</strong> aphids in <strong>the</strong>ir colony, feeding <strong>the</strong>m <strong>and</strong>protecting <strong>the</strong>m. Both species, however, are capable <strong>of</strong> living independently <strong>of</strong> each o<strong>the</strong>r. Is thisan example <strong>of</strong> mutualism, parasitism or commensalism? Explain.Preliminary Biology Teacher Resource – Book 1 13
A LOCAL ECOSYSTEMRELATIONSHIPS BETWEEN ORGANISMS INAN ECOSYSTEMANSWERS1)ApredationalleopathyparasitismmutualismcommensalismBA detrimental relationship in which oneorganism kills <strong>and</strong> eats ano<strong>the</strong>r one.A detrimental relationship in which one plantreduces <strong>the</strong> growth <strong>of</strong> ano<strong>the</strong>r one in its vicinityby secreting inhibitory chemicals.A relationship in which one organism usesano<strong>the</strong>r organism (<strong>the</strong> host) as its food source.The host is adversely affected, but does notusually die.A necessary beneficial relationship betweentwo organisms; both need each o<strong>the</strong>r forsurvival.A relationship between two organisms in whichone or both benefit; nei<strong>the</strong>r are harmed.2) a) mutualismb) commensalismc) commensalismd) parasitisme) mutualismf) alleopathyg) predation3) Commensalism, because each species is capable <strong>of</strong> existing independently <strong>of</strong> <strong>the</strong> o<strong>the</strong>r.14Preliminary Biology Teacher Resource – Book 1