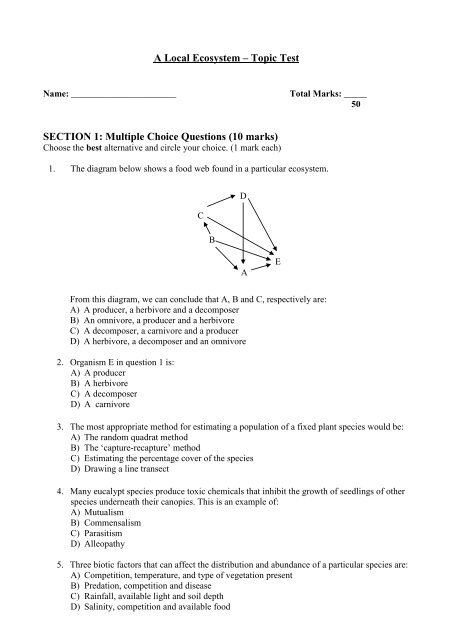
A Local Ecosystem – Topic Test SECTION 1: Multiple Choice ...
A Local Ecosystem – Topic Test SECTION 1: Multiple Choice ...
A Local Ecosystem – Topic Test SECTION 1: Multiple Choice ...
- No tags were found...

Create successful ePaper yourself
Turn your PDF publications into a flip-book with our unique Google optimized e-Paper software.
A <strong>Local</strong> <strong>Ecosystem</strong> <strong>–</strong> <strong>Topic</strong> <strong>Test</strong>Name: _______________________Total Marks: _____50<strong>SECTION</strong> 1: <strong>Multiple</strong> <strong>Choice</strong> Questions (10 marks)Choose the best alternative and circle your choice. (1 mark each)1. The diagram below shows a food web found in a particular ecosystem.CBDAEFrom this diagram, we can conclude that A, B and C, respectively are:A) A producer, a herbivore and a decomposerB) An omnivore, a producer and a herbivoreC) A decomposer, a carnivore and a producerD) A herbivore, a decomposer and an omnivore2. Organism E in question 1 is:A) A producerB) A herbivoreC) A decomposerD) A carnivore3. The most appropriate method for estimating a population of a fixed plant species would be:A) The random quadrat methodB) The ‘capture-recapture’ methodC) Estimating the percentage cover of the speciesD) Drawing a line transect4. Many eucalypt species produce toxic chemicals that inhibit the growth of seedlings of otherspecies underneath their canopies. This is an example of:A) MutualismB) CommensalismC) ParasitismD) Alleopathy5. Three biotic factors that can affect the distribution and abundance of a particular species are:A) Competition, temperature, and type of vegetation presentB) Predation, competition and diseaseC) Rainfall, available light and soil depthD) Salinity, competition and available food
6. The growth curve below shows the changes in an insect population over time.The levelling off of the curve at ‘X’ is most likely due to:A) Competition within the species for the same resourcesB) The introduction of a predator speciesC) A sudden change in one of the abiotic features of the ecosystemD) Migration of the insect species to another ecosystem7. The diagram below shows a typical food web from a freshwater ecosystem.WaterSnailsAdult AquaticMurray cod perch insectsProtozoaAlgaeThe earliest effect of a sudden decrease in the adult perch population would be:A) An increase in the Murray cod populationB) A decrease in the protozoan populationC) A decrease in the population of aquatic insectsD) An increase in the biomass of algae8. 25 members of a fish population are captured and tagged. They are then released. Some timelater, 15 fish are recaptured. Of these, five are tagged. The best estimate for the total fishpopulate would be:A) 45B) 40C) 75D) 1259. Which of the following is not an adaptation to reduce water loss?A) A reduced number of sweat glandsB) The production of concentrated urineC) A small body sizeD) Leaves that are narrow or reduced to spines
10. The curve below shows changes in the numbers of unicellular alga, Chlamydomonas, inNorth American waters over a one-year period.The increase in numbers of Chlamydomonas between April and August is most likely dueto:A) An increase in herbivorous water snailsB) An increase in the amount of organic food matterC) An increase in the temperature of surface waters during this periodD) A decrease in the amount of dissolved nutrients available<strong>SECTION</strong> 2: Free Response Questions (40 marks)Answer each question in the spaces provided.1. The table below shows the numbers of two insect species found in a particular ecosystemover a period of 9 weeks.Week Species A Species B1 17 282 23 1393 22 2184 19 1615 11 1756 13 2757 10 2198 0 2189 0 219
a) Draw population curves for each species by plotting these figures on the same set ofaxes. (2 marks)b) Use your graph to deduce the type of relationship that exists between species S andspecies B. Give a reason for your answer. (2 marks)____________________________________________________________________________________________________________________________________________________________________________________________________________________________________________________________________________________________2. During your field study of a local ecosystem you measured some of its abiotic factors.Briefly explain how you would measure the following: (1 mark each)Temperature ________________________________________________________________________________________________________________________________________Moisture ____________________________________________________________________________________________________________________________________________Acidity _____________________________________________________________________________________________________________________________________________Wind speed/exposure _________________________________________________________________________________________________________________________________3. a) Is energy cycled through an ecosystem? Explain. (2 marks)________________________________________________________________________________________________________________________________________________________________________________________________________________________________________________________________________________________________________b) Complete the biomass pyramid for the freshwater community shown below. Assume90% of the mass from each trophic level is lost before the next level is reached.(2 marks)eels: _______ kglarge fish: _______ kgsmall fish: _______ kgwater snails: _______ kgwater plant: 500,000 kg
4. An ecosystem is often defined as a group of organisms interacting with each other and theirnon-living surroundings. In other words, an ecosystem consists of biotic and abioticcomponents.a) Outline one way in which the distribution and abundance of a terrestrial organism isaffected by: (2 marks)i) A named biotic factor _______________________________________________________________________________________________________________________________________________________________________________________ii) A named abiotic factor ______________________________________________________________________________________________________________________________________________________________________________________b) Outline one way in which the distribution and abundance of an aquatic organism isaffected by: (2 marks)i) A named biotic factor _______________________________________________________________________________________________________________________________________________________________________________________ii) A named abiotic factor ______________________________________________________________________________________________________________________________________________________________________________________5. Briefly describe four ways in which humans have adversely affected natural ecosystems. (4marks) _____________________________________________________________________________________________________________________________________________________________________________________________________________________ _____________________________________________________________________________________________________________________________________________________________________________________________________________________ _____________________________________________________________________________________________________________________________________________________________________________________________________________________ _____________________________________________________________________________________________________________________________________________________________________________________________________________________6. The diagram below represents a population of native grass plants within a 100m 2 area. Eachsquare represents a 1m 2 quadrat and each cross depicts one plant. Use the quadrat method toestimate the total plant population. Set out your results in the table provided. (4 marks)xx x xx x xx xx xx xxx xx xx x xxx x x x xx xx x x x xx xxxx x x xx x xx x xxxx xxx xx xx xx xxxX x x x xx x xx xxx xx xx x xNumber of random quadratssampledAverage number of plants per m 2quadratEstimate of total number ofplants per 100m 2
7. Draw a food web for the ecosystem described below. (4 marks)In a particular forest ecosystem, leaf eating insects feed on the leaves of Eucalyptus trees,while sap-sucking insects feed on the sap of these trees. Starlings eat both types of insect,and these birds are in turn preyed upon by goshawks. Spiders that live in the trees feed onwasps and the leaf-eating and sap-sucking insects. The wasps are sometimes observed to eatthe sap-sucking insects.8. a) Briefly outline the importance of decomposers in ecosystems. (3 marks)____________________________________________________________________________________________________________________________________________________________________________________________________________________________________________________________________________________________________________________________________________________________________________________________________________________________________________________________b) Draw in appropriate arrows to include a decomposer organism in the food web youcompleted in question 17.9. Explain how the following adaptations assist the organisms described to survive in theirenvironments. (1 mark each)a) The kangaroo rat, a desert mammal burrows underground in daylight hours. _______________________________________________________________________________________________________________________________________________________________________________________________________________________________b) During cold conditions, some animals reduce the amount of blood flowing to the skin’ssurface. ______________________________________________________________________________________________________________________________________________________________________________________________________________c) Freshwater fish often produce dilute urine. _________________________________________________________________________________________________________________________________________________________________________________________________________________________________________________________d) The leaves of rainforest trees often have a large surface area. ___________________________________________________________________________________________________________________________________________________________________________________________________________________________________________
10. Define the following relationships and give a specific example for each. (1 mark each)a) Mutualism __________________________________________________________________________________________________________________________________________________________________________________________________________________________________________________________________________________b) Parasitism __________________________________________________________________________________________________________________________________________________________________________________________________________________________________________________________________________________c) Commensalism ______________________________________________________________________________________________________________________________________________________________________________________________________________________________________________________________________________d) Alleopathy __________________________________________________________________________________________________________________________________________________________________________________________________________________________________________________________________________________