Annual Report 2011 - Mandarin Oriental Hotel Group
Annual Report 2011 - Mandarin Oriental Hotel Group
Annual Report 2011 - Mandarin Oriental Hotel Group

You also want an ePaper? Increase the reach of your titles
YUMPU automatically turns print PDFs into web optimized ePapers that Google loves.
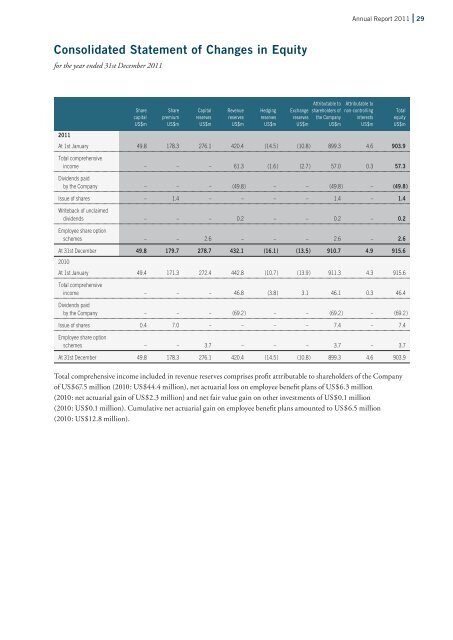
Consolidated Statement of Changes in Equity<br />
for the year ended 31st December <strong>2011</strong><br />
<strong>Annual</strong> <strong>Report</strong> <strong>2011</strong> 29<br />
Attributable to Attributable to<br />
Share Share Capital Revenue Hedging Exchange shareholders of non-controlling Total<br />
capital premium reserves reserves reserves reserves the Company interests equity<br />
US$m US$m US$m US$m US$m US$m US$m US$m US$m<br />
<strong>2011</strong><br />
At 1st January 49.8 178.3 276.1 420.4 (14.5 ) (10.8 ) 899.3 4.6 903.9<br />
Total comprehensive<br />
income – – – 61.3 (1.6 ) (2.7 ) 57.0 0.3 57.3<br />
Dividends paid<br />
by the Company – – – (49.8 ) – – (49.8 ) – (49.8 )<br />
Issue of shares – 1.4 – – – – 1.4 – 1.4<br />
Writeback of unclaimed<br />
dividends – – – 0.2 – – 0.2 – 0.2<br />
Employee share option<br />
schemes – – 2.6 – – – 2.6 – 2.6<br />
At 31st December<br />
2010<br />
49.8 179.7 278.7 432.1 (16.1 ) (13.5 ) 910.7 4.9 915.6<br />
At 1st January 49.4 171.3 272.4 442.8 (10.7 ) (13.9 ) 911.3 4.3 915.6<br />
Total comprehensive<br />
income – – – 46.8 (3.8 ) 3.1 46.1 0.3 46.4<br />
Dividends paid<br />
by the Company – – – (69.2 ) – – (69.2 ) – (69.2 )<br />
Issue of shares 0.4 7.0 – – – – 7.4 – 7.4<br />
Employee share option<br />
schemes – – 3.7 – – – 3.7 – 3.7<br />
At 31st December 49.8 178.3 276.1 420.4 (14.5 ) (10.8 ) 899.3 4.6 903.9<br />
Total comprehensive income included in revenue reserves comprises profit attributable to shareholders of the Company<br />
of US$67.5 million (2010: US$44.4 million), net actuarial loss on employee benefit plans of US$6.3 million<br />
(2010: net actuarial gain of US$2.3 million) and net fair value gain on other investments of US$0.1 million<br />
(2010: US$0.1 million). Cumulative net actuarial gain on employee benefit plans amounted to US$6.5 million<br />
(2010: US$12.8 million).