Sovereign Bancorp, Inc. Announces Fourth Quarter and Full Year ...
Sovereign Bancorp, Inc. Announces Fourth Quarter and Full Year ...
Sovereign Bancorp, Inc. Announces Fourth Quarter and Full Year ...

Create successful ePaper yourself
Turn your PDF publications into a flip-book with our unique Google optimized e-Paper software.
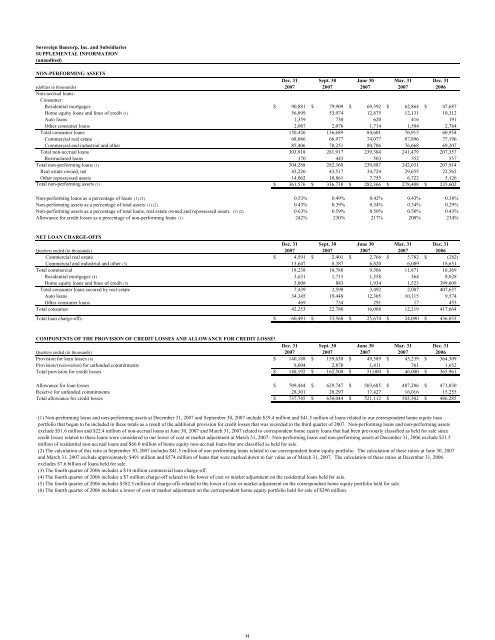
<strong>Sovereign</strong> <strong>Bancorp</strong>, <strong>Inc</strong>. <strong>and</strong> Subsidiaries<br />
SUPPLEMENTAL INFORMATION<br />
(unaudited)<br />
NON-PERFORMING ASSETS<br />
Dec. 31 Sept. 30 June 30 Mar. 31 Dec. 31<br />
(dollars in thous<strong>and</strong>s)<br />
Non-accrual loans:<br />
Consumer:<br />
2007 2007 2007 2007 2006<br />
Residential mortgages $ 90,881 $ 79,909 $ 69,392 $ 62,864 $ 47,687<br />
Home equity loans <strong>and</strong> lines of credit (1) 56,099 53,974 12,875 12,131 10,312<br />
Auto loans 1,359<br />
730<br />
620<br />
416<br />
191<br />
Other consumer loans 2,087<br />
2,076<br />
1,714<br />
1,504<br />
2,764<br />
Total consumer loans 150,426 136,689 84,601 76,915 60,954<br />
Commercial real estate 68,086 66,977 74,077 87,896 77,196<br />
Commercial <strong>and</strong> industrial <strong>and</strong> other 85,406 78,251 80,706 76,668 69,207<br />
Total non-accrual loans 303,918 281,917 239,384 241,479 207,357<br />
Restructured loans 370<br />
443<br />
503<br />
552<br />
557<br />
Total non-performing loans (1) 304,288 282,360 239,887 242,031 207,914<br />
Real estate owned, net 43,226 43,517 34,724 29,655 22,562<br />
Other repossessed assets 14,062 10,861<br />
7,755<br />
6,722<br />
5,126<br />
Total non-performing assets (1) $ 361,576 $ 336,738 $ 282,366 $ 278,408 $ 235,602<br />
Non-performing loans as a percentage of loans (1) (2) 0.53% 0.49% 0.42% 0.43% 0.38%<br />
Non-performing assets as a percentage of total assets (1) (2) 0.43% 0.39% 0.34% 0.34% 0.29%<br />
Non-performing assets as a percentage of total loans, real estate owned <strong>and</strong> repossessed assets (1) (2) 0.63% 0.59% 0.50% 0.50% 0.43%<br />
Allowance for credit losses as a percentage of non-performing loans (1) 242% 230% 217% 208% 234%<br />
NET LOAN CHARGE-OFFS<br />
Dec. 31 Sept. 30 June 30 Mar. 31 Dec. 31<br />
<strong>Quarter</strong>s ended (in thous<strong>and</strong>s) 2007 2007 2007 2007 2006<br />
Commercial real estate $ 4,591 $ 2,401 $ 2,766 $ 5,782 $ (282)<br />
Commercial <strong>and</strong> industrial <strong>and</strong> other (3) 13,647<br />
8,387<br />
6,820<br />
6,089 18,651<br />
Total commercial 18,238 10,788<br />
9,586 11,871 18,369<br />
Residential mortgages (4) 3,631<br />
1,715<br />
1,558<br />
564<br />
8,028<br />
Home equity loans <strong>and</strong> lines of credit (5) 3,808<br />
883<br />
1,934<br />
1,523 399,609<br />
Total consumer loans secured by real estate 7,439<br />
2,598<br />
3,492<br />
2,087 407,637<br />
Auto loans 34,345 19,448 12,305 10,115<br />
9,574<br />
Other consumer loans 469<br />
734<br />
291<br />
17<br />
453<br />
Total consumer 42,253 22,780 16,088 12,219 417,664<br />
Total loan charge-offs $ 60,491 $ 33,568 $ 25,674 $ 24,090 $ 436,033<br />
COMPONENTS OF THE PROVISION OF CREDIT LOSSES AND ALLOWANCE FOR CREDIT LOSSES<br />
Dec. 31 Sept. 30 June 30 Mar. 31 Dec. 31<br />
<strong>Quarter</strong>s ended (in thous<strong>and</strong>s) 2007 2007 2007 2007 2006<br />
Provision for loan losses (6) $ 140,188 $ 159,630 $ 49,589 $ 45,239 $ 364,309<br />
Provision/(recoveries) for unfunded commitments 8,004<br />
2,870<br />
1,411<br />
761<br />
1,652<br />
Total provision for credit losses $ 148,192 $ 162,500 $ 51,000 $ 46,000 $ 365,961<br />
Allowance for loan losses $ 709,444 $ 629,747 $ 503,685 $ 487,286 $ 471,030<br />
Reserve for unfunded commitments 28,301 20,297 17,427 16,016 15,255<br />
Total allowance for credit losses $ 737,745 $ 650,044 $ 521,112 $ 503,302 $ 486,285<br />
(1) Non-performing loans <strong>and</strong> non-performing assets at December 31, 2007 <strong>and</strong> September 30, 2007 include $39.4 million <strong>and</strong> $41.5 million of loans related to our correspondent home equity loan<br />
portfolio that began to be included in these totals as a result of the additional provision for credit losses that was recorded in the third quarter of 2007. Non-performing loans <strong>and</strong> non-performing assets<br />
exclude $51.6 million <strong>and</strong> $22.4 million of non-accrual loans at June 30, 2007 <strong>and</strong> March 31, 2007 related to correspondent home equity loans that had been previously classified as held for sale since<br />
credit losses related to these loans were considered in our lower of cost or market adjustment at March 31, 2007. Non-performing loans <strong>and</strong> non-performing assets at December 31, 2006 exclude $21.5<br />
million of residential non-accrual loans <strong>and</strong> $66.0 million of home equity non-accrual loans that are classified as held for sale.<br />
(2) The calculation of this ratio at September 30, 2007 includes $41.5 million of non performing loans related to our correspondent home equity portfolio. The calculation of these ratios at June 30, 2007<br />
<strong>and</strong> March 31, 2007 exclude approximately $491 million <strong>and</strong> $574 million of loans that were marked down to fair value as of March 31, 2007. The calculation of these ratios at December 31, 2006<br />
excludes $7.6 billion of loans held for sale.<br />
(3) The fourth quarter of 2006 includes a $14 million commercial loan charge-off.<br />
(4) The fourth quarter of 2006 includes a $7 million charge-off related to the lower of cost or market adjustment on the residential loans held for sale.<br />
(5) The fourth quarter of 2006 includes $382.5 million of charge-offs related to the lower of cost or market adjustment on the correspondent home equity portfolio held for sale.<br />
(6) The fourth quarter of 2006 includes a lower of cost or market adjustment on the correspondent home equity portfolio held for sale of $296 million.<br />
H