Biodiversity, biocapacity and better choices
Biodiversity, biocapacity and better choices
Biodiversity, biocapacity and better choices

You also want an ePaper? Increase the reach of your titles
YUMPU automatically turns print PDFs into web optimized ePapers that Google loves.
Living Planet Report 2012BIOCAPACITYIt takes 1.5 years for theEarth to regenerate therenewable resources thatpeople use, <strong>and</strong> absorb theCO2 waste they produce,in that same year.BIODIVERSITY<strong>Biodiversity</strong>, ecosystems <strong>and</strong>ecosystem services – ournatural capital – must bepreserved as the foundationof well-being for all.100%RECYCLEDLIVING PLANET REPORT 2012LIVING PLANET REPORT 2012REPORTIT N2012BETTER CHOICESLiving within ecologicalboundaries requires a globalconsumption <strong>and</strong> productionpattern in balance with theEarth’s <strong>biocapacity</strong>.EQUITABLE SHARINGEquitable resource governanceis essential to shrink <strong>and</strong> shareour resource use.Living PlanetReport 2012Why we are hereTo stop the degradation of the planet’s natural environment <strong>and</strong>to build a future in which humans live in harmony with nature.p<strong>and</strong>a.org/lpr© 1986 P<strong>and</strong>a symbol WWF – World Wide Fund For Nature (Formerly World Wildlife Fund)® “WWF” is a WWF Registered Trademark. WWF, Avenue du Mont-Blanc, 1196 Gl<strong>and</strong>,Switzerl<strong>and</strong> – Tel. +41 22 364 9111; Fax. +41 22 364 0332. For contact details <strong>and</strong> furtherinformation, visit our international website at at p<strong>and</strong>a.org© NASAint WWF.ORG<strong>Biodiversity</strong>, <strong>biocapacity</strong><strong>and</strong> <strong>better</strong> <strong>choices</strong>
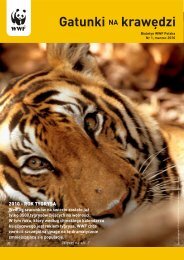
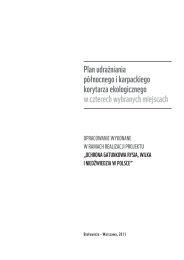
Chapter 1: The stateof the planet~This image captures the meticulously planned cultivated l<strong>and</strong>scapeof the autonomous communities of Aragon (west) <strong>and</strong> Catalonia innortheastern Spain. Many agricultural crops can be seen growingincluding wheat, barley, fruits <strong>and</strong> vegetables. The circular shapeof many of the fields indicates central-pivot irrigation is beingemployed; a well drilled in the centre of each circle supplies water toa rotating series of sprinklers.© KARIdesign note:Check for gutter <strong>and</strong> repeatimage if necessary
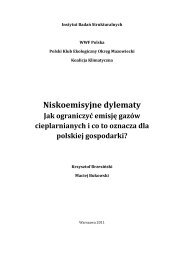
the LIVING PLANET INDEXThe Living Planet Index reflects changes in the state of theplanet’s biodiversity, using trends in population size forvertebrate species from different biomes <strong>and</strong> regions tocalculate average changes in abundance over time. It includesdata from more than 9,000 different wildlife monitoringschemes collected in a wide variety of ways – ranging fromcounting the number of individual animals, to cameratrapping, to surveys of nesting sites <strong>and</strong> animal traces.Main image: Researcher <strong>and</strong> a polar bear, Svalbard, Norway.Below: Rangers attach a ring tag to a baby brown booby.Camera trap photo of a Sumatran rhinoceros, Borneo.Whale shark tagging, Donsol, Sorsogon, Philippines.© Jon Aars / Norwegian Polar Institute / WWF-Canon© Jurgen Freund / WWF-Canon © WWF-Malaysia / Raymond Alfred © Jurgen Freund / WWF-Canon
MONITORING GLOBALBIODIVERSITYGiven the complexity of global biodiversity, it is very difficult toprovide a complete picture of its overall health. But much as astock market index measures the state of the market by trackingchanges in market capitalization of a selection of companies,changes in abundance (i.e., the total number of individuals in agiven population) across a selection of species can be used as oneimportant indicator of the planet’s ecological condition.The Living Planet Index suggests that across the globe,vertebrate populations were on average one-third smaller in 2008than they were in 1970 (Figure 3). This is based on trends in the sizeof 9,014 populations of 2,688 mammal, bird, reptile, amphibian <strong>and</strong>fish species – many more than in previous editions of the LivingPlanet Report (WWF, 2006b; 2008b; 2010a).Index Value (1970 = 1)2.01.00-28%1970 1975 1980 1985 1990 1995 2000 2005 2008YearFigure 3: The GlobalLiving Planet IndexThe index shows a declineof 28% from 1970 to 2008,based on 9,014 populationsof 2,688 species of birds,mammals, amphibians,reptiles <strong>and</strong> fish.Shading on this, <strong>and</strong>all Living Planet Indexfigures represents the95% confidence limitssurrounding the trend; thewider the shading, the morevariable the underlyingtrend (WWF/ZSL, 2012).KeyGlobal Living PlanetIndexConfidence limitsFigure 4: Turningpopulation trendsinto the Living Planetindicesvertebratepopulations in THEGLOBAL LPI were onaverage one-thirdsmaller in 2008 thanthey were in 1970tropicalpopulation1species1population2temperatetropicalterrestrialspecies2population3GLOBALLPItemperateterrestrialtropicalmarinespecies3terrestrialLPItemperatemarinetropicalfreshwatermarineLPItemperatefreshwaterfreshwaterLPIEach population in the Living Planet Index is classified according towhether it is located in a temperate or tropical region, <strong>and</strong> whetherit predominantly lives in a terrestrial, freshwater or marine system.These classifications are specific to the population rather than tothe species, so some species are included in more than one index.For example, species with both freshwater <strong>and</strong> marine populations,such as salmon, or migratory species found in both tropical <strong>and</strong>temperate zones are recorded separately. No populations aredouble counted. These groups are used to comprise the temperate<strong>and</strong> tropical indices, as well as terrestrial, freshwater <strong>and</strong> marineindices, which together calculate the global Living Planet Index(Figure 4). There are more populations in the temperate index thanthere are in the tropical index. Therefore, to avoid biasing the globalindex toward population trends in temperate zones, the tropical <strong>and</strong>temperate indices are given equal weight in the global index (moredetails on this are included in Annex 1).In addition, each terrestrial <strong>and</strong> freshwater species’population is classified to a realm according to its geographiclocation. Realm indices are calculated by giving equal weight to eachspecies, with the exception of the Palearctic realm where, for thefirst time in this analysis, each family is given equal weight. This wasdone to reduce bias toward bird species, for which there are manymore population records compared to other species in this realm.WWF Living Planet Report 2012 page 18 Chapter 1: The state of the planet page 19
Exploring the Living Planet IndexThe Living Planet Index is a composite indicator that measureschanges in the size of wildlife populations to indicate trends inthe overall state of global biodiversity. Trends within a particularpopulation only show what is happening to a species within aparticular area. To create a robust index, comprehensive populationdata are collected for as many species <strong>and</strong> populations as possiblefrom around the world. While some populations increased duringthe time they have been monitored, others have decreased. Onaverage, however, the magnitude of population decreases exceededthat of the increases, so overall the index shows a global decline.© naturepl.com / Doug Perrine / WWF-CanonFigure 5: Northern bluefin tuna (Thunnusthynnus), Western Atlantic OceanUnsustainable levels of fishing have caused acatastrophic decline in this population sincethe 1970s. Because bluefin tuna has a very highcommercial value, fishing pressure has continued<strong>and</strong>, as a result, the species as a whole is indanger of extinction.Note: Data are from International Commissionfor the Conservation of Atlantic Tunas (ICCAT)cited in Safina <strong>and</strong> Klinger, 2008.60,000Spawning stockbiomass (tonnes)019712004Figure 6: European otter (Lutra lutra),DenmarkAfter suffering serious population declines inthe 1960s <strong>and</strong> ’70s, improved water quality<strong>and</strong> control of exploitation helped a recoveryin Denmark from 1984 to 2004, as well as inseveral other countries.Note: Data are from Norm<strong>and</strong>er et al., 2009.450Otter numbers019842004Figure 7: W<strong>and</strong>ering albatross (Diomedeaexulans), Bird Isl<strong>and</strong>, South Georgia, SouthAtlantic OceanThis population has been in steady decline since1972. The primary cause is believed to be incidentalmortality from entanglement in longline fishingequipment. One proposed measure to protect thisspecies is to design <strong>and</strong> implement longlines thatmitigate this bycatch.Note: Based on unpublished data from theBritish Antarctic Servey long-term monitoringprogramme 2012.1,800Population size(breeding pairs)019722010View from below of silhouette of diver <strong>and</strong> Atlantic sailfish (Istiophorus albicans) attacking baitball of Spanish sardines / gilt sardine / pilchard / round sardinella (Sardinella aurita) off YucatanPeninsula, Mexico, Caribbean Sea.WWF Living Planet Report 2012 page 20
Tropical <strong>and</strong> Temperate Living Planet IndicesThe tropical Living Planet Index declined by just over 60 percent from 1970 to 2008, while the temperate Living Planet Indexincreased by 30 per cent over the same period (Figure 8). Thisdifference holds true for mammals, birds, amphibians <strong>and</strong> fish; forterrestrial, marine <strong>and</strong> freshwater species (Figures 9-11); <strong>and</strong> acrossall tropical <strong>and</strong> temperate biogeographic realms (Figures 16-20).Due to the lack of published data prior to 1970, historicchanges to biodiversity cannot be captured in the Living PlanetIndex <strong>and</strong> so all indices are set to an equal value of one in 1970.However, as described in more detail in the following pages, therehas been considerable variation in population trends both betweenindividual species <strong>and</strong> species that share the same broad habitats.Index Value (1970 = 1)2.01.00.0+31%-61%Figure 8: The tropical<strong>and</strong> temperate LivingPlanet indicesThe tropical index iscalculated from terrestrial<strong>and</strong> freshwater populationsfrom the Afrotropical,Indo-Pacific <strong>and</strong> Neotropicalrealms <strong>and</strong> from marinepopulations between theTropics of Cancer <strong>and</strong>Capricorn. The temperateindex is calculated fromterrestrial <strong>and</strong> freshwaterpopulations from thePalearctic <strong>and</strong> Nearcticrealms, <strong>and</strong> marinepopulations found northor south of the tropics. Theglobal tropical index showsa decline of around 61%between 1970 <strong>and</strong> 2008.The global temperate indexshows an increase of around31% over the same period(WWF/ZSL, 2012).KeyTemperate LivingPlanet IndexConfidence limitsFigure 9: The terrestrialLiving Planet Index(a) The global terrestrialindex shows a decline ofaround 25% between 1970<strong>and</strong> 2008; (b) The temperateterrestrial index shows anincrease of about 5%, whilethe tropical terrestrial indexshows a decline of around44% (WWF/ZSL, 2012).KeyGlobal terrestrialindexConfidence limitswhales (Balaena mysticetus), which was estimated at 1,000-3,000 individuals at the end of commercial whaling but has sincerecovered to an estimated 10,545 individuals in 2001 (Angliss <strong>and</strong>Outlaw, 2006).The Terrestrial Living Planet IndexThe global terrestrial Living Planet Index declined by 25 per centbetween 1970 <strong>and</strong> 2008 (Figure 9a). The terrestrial index includes3,770 populations from 1,432 species of birds, mammals, amphibians<strong>and</strong> reptiles from a broad range of temperate <strong>and</strong> tropical habitats,including forests, grassl<strong>and</strong>s <strong>and</strong> dryl<strong>and</strong>s. The tropical terrestrialindex declined by almost 45 per cent, while the temperate terrestrialindex increased by about 5 per cent (Figure 9b).Index Value (1970 = 1)2.01.0-25%1970 19751980 1985 1990 1995 2000 2005 2008YearRecent average population increases do not necessarily mean thattemperate ecosystems are in a <strong>better</strong> state than tropical ecosystems.The observed temperate Living Planet Index trend is the resultof four intertwined phenomena: a recent baseline; differencesin trajectory between taxonomic groups; notable conservationsuccesses; <strong>and</strong> recent relative stability in species’ populations. Ifthe temperate index extended back centuries rather than decades, itwould very likely show a long-term decline at least as great as that ofthe tropical index in recent years. Conversely, a long-term tropicalindex would likely show a much slower rate of change prior to 1970.Populations of some temperate species have increased inrecent years due to conservation efforts. These include US wetl<strong>and</strong>birds (BirdLife International, 2008), UK breeding birds, seabirds<strong>and</strong> overwintering birds (Defra, 2010), <strong>and</strong> certain cetaceanpopulations, such as the western Arctic population of BowheadTropical LivingPlanet IndexConfidence limitsKeyTemperate terrestrialindexConfidence limitsTropical terrestrialindexConfidence limitsIndex Value (1970 = 1)0.02.01.00.01970 19751970 19751980 1985 1990 1995 2000 2005 2008Year+5%-44%1980 1985 1990 1995 2000 2005 2008YearWWF Living Planet Report 2012 page 22 Chapter 1: The state of the planet page 23
The Marine Living Planet IndexThe marine Living Planet Index declined by more than 20 per centbetween 1970 <strong>and</strong> 2008 (Figure 10a). The marine index includes2,395 populations of 675 species of fish, seabirds, marine turtles <strong>and</strong>marine mammals found in temperate <strong>and</strong> tropical marine pelagic,coastal <strong>and</strong> reef ecosystems. Approximately half of the species in thisindex are commercially used.Marine ecosystems exhibit the largest discrepancy betweentropical <strong>and</strong> temperate species: the tropical marine index shows adecline of around 60 per cent between 1970 <strong>and</strong> 2008, while thetemperate marine index increased by around 50 per cent (Figure10b). There is evidence that temperate marine <strong>and</strong> coastal speciesexperienced massive long-term declines over the past few centuries(Lotze et al., 2006; Thurstan et al., 2010); therefore the temperateIndex Value (1970 = 1)2.01.0-22%Figure 10: The marineLiving Planet Index(a) The global marine indexshows a decline of about22% between 1970 <strong>and</strong>2008; (b) The temperatemarine index shows anincrease of about 53%,while the tropical marineindex shows a declineof around 62% (WWF/ZSL, 2012).Key 10aFigure 11: Thefreshwater LivingPlanet Index(a) The global freshwaterindex shows a decline of37% between 1970 <strong>and</strong>2008; (b) The temperatefreshwater index showsan increase of about36%, while the tropicalfreshwater index showsa decline of around 70%(WWF/ZSL, 2012).Key 11amarine index started from a much lower baseline in 1970 than thetropical marine index. The relative increase in temperate marinepopulations since then is likely a reflection of slight recovery fromhistoric lows.The Freshwater Living Planet IndexThe freshwater Living Planet Index declined more than for any otherbiome. The index includes 2,849 populations of 737 species offish, birds, reptiles, amphibians <strong>and</strong> mammals found in temperate<strong>and</strong> tropical freshwater lakes, rivers <strong>and</strong> wetl<strong>and</strong>s. Overall, theglobal freshwater index declined by 37 per cent between 1970<strong>and</strong> 2008 (Figure 11a). The tropical freshwater index declinedby a much greater extent, 70 per cent – the largest fall of any ofthe biome‐based indices – while the temperate freshwater indexincreased by about 35 per cent (Figure 11b).Index Value (1970 = 1)2.01.00.0Global marine indexConfidence limitsGlobal freshwaterindexConfidence limits0.0-37%1970 19751980 1985 1990 1995 2000 2005 2008Year1970 19751980 1985 1990 1995 2000 2005 2008Year2.0+53%2.0+36%Index Value (1970 = 1)1.0-62%Key 10bTemperate marineindexConfidence limitsTropical marineindexKey 11bTemperatefreshwater indexConfidence limitsTropical freshwaterindexIndex Value (1970 = 1)1.0-70%0.0Confidence limitsConfidence limits0.01970 19751980 1985 1990 1995 2000 2005 2008Year1970 19751980 1985 1990 1995 2000 2005 2008YearWWF Living Planet Report 2012 page 24 Chapter 1: The state of the planet page 25
Example population trends50000Bengal Tiger(Indian populations)19701990 2010•••••• •••• •••• •625500120001970 1978Index Value (1980 = 1)Sumatran Tiger210••Malayan Tiger(1997-98)3001996 1997 1998Living Planet Index for tigers(1980-2010)1980 1985 1990 1995 2000 2005 201019992007 2010•Year••-70%•1206001970••••• • •• • •• •Amur TigerChina(1 site)Russia(16 sites)1990 2010Case study: TigersTiger (Panthera tigris) numbers are at an all timelow. The Living Planet Index for tigers suggests thatthere has been a rapid decline in tiger populations: onaverage, a 70 per cent reduction in the last 30 years.Forced to compete for space in some of themost densely populated regions on Earth, the tiger’srange has also declined to just 7 per cent of its formerextent (S<strong>and</strong>erson et al., 2006). Tigers are listed asEndangered on the IUCN Red List of ThreatenedSpecies (IUCN, 2011), <strong>and</strong> estimates endorsed by theGlobal Tiger Recovery Programme suggest there areonly between 3,200 <strong>and</strong> 3,500 adult tigers remainingin the wild (Global Tiger Initiative, 2011).The species is threatened by poaching,retaliatory killings, habitat loss <strong>and</strong> depletion of itsprey base throughout its range. The most pronouncedpopulation declines reported in recent years arethose located outside of protected areas (Walstonet al., 2010). Populations are more stable, <strong>and</strong> evenincreasing, where conservation efforts have been mostintensive. Many conservation organizations, includingWWF <strong>and</strong> ZSL, are concentrating efforts in thelast remaining, most important habitats as the bestchance of reversing dramatic declines in the shortterm. Overall, global efforts aim to double the wildtiger population to at least 6,000 by 2022.Monitored sitesPriority Conservation AreasCurrent rangeFigure 12: Tiger population trends, range <strong>and</strong>conservation priorities(a) Current tiger distribution <strong>and</strong> recent population trends.Shaded areas denote the current range (light green) (IUCN, 2011);<strong>and</strong> priority conservation areas (dark green); the red points showthe midpoint of each monitored population (time period <strong>and</strong> surveyarea varies between studies; the midpoints in Sumatra, Malaysia<strong>and</strong> South China represent the entire subspecies monitored fromseveral sites), <strong>and</strong> the graphs show population changes for fiveof the tiger subspecies. The two trend lines on the graph for theBengal tiger estimate in India show the result of two differentsurvey methods; (b) A Living Planet Index for tigers. The indexshows the average change in the size of 43 populations from 1980to 2010 (with equal weight given to each of the six subspecies).The baseline is set to an index value of 1 in 1980 due to insufficientpopulation data from the 1970s (WWF / ZSL, 2012).WWF Living Planet Report 2012 page 26 Chapter 1: The state of the planet page 27
Case study: River dolphinsExample population trendsFreshwater cetacean populations are declining rapidly. Thesedolphins <strong>and</strong> porpoises live in some of the world’s largest rivers,including the Ganges, Indus, Yangtze, Mekong <strong>and</strong> Amazon, whichare also home to an estimated 15 per cent of the planet’s people.Infrastructure development, such as dams, levees<strong>and</strong> barrages; entanglement in fishing nets; boat strikes;overexploitation of fisheries; <strong>and</strong> pollution have all contributedto rapid declines in many obligate dolphin (i.e., those that onlylive in rivers <strong>and</strong> lakes) populations over the past 30 years, withthe likely functional extinction of one species, the Yangtze riverdolphin or baiji (Lipotes vexillifer) (Turvey et al., 2007; Figure 13).Populations of Irrawaddy dolphin (Orcaella brevirostris), foundin both marine <strong>and</strong> freshwater habitats, have also declined. Theincreasing trend for the Indus river dolphin (Platanista minor)may be due to recovery following a ban on hunting, or immigrationof dolphins from surrounding areas (Braulik, 2006); however moreinformation is needed on this <strong>and</strong> all freshwater cetacean speciesto gain a <strong>better</strong> underst<strong>and</strong>ing of their overall status. Nevertheless,current knowledge indicates that urgent action is needed toprevent these charismatic <strong>and</strong> still little-understood animalsfrom becoming extinct.500Indus Dolphins25001970 1980 19902000306000Ganges Dolphins2030001001980 19902000 2010300Irrawaddy Dolphins500Baiji Dolphins25001970 1980 1990 2000 201030001500Yangtze Porpoise019801990 2000 20105001992 1998 2004 2010 2016urgent action is needed toprevent these charismatic <strong>and</strong>still little-understood animalsfrom becoming extinct 0841998Amazon Dolphins2000 2002GangesIndusYangtzeMekongAmazonFigure 13: Freshwatercetacean populationtrends <strong>and</strong> rangesCurrent range offreshwater cetacean species<strong>and</strong> population trends forsix species. The shaded areadenotes the current range(IUCN, 2011); graphs showexample population trendsfrom each species.WWF Living Planet Report 2012 page 28 Chapter 1: The state of the planet page 29
Case study: Atlantic codRapid declines in Atlantic cod (Gadus morhua) fisheries arewell documented (e.g., Roberts 2007). As a commodity in worldtrade, this species has been heavily exploited for several centuries(Thurstan et al., 2010). Its economic importance also means thatmore population information is available than for most species,allowing trends in Atlantic cod stocks to be tracked back to the1960s. Historical data for some areas go back even further; datafrom the Nova Scotian Shelf, Canada, for example, were collectedin the 1800s.The Living Planet Index for Atlantic cod suggests thatpopulations have declined by an average of 74 per cent over the past50 years (Figure 14a). Losses have been greatest in the NorthwestAtlantic. The biomass of the Scotian Shelf stock is less than 3 percent of the pre-industrial fishing level (Rosenberg et al., 2005 <strong>and</strong>Figure 14c). Most assessments of changes in fish stock abundance donot take long-term historical data into account. Yet this is importantbecause commercial fishing has been taking place for hundreds ofyears (Rosenberg et al., 2005) <strong>and</strong> knowledge of historic baselinescan aid in setting appropriate targets for recovery. Species like codwere once far more abundant; attempts to rebuild these fisheriesshould therefore reflect how stocks once were, not just how theyappear most recently.74%Atlantic cod hasdeclined by anaverage of 74 percent over the past50 yearsPopulation trendDeclineStableIncreaseFigure 14b: Atlantic cod population trendsAtlantic cod distribution <strong>and</strong> rate of population change. The purple shadedarea denotes the probability of occurrence throughout its range (created usingAquaMaps: Aquamaps, 2010); circles show the midpoint of each stock monitoredwith the colour denoting the rate of population change. The length of the timeseriesranges from 11 to 50 years between 1960 <strong>and</strong> 2010.Index Value (1970 = 1)2101960 1965-74%1970 1975 1980 1985 1990 1995 2000 2005 2010YearFigure 14a: LivingPlanet Index forAtlantic codThe index shows theaverage change in the sizeof 25 stocks between 1960<strong>and</strong> 2010. The baselineis set to an index valueof 1 in 1960 <strong>and</strong> the finalindex value in 2010 is 0.26,suggesting an average 74%decline. (WWF / ZSL, 2012)KeyLiving Planet Indexfor Atlantic codConfidence limitsProbabilityof occurrenceHigh : 1Low : 0Biomass (1000’s mt)Looking back in time1,4001,20080040001850 1900 19702000Figure 14c: Biomass estimates for Atlantic cod on the Scotian ShelfThe blue dot <strong>and</strong> blue dashed line shows the 1852 stock estimate, with blue shadingshowing confidence limits; the black dashed line is the estimated carrying capacityof this marine ecosystem from late 20th century data; <strong>and</strong> the solid blue line onthe right shows total biomass estimates from 1970 to 2000 for adult cod, far lowerthan the historical highs (figure reproduced based on Rosenberg et al., 2005<strong>and</strong> personal communication with Andrew Rosenberg <strong>and</strong> Karen Alex<strong>and</strong>er).WWF Living Planet Report 2012 page 30 Chapter 1: The state of the planet page 31
Biogeographic realms<strong>Biodiversity</strong> trends at a regional level can give insightsinto how animal populations are faring in different partsof the world.Terrestrial <strong>and</strong> freshwater populations are assigned to fivebiogeographic realms (Figure 15), three of which are largelytropical (Indo-Pacific, Afrotropical <strong>and</strong> Neotropical) <strong>and</strong> two largelytemperate (Palearctic <strong>and</strong> Nearctic). The Living Planet Indexincludes species’ populations in the Antarctic, however due to a lackof data from this region, it is not yet possible to construct an indexfor that region alone.Temperate realms show stable trends, while tropical realmsexhibit rapid decline. The Palearctic <strong>and</strong> Nearctic indices showlittle change between 1970 <strong>and</strong> 2008 (Figures 16 <strong>and</strong> 17). Thelatter is likely due in part to effective environmental protection<strong>and</strong> conservation efforts since 1970. Individual populations inthe Palearctic realm fared differently: Some, such as seabirds <strong>and</strong>wintering water birds, increased (for example, some UK wild birdpopulations: Defra, 2010), while others, such as saiga antelope(Saiga tatarica) (Milner-Gull<strong>and</strong> et al., 2001) <strong>and</strong> amphibians incentral Spain (Bosch <strong>and</strong> Martinez-Solano, 2006), underwent largescaledecline. The water bird trend may be due in part to <strong>better</strong>environmental protection since 1970. However, as most data comefrom Europe, with comparatively little data from northern Asia,trends from individual countries could provide a different picture.In contrast, the Afrotropical index declined by 38 per cent;the Neotropical index by 50 per cent; <strong>and</strong> the Indo-Pacific index by64 per cent (Figures 18, 19 <strong>and</strong> 20). These declines reflect largescaleforest <strong>and</strong> other habitat loss across these realms, driven bylogging, growing human populations, <strong>and</strong> agricultural, industrial<strong>and</strong> urban developments (Craigie et al., 2010; Norris et al., 2010;MEA, 2005; FAO, 2005; Hansen et al., 2008). Tropical forestcover declined most rapidly in Southeast Asia between 1990 <strong>and</strong>2005, with an estimated 0.6-0.8 per cent loss per year (FAO, 2005;Hansen et al., 2008). The decline in the Neotropical index alsoreflects catastrophic declines in amphibian numbers, caused inmany cases by the spread of fungal disease.© Michel Roggo / WWF-CanonRio Negro Forest Reserve, Amazonas, Brazil. Flooded forest during rainy season. Aerial view offloating vegetation.WWF Living Planet Report 2012 page 32
<strong>Biodiversity</strong> trends around the worldWhat is a biogeographic realm?Biogeographic realms are regions characterized by distinctassemblages of species. They represent large areas of theEarth’s surface separated by major barriers to plant <strong>and</strong>animal migration – such as oceans, broad deserts <strong>and</strong> highmountain ranges – where terrestrial species have evolvedin relative isolation over long periods of time.Index Value (1970 = 1)2101970 1975Figure 16: Nearctic LPI-6%1980 1985 1990 1995 2000 2005 2008YearIndex Value (1970 = 1)210Figure 17: Palearctic LPI +6%1970 19751980 1985 1990 1995 2000 2005 2008Year2Figure 15: Globalbiogeographic realmsIndex Value (1970 = 1)1Figure 18: Neotropical LPI -50%0NEARCTICPALEARCTIC1970 19751980 1985 1990 1995 2000 2005 2008Year2Tropic of CancerINDO-PACIFICAFROTROPICALINDO-PACIFICIndex Value (1970 = 1)1Figure 19: Afrotropical LPI-38%0Tropic of Capricorn1970 19751980 1985 1990 1995 2000 2005 2008YearNEOTROPICAL2ANTARCTICIndex Value (1970 = 1)1Figure 20: Indo-Pacific LPI-64%01970 19751980 1985 1990 1995 2000 2005 2008YearWWF Living Planet Report 2012 page 34 Chapter 1: The state of the planet page 35
the EcologicalFootprintThe Ecological Footprint tracks humanity’s dem<strong>and</strong>s on thebiosphere by comparing humanity’s consumption againstthe Earth’s regenerative capacity, or <strong>biocapacity</strong>. It does thisby calculating the area required to produce the resourcespeople consume, the area occupied by infrastructure,<strong>and</strong> the area of forest required for sequestering CO2 notabsorbed by the ocean (see Galli et al., 2007; Kitzes et al.,2009 <strong>and</strong> Wackernagel et al., 2002).© National Geographic Stock / Jim Richardson / WWF-CanonLights of Chicago city burn brightly, consuming large amounts ofelectricity, Illinois, United States.
MEASURING HUMAN DEMANDNational Footprint Accounts (NFAs) track resources for eachindividual country, which together make up the global EcologicalFootprint. They include crops <strong>and</strong> fish for human food <strong>and</strong> otheruses; timber; <strong>and</strong> grass <strong>and</strong> feed crops for livestock. CO2 emissionsare currently the only waste product tracked (Figure 21).Biocapacity quantifies nature’s capacity to produce renewableresources, provide l<strong>and</strong> for built-up areas <strong>and</strong> provide wasteabsorption services such as carbon uptake. Biocapacity acts as anecological benchmark against which the Ecological Footprint canbe compared. The Ecological Footprint does not directly includewater use; however this is intrinsic to <strong>biocapacity</strong> – as lack of water,or polluted water, has a direct impact on the availability <strong>and</strong> stateof <strong>biocapacity</strong>. Both the Ecological Footprint <strong>and</strong> <strong>biocapacity</strong> areexpressed in a common unit called a global hectare, where 1 gharepresents a biologically productive hectare with world averageproductivity. In 2008, the Earth’s total <strong>biocapacity</strong> was 12.0 billiongha, or 1.8 gha per person, while humanity’s Ecological Footprintwas 18.2 billion gha, or 2.7 gha per person. This discrepancymeans it would take 1.5 years for the Earth to fully regeneratethe renewable resources that people used in one year.Ecological Footprint (number of planet Earths)2101961 1970 1980 1990 2000 2008YearFigure 21: GlobalEcological Footprint bycomponent, 1961-2008The largest component ofthe Ecological Footprintis the carbon footprint(55%). At a national levelthe carbon footprintrepresents more than halfthe Ecological Footprintfor one-quarter of thecountries tracked. It isthe largest component forapproximately half thecountries tracked (GlobalFootprint Network, 2011).KeyBuilt-up l<strong>and</strong>FishingForestGrazingCropl<strong>and</strong>CarbonExploring the Ecological FootprintEvery human activity uses biologically productive l<strong>and</strong> <strong>and</strong>/or fishing grounds. The Ecological Footprint is the sumof these areas, regardless of where they are located on theplanet (Figure 22).CarbonRepresents the amount of forest l<strong>and</strong> thatcould sequester CO2 emissions from theburning of fossil fuels, excluding thefraction absorbed by the oceans whichleads to acidification.Cropl<strong>and</strong>Represents the amountof cropl<strong>and</strong> used to growcrops for food <strong>and</strong> fibrefor human consumptionas well as for animal feed,oil crops <strong>and</strong> rubber.ForestRepresents the amountof forest required tosupply timber products,pulp <strong>and</strong> fuel wood.Figure 22 : Exploringthe Ecological FootprintBuilt-up L<strong>and</strong>Represents the amountof l<strong>and</strong> covered byhuman infrastructure,including transportation,housing, industrialstructures <strong>and</strong> reservoirsfor hydropower.Grazing L<strong>and</strong>Represents theamount of grazingl<strong>and</strong> used to raiselivestock for meat,dairy, hide <strong>and</strong>wool products.Fishing GroundsCalculated from theestimated primaryproduction requiredto support the fish<strong>and</strong> seafood caught,based on catch datafor marine <strong>and</strong>freshwater species.WWF Living Planet Report 2012 page 38 Chapter 1: The state of the planet page 39
What does “ecological overshoot” mean?Humanity’s annual dem<strong>and</strong> on the natural world has exceededwhat the Earth can renew in a year since the 1970s. This “ecologicalovershoot” has continued to grow over the years, reaching a 50 percent deficit in 2008. This means that it takes 1.5 years for the Earthto regenerate the renewable resources that people use, <strong>and</strong> absorbthe CO2 waste they produce, in that same year.How can this be possible when there is only one Earth?Just as it is possible to withdraw money from a bank accountfaster than to wait for the interest this money generates, renewableresources can be harvested faster than they can be re-grown. Butjust like overdrawing from a bank account, eventually the resourcewill be depleted. At present, people are often able to shift theirsourcing when this happens; however at current consumptionrates, these sources will eventually run out of resources too –<strong>and</strong> some ecosystems will collapse even before the resource iscompletely gone.The consequences of excess greenhouse gases that cannotbe absorbed by vegetation are already being seen, with risinglevels of atmospheric CO2 causing increased global temperatures,climate change <strong>and</strong> ocean acidification. These impacts in turn placeadditional stresses on biodiversity <strong>and</strong> ecosystems <strong>and</strong> the veryresources on which people depend.Global hectares per capita3.532.521.510.50BIOCAPACITY =(SUPPLY)ECOLOGICAL FOOTPRINT =(DEMAND)Area x BioproductivityPopulation xConsumption xper personFootprintintensity1961 1970 1980 1990 2000 2008YearFigure 23: Trends in Ecological Footprint <strong>and</strong> <strong>biocapacity</strong> per personbetween 1961 <strong>and</strong> 2008The decline in <strong>biocapacity</strong> per capita is primarily due to an increase in globalpopulation. More people have to share the Earth’s resources. The increase in theEarth’s productivity is not enough to compensate for the dem<strong>and</strong>s of this growingpopulation (Global Footprint Network, 2011).1.5 yearsto generatethe renewableresources usedin 2008OVERSHOOTFigure 24: Factorsdriving EcologicalFootprint <strong>and</strong><strong>biocapacity</strong> (GlobalFootprint Network, 2011)Biocapacity factorsBioproductive area: The area availableof cropl<strong>and</strong>, grazing l<strong>and</strong>, fishing grounds<strong>and</strong> forests.Bioproductivity per hectare: Anarea’s productivity can vary each year <strong>and</strong>depends on factors such as ecosystemtype, management <strong>and</strong> health, agriculturalpractices <strong>and</strong> weather. Productivity canbe enhanced to achieve more <strong>biocapacity</strong>,however this often comes at the costof a larger Ecological Footprint. Forexample, energy-intensive agriculture <strong>and</strong>heavy reliance on fertilizer may increaseyields, but requires increased inputs <strong>and</strong>generates higher CO2 emissions.Biocapacity <strong>and</strong> Ecological Footprint trendsThe Ecological Footprint is driven by consumer habits <strong>and</strong> theefficiency with which goods <strong>and</strong> services can be provided. Thegrowing <strong>biocapacity</strong> deficit – defined as when a population usesmore <strong>biocapacity</strong> than can be supplied <strong>and</strong> regenerated in a year– is driven by the combination of high consumption rates that areincreasing more rapidly than improvements in efficiency (increasingpeople’s footprint); <strong>and</strong> populations growing faster than thebiosphere’s capacity (driving down <strong>biocapacity</strong> per person).Ecological Footprint driversPopulation growth: The growingnumber of consumers is a strong driverbehind the increasing global footprint.The human population is forecast to reach7.8-10.9 billion people by 2050, with amedium estimate of just over 9.3 billion(UN, 2010). Population size also affectsthe <strong>biocapacity</strong> available to each person.Consumption of goods <strong>and</strong> servicesper person: Different populationsconsume different quantities of goods<strong>and</strong> services, primarily based on theirincome level.Footprint Intensity: The efficiency withwhich natural resources are convertedinto goods <strong>and</strong> services affects the size ofthe footprint of every product consumed.This varies between countries.WWF Living Planet Report 2012 page 40 Chapter 1: The state of the planet page 41
Mapping the Ecological FootprintNational trends for Ecological Footprint have changed overthe years <strong>and</strong> generally increased. Figure 25 shows the averageEcological Footprint per person per country in 1961 (whenNational Footprint Accounts started) <strong>and</strong> again in 2008.1961Figure 25: ChangingEcological Footprintper personGlobal map of nationalEcological Footprint perperson in (a) 1961 <strong>and</strong> (b)2008 (Global FootprintNetwork, 2011).Gha per capitaEcological Footprint – the number of global hectares dem<strong>and</strong>ed per person1210864Different countries have different footprintsAn individual’s Ecological Footprint varies significantlydepending on a number of factors, including their countryof residence, the quantity of goods <strong>and</strong> services they consume,the resources used <strong>and</strong> the wastes generated to provide thesegoods <strong>and</strong> services. If all of humanity lived like an averageIndonesian, for example, only two-thirds of the planet’s<strong>biocapacity</strong> would be used; if everyone lived like an averageArgentinean, humanity would dem<strong>and</strong> more than half anadditional planet; <strong>and</strong> if everyone lived like an averageresident of the USA, a total of four Earths would be requiredto regenerate humanity’s annual dem<strong>and</strong> on nature.Figure 26: EcologicalFootprint per country,per person, 2008This comparison includesall countries withpopulations greater than 1million for which completedata are available (GlobalFootprint Network, 2011).KeyBuilt-up l<strong>and</strong>FishingForestGrazingCropl<strong>and</strong>CarbonHow much of a country’s footprint is determinedby individuals?The size of a person’s Ecological Footprint depends on developmentlevel <strong>and</strong> wealth, <strong>and</strong> in part on the <strong>choices</strong> individuals make onwhat they eat, what products they purchase <strong>and</strong> how they travel.But decisions undertaken by governments <strong>and</strong> businesses have asubstantial influence on the Ecological Footprint too. For example,individuals generally have no direct control over the size of thebuilt-up l<strong>and</strong> footprint. The same is true for the way in which acountry produces its electricity or the intensity of its agriculturalproduction. This “inherited” part of the Ecological Footprint can beinfluenced through mechanisms such as political engagement, greentechnology <strong>and</strong> innovation, <strong>and</strong> other work toward large-scale socialchange. Governments <strong>and</strong> businesses therefore play an importantrole in reducing the Ecological Footprint of each person.if everyone lived like an averageresident of the USA, a total of fourEarths would be required to regeneratehumanity’s annual dem<strong>and</strong> on natureWorld average Ecological Footprint per person was 2.7 gha in 2008< 11 - 22 - 33 - 55 - 82WWF Living Planet Report 2012 page 42Insufficient data0QatarKuwaitUnited Arab EmiratesDenmarkUnited States of AmericaBelgiumAustraliaCanadaNetherl<strong>and</strong>sIrel<strong>and</strong>Finl<strong>and</strong>SingaporeSwedenOmanMongoliaMacedonia TFYRAustriaCzech RepublicSloveniaUruguaySwitzerl<strong>and</strong>GreeceFranceNorwaySpainEstoniaUnited KingdomSlovakiaKorea, Republic ofGermanyMauritiusItalyRussian FederationLithuaniaNew Zeal<strong>and</strong>CroatiaJapanKazakhstanPortugalSaudi ArabiaBelarusTurkmenistanIsraelLatviaPol<strong>and</strong>MalaysiaHungaryBulgariaMexicoChileUkraineLibyan Arab JamahiriyaVenezuela, Bolivarian Republic ofParaguayPanamaBrazilMauritaniaLebanonBotswanaRomaniaBosnia <strong>and</strong> HerzegovinaArgentinaPapua New GuineaIran, Islamic Republic ofBoliviaSouth AfricaSerbiaTurkeyCosta RicaThail<strong>and</strong>EcuadorJordanChinaMoldovaEgyptNamibiaPeruEl SalvadorAzerbaijanMyanmarCubaChadMaliUzbekistanGabonAlbaniaColombiaGuatemalaTunisiaGhanaArmeniaHondurasJamaicaGuineaAlgeriaSudanUg<strong>and</strong>aNicaraguaSenegalBurkina FasoSyrian Arab RepublicSwazil<strong>and</strong>SomaliaNigeriaGeorgiaDominican RepublicIraqGambiaVietnamCentral African RepublicBeninMoroccoKorea, Democratic People's Republic ofLao, People's Democratic RepublicKyrgyzstanLiberiaSri LankaCambodiaTanzania, United Republic ofZimbabweMadagascarEthiopiaSierra LeoneIndonesiaGuinea-BissauCameroonCongoLesothoTogoPhilippinesKenyaTajikistanAngolaYemenIndiaBurundiZambiaMozambiqueMalawiNepalCongo, Democratic Republic ofPakistanRw<strong>and</strong>aBangladeshEritreaHaitiAfghanistanTimor-LesteOccupied Palestinian Territory
2008Gha per capita< 11 - 22 - 33 - 55 - 8Insufficient dataWWF Living Planet Report 2012 page 45Figure 27: TotalBiocapacity percountry in 2008Data are given inglobal hectares (GlobalFootprint Network, 2011).Key> 1,000 million100 - 1,000 million10 - 1,000 million< 10 millionInsufficient dataMapping <strong>biocapacity</strong>Biocapacity takes into account the biologicallyproductive areas available globally, as well astheir productivity. Figure 27 shows the total<strong>biocapacity</strong> available in each country of theworld, figure 28 shows the top ten <strong>biocapacity</strong>richcountries. Nations with high <strong>biocapacity</strong>Figure 27: Total <strong>biocapacity</strong>per person, such as Gabon, Bolivia <strong>and</strong> Canada,per county in 2008tend to have extensive forest areas. The amount Data are given in global hectaresof grazing l<strong>and</strong> is also a key contributing factor (Global Footprint Network, 2011).for other <strong>biocapacity</strong> leaders, such as Mongolia<strong>and</strong> Australia. The high per capita <strong>biocapacity</strong>of these large countries can also be attributed totheir relatively small populations.WWF Living Planet Report 2012 page 46Number of global hectares available per person30252015420Different countries, different biocapacitiesSome countries with high <strong>biocapacity</strong> do not have a largenational footprint. Bolivia, for example, has a per capitafootprint of 2.6 gha <strong>and</strong> a per capita <strong>biocapacity</strong> of 18 gha.However it is worth noting that this <strong>biocapacity</strong> may well bebeing exported <strong>and</strong> utilized by other nations. For example,the Ecological Footprint of a citizen of United Arab Emirates(UAE) is 8.4 gha, but within the country there is only 0.6 ghaof <strong>biocapacity</strong> available per person. The residents of UAE aretherefore dependent on the resources of other nations to meettheir needs. As resources are becoming more constrained,competition is growing; the disparity between resource-rich<strong>and</strong> resource-poor nations is highly likely to have strong geopoliticalimplications in the future.Figure 29:Biocapacity perperson in 2008, bycountryThis comparisonincludes all countrieswith populationsgreater than 1 millionfor which complete dataare available (GlobalFootprint Network, 2011).KeyBuilt-up L<strong>and</strong>FishingForestGrazingCropl<strong>and</strong>Figure 28: Top 10 nationalbiocapacities in 2008Ten countries accounted for morethan 60% of the Earth’s total<strong>biocapacity</strong> in 2008. This includes fiveof the six BRIICS countries: Brazil,Russia, India, Indonesia <strong>and</strong> China(Global Footprint Network, 2011).Rest of the worldBrazil 15.4%China 9.9%United States of America 9.8%Russian Federation 7.9%India 4.8%Canada 4.2%Australia 2.6%Indonesia 2.6%Argentina 2.4%Congo, Democratic Republic of 1.6%World average <strong>biocapacity</strong> per person was 1.8 gha in 2008GabonBoliviaMongoliaCanadaAustraliaCongoFinl<strong>and</strong>ParaguayNew Zeal<strong>and</strong>UruguayBrazilSwedenEstoniaCentral African RepublicNamibiaArgentinaLatviaRussian FederationNorwayMauritaniaDenmarkLithuaniaColombiaUnited States of AmericaPeruBotswanaChilePapua New GuineaKazakhstanIrel<strong>and</strong>Guinea-BissauBelarusAustriaTurkmenistanChadCongo, Democratic Republic ofVenezuela, Bolivarian Republic ofFranceAngolaLiberiaGuineaCroatiaMadagascarSlovakiaHungaryCzech RepublicPanamaBulgariaSloveniaMalaysiaSudanNicaraguaRomaniaZambiaMaliUkraineMyanmarMozambiqueOmanEcuadorQatarPol<strong>and</strong>HondurasGermanyCameroonCôte d'IvoireSierra LeoneLao, People's Democratic RepublicBosnia <strong>and</strong> HerzegovinaCosta RicaGreeceMacedonia TFYREritreaSpainMexicoSerbiaSenegalBurkina FasoSomaliaUnited KingdomBelgiumMoldovaKyrgyzstanIndonesiaTurkeyPortugalGhanaSouth AfricaSwitzerl<strong>and</strong>Thail<strong>and</strong>GeorgiaGambiaItalyNigeriaVietnamGuatemalaNetherl<strong>and</strong>sTanzania, United Republic ofCambodiaBeninSwazil<strong>and</strong>TunisiaUzbekistanAlbaniaChinaTimor-LesteIran, Islamic Republic ofLesothoUg<strong>and</strong>aArmeniaKorea, Republic ofAzerbaijanZimbabweCubaMoroccoTogoMalawiLibyan Arab JamahiriyaEgyptSaudi ArabiaEthiopiaUnited Arab EmiratesEl SalvadorKorea, Democratic People's Republic ofPhilippinesYemenJapanSyrian Arab RepublicAlgeriaMauritiusTajikistanDominican RepublicNepalKenyaRw<strong>and</strong>aIndiaSri LankaBurundiKuwaitBangladeshAfghanistanPakistanLebanonJamaicaHaitiIsraelIraqJordanOccupied Palestinian TerritorySingapore38.8%
A focus on emerging economies:BRIICS countriesThe rapid economic expansion of Brazil, Russia, India, Indonesia,China <strong>and</strong> South Africa – the so-called BRIICS group – meritspecial attention when looking at the Ecological Footprint <strong>and</strong> thepressure on <strong>biocapacity</strong>. High population growth in the BRIICSgroup along with increasing average consumption per personare contributing to an economic transformation. As a result, theBRIICS economies are exp<strong>and</strong>ing more rapidly than those ofhigh-income countries. This growth will bring important socialbenefits to these countries. The challenge, however, is to dothis sustainably.Figure 30 highlights BRIICS countries’ consumption trendsby showing the Ecological Footprint associated with the directexpenditure of an average individual or resident (also known as“household consumption”) broken down into five categories: food,housing, transport, goods <strong>and</strong> services. (More information aboutthe Consumption L<strong>and</strong> Use Matrix – or CLUM – models on whichthese figures are based can be found in the glossary at the backof this report). Citizens of lower-income BRIICS countries havea far larger proportion of their footprint associated with directexpenditure on food than they do on other categories. In Brazil,India <strong>and</strong> Indonesia, food accounts for more than 50 per cent ofthe total household footprint. The remaining portion is split almostequally among goods, transportation <strong>and</strong> housing. As the BRIICSnations become wealthier, <strong>and</strong> the average Ecological Footprintincreases, consumption patterns increasingly mirror high-incomecountries. South Africa <strong>and</strong> China, for example, are moving towarda more equal split between each of the consumption categories,indicative of industrialisation <strong>and</strong> increased income.BRIICS economies areexp<strong>and</strong>ing rapidly –the challenge is todo this sustainablyFigure 30: Breakdownof the per capitahousehold EcologicalFootprint as apercentage of the USAin 2008 in BRIICScountries – based onthe Ecological Footprintassociated with the directhousehold expenditure onfood, housing maintenance<strong>and</strong> operations, personaltransportation, goods, <strong>and</strong>services (Global FootprintNetwork, 2011).Breakdown of per capitaEcological FootprintFoodHousingTransportationGoodsServicesUSA =100%India = 12%Russia = 61.2%Indonesia = 15.7%China = 29.6%Brazil = 40.8%South Africa = 36%WWF Living Planet Report 2012 page 49WWF Living Planet Report 2012 page 50Chapter 1: The state of the planet page 51
population,URBANIZATION <strong>and</strong>DEVELOPMENTThe growing human population will clearly impact onbiodiversity <strong>and</strong> the size of humanity’s Ecological Footprint.However the impact of population on the state of theplanet is not just about absolute numbers: Each person’sconsumption of goods <strong>and</strong> services, as well as the resourcesused <strong>and</strong> waste generated in providing these goods <strong>and</strong>services, also play a role.© Susetta Bozzi / WWF-ChinaNanjing Road, Shanghai, China.
Population, development<strong>and</strong> urbanizationHuman population dynamics are a major driving force behindenvironmental pressure. One aspect of this is the overall size ofthe global population, which has more than doubled since 1950– to 7 billion in 2011 <strong>and</strong> is forecast to reach just over 9.3 billionpeople by 2050 (UN, 2010; median estimate). Much of this increaseis projected to come from countries with high fertility – primarilyin Africa <strong>and</strong> Asia, but also in Latin America <strong>and</strong> North America(UNFPA, 2011; Figure 31).Number of people (thous<strong>and</strong>s)0195012,000,00010,000,0008,000,0006,000,0004,000,0002,000,0001960197019801990200020102020Population, income <strong>and</strong> Ecological FootprintOn a global scale, both population <strong>and</strong> the average per capitafootprint have increased since 1961. However, the relativecontribution of each to the overall increased Ecological Footprintis different in different regions (Figure 33).The largest per capita footprint increases between 1961 <strong>and</strong>2008 were in the European Union <strong>and</strong> the Middle East/CentralAsia, which increased by 1.2 <strong>and</strong> 1.1 gha per person, respectively.Despite North America having a smaller increase (0.6 gha perperson), it maintained the highest regional footprint over thisperiod (7.1 gha per capita).2030Year2040205020602070208020902100Figure 31: Regional<strong>and</strong> global populationgrowth between 1950<strong>and</strong> 2100Projected population byregion, medium variantbetween 1950 <strong>and</strong> 2011(UNFPA, 2011). In 2011,the global populationreached 7 billion people.Based on estimated birthrates, Asia will remainthe most populous regionduring the 21 st century, butAfrica will gain ground asits population more thantriples, passing from 1billion in 2011 to 3.6 billionin 2100. Africa’s populationhas been growing at 2.3%per year, more than doublethe rate of Asia’s population(1% per year). The rateof population growth isexpected to slow after 2050.Note that in this figure, Asiaincludes the Middle East<strong>and</strong> Oceania is displayedseparately.KeyOceaniaNorthern AmericaLatin America &The CaribbeanEuropeAsiaAfricaFigure 32: Globalgeographic groupingsFigure 33: EcologicalFootprint bygeographic grouping,in 1961 <strong>and</strong> 2008Change in the average4footprint per person <strong>and</strong>population for each of theworld’s regions (Figure 32).The area within eachbar represents the totalfootprint for each region(Global Footprint Network,2011). 0KeyNorthern AmericaEUOther EuropeLatin AmericaMiddle East/Central AsiaAsia-PacificAfricaIn the Asia-Pacific region, the footprint grew by 0.6 gha per person,but more significantly the population doubled from 1.6 billionpeople in 1961 to 3.7 billion in 2008. Similarly, although the averageper person footprint in Africa decreased by 0.07 gha per personbetween 1961 <strong>and</strong> 2008, rapid population growth led to a muchlarger overall footprint, over triple the value of 1961.Ecological Footprint (gha per capita)Ecological Footprint (gha per capita)88400 10000 1000Biocapacity available per person in 1961 (3.2 gha)2000 3000 4000 5000 6000Population (millions)2000 3000 4000 5000 6000Population (millions)19612008Biocapacity available per person in 2008 (1.8 gha)WWF Living Planet Report 2012 page 54 Chapter 1: The state of the planet page 55
People with different incomeshave different footprintsThe per capita Ecological Footprint of high-income nations dwarfsthat of low- <strong>and</strong> middle-income countries. High-income countrieshave historically had the most rapid increase in per capita footprint.This was principally due to growth in the carbon component of theper capita footprint – by 1.6 times between 1961 <strong>and</strong> 1970.In contrast, middle- <strong>and</strong> low-income countries had dem<strong>and</strong>edless than the average per capita <strong>biocapacity</strong> available globally, until2006 when middle-income countries exceeded this value.Middle-income countries include many of the world’semerging economies, including the BRIICS countries: Brazil,Russia, India, Indonesia, China <strong>and</strong> South Africa. Overall,population has more than doubled since 1961, while the footprintper person has increased by 65 per cent, largely associated withincreased industrialization. Although population growth is slowingin some places, further population increases, together with a riseof middle class consumption patterns in emerging economies, havethe potential to increase humanity’s global footprint dramatically inthe near future.The citizens of low-income countries have, on average, asmaller footprint today than they had in 1961 – a reduction of0.01 gha per person. However, rapid population growth in thesecountries (4.3 times, since 1961) has led to an overall 323 per centincrease in the total Ecological Footprint of low-income countriessince 1961.Ecological Footprint (gha per capita)7654321Figure 34: Countries inhigh, middle <strong>and</strong> lowincome categoriesKeyKeyHigh IncomeMiddle IncomeLow IncomeThe EcologicalFootprint of lowincomecountrieshas increased by323 per cent since1961 due to rapidpopulation growthFigure 35: Changesin the EcologicalFootprint per personin high-, middle- <strong>and</strong>low-income countriesbetween 1961 <strong>and</strong> 2008The black line representsworld average <strong>biocapacity</strong>in 2008 (Global FootprintNetwork, 2011).High IncomeMiddle IncomeThe Living PlanetIndex for lowincomecountrieshas declined by60 per centFigure 36: LivingPlanet Index bycountry income groupThe index shows a 7%increase in high-incomecountries, a 31% decline inmiddle-income countries<strong>and</strong> a 60% decline in lowincomecountries between1970 <strong>and</strong> 2008 (WWF/ZSL, 2012).KeyHigh IncomeMiddle IncomeLow IncomeConfidence limitsThe Living Planet Index shows that declines in biodiversity aregreatest in low-income countries. The analyses presented earlierin this report show strong geographic differences in biodiversityloss, particularly between tropical <strong>and</strong> temperate regions. Todemonstrate that these differences are not only geographic orbiophysical in nature, species’ population data (except for marinepopulations in international waters) were divided into three countryincome categories (see “Country Income Categories” in Annex 3).The Living Planet Index for high-income countries showsan increase of 7 per cent between 1970 <strong>and</strong> 2008 (Figure 36). Thisis likely to be due to a combination of factors, not least of whichbeing that these nations are able to purchase <strong>and</strong> import resourcesfrom lower-income countries, thereby simultaneously degradingthe biodiversity in those countries while maintaining the remainingbiodiversity <strong>and</strong> ecosystems in their own “back yard”.In stark contrast, the index for middle-income countries hasdeclined by 31 per cent, <strong>and</strong> most alarmingly the index for lowincomecountries has declined by 60 per cent. The trend in lowincomecountries is potentially catastrophic, not just for biodiversitybut also for the people living there. While everyone dependsultimately on the biodiversity that provides ecosystem services<strong>and</strong> natural assets, the impact of environmental degradation is feltmost directly by the world’s poorest people, particularly by ruralpopulations, <strong>and</strong> forest <strong>and</strong> coastal communities. Without accessto l<strong>and</strong>, clean water, adequate food, fuel <strong>and</strong> materials; vulnerablepeople cannot break out of the poverty trap <strong>and</strong> prosper.Index Value (1970 = 1)21+7%-31%-60%0Low Income01961 1970 1980 1990 2000 2008Year1970 19751980 1985 1990 1995 2000 2005 2008YearWWF Living Planet Report 2012 page 56 Chapter 1: The state of the planet page 57
Exp<strong>and</strong>ing cities, increasing footprintsMore than 50 per cent of the global population now lives inurban areas. This figure is expected to increase, as the world israpidly urbanizing, particularly in Asia <strong>and</strong> Africa. Urbanizationusually comes in t<strong>and</strong>em with increasing income, which in turnleads to growing Ecological Footprints, particularly throughgrowth in carbon emissions (Poumanyvong <strong>and</strong> Kaneko, 2010).For example, the average Ecological Footprint of a Beijingresident is nearly three times larger than the China average(Hubacek et al., 2009).Globally, urban residents are already responsible formore than 70 per cent of the fossil fuel related CO2 emissions.However, well planned cities can also reduce direct carbonemissions by good management of the density <strong>and</strong> availabilityof collective transport. For example, per capita emissions inNew York City are 30 per cent less than the United Statesaverage (Dodman, 2009).According to forecasts, the global urban populationwill almost double to 6 billion by 2050 (UNFPA, 2007) <strong>and</strong>US$350 trillion will be spent globally on urban infrastructure<strong>and</strong> usage over the next three decades. If this investment follows“business as usual”, this growth will appropriate more than halfof humanity’s carbon budget for the next 90 years – in just 30years (WWF, 2010b; Höhne <strong>and</strong> Moltmann, 2009).The growth of small citiesCities with fewer than 1 million inhabitants alreadyaccount for more than 60 per cent of urban dwellersglobally (UNFPA, 2007). Figure 37 shows that the bulk ofurban population growth will not occur in well-known <strong>and</strong>mature megacities such as Beijing, London, Los Angeles,Mexico City <strong>and</strong> Mumbai (all with more than 10 millionpeople). Instead, it will occur in smaller cities (fewer than1 million). For example, the population of Gaborone, thecapital of Botswana, rose from 17,700 in 1971 to more than186,000 in 2007. By 2020, its population is expected toexceed 500,000.LOSANGELES17.9Urban Population Growth Rate (%)54321MEXICO84.39277%MEXICOCITY22.14.19%1.98%1.56%1.37%1.16%010City Size (million people)Figure 37: Projectedurban populationgrowth rates by citysize (2009-2025)Source: UN PopulationDivision; Booz & Companyanalysis (WWF, 2010b).US246.281%CANADA26.380%COLOMBIA34.373%PERU21.073%CHILE14.688%NEW YORK21.8VENEZUELA2694%ARGENTINA35.690%LOSANGELES17.9MEXICO84.39277%MEXICOCITY22.1BRAZIL162.685%BUENOSAIRES13.5UK5490%LONDONUS12246.281%RIO DEJANEIRO12.2SÃO PAULO20.4CANADA26.380%SPAIN33.677%IVORYCOAST8.6COLOMBIA34.373%PERU21.073%CHILE14.688%NETHERLANDS13.381%BELGIUM10.297%FRANCE46.977%MOROCCO19.460%NEW YORK21.8GHANA11.349% VENEZUELA2694%ARGENTINA35.690%SWEDEN7.6GERMANY6275%LAGOS10.0ITALY39.668%BRAZIL162.685%BUENOSAIRES13.5CZECHREPUBLIC7.4TUNISIAALGERIA22.0NIGERIA68.650%CAMEROON9.5POLAND23.962%KeyCAIRO15.9ANGOLA9.3EGYPT33.143%SUDAN16.343%CONGO, DR OF20.233%UK5490%UKRAINE30.9LONDON68%12ROMANIA11.654MOZAM-BIQUERIO DEJANEIROS AFRICA12.228.660%SÃO PAULO20.4Cities over10 million people(greater urban area)Predominantlyurban 75% or overPredominantlyurban 50 - 74%IVORYCOAST8.6NETHERLANDS13.381%BELGIUM10.297%FRANCEISTANBUL46.911.777%TURKEYSPAIN51.133.677% 68%SYRIA IRAQ10.2 20.351%67% MOROCCO19.4SAUDI ARABIA 60%20.981%ETHIOPIA1316%KENYA7.6TANZANIA9.925%Urban 0 - 49%RUSSIA103.673%GHANA11.349%MOSCOWSWEDEN13.4 7.6GERMANY6275%TEHERAN12.1IRAN48.468%LAGOS10.0ITALY39.668%POLAND23.962%CZECHREPUBLIC7.4TUNISIAALGERIA22.0KARACHI14.8NIGERIA68.650%NEW DELHICAMEROON21.1 9.5MUMBAI21.3UZBEKISTAN10.137%AFGHAN-ISTAN7.8KAZAKH-STAN8.6CAIROPAKISTAN 15.959.336% EGYPT33.143%CONGO, DR OF20.233%ANGOLA9.3In 2050, two out of every threepeople will live in a city (UN, 2009)TODAY’S URBAN POPULATION:3,307,905,000Figure 38: The number of people living in cities in each country ofthe world in 2010, together with the percentage of the population incountries with large urban populations.In the developed world, the proportion of people living in cities is typically higherthan 75%, <strong>and</strong> often exceeds 85%. The largest urban population in the developedworld is in the USA (246 million). However, in China, even though the proportion ofpeople living in cities is under 50%, the total number of urban dwellers is greatest(559 million). In India, by comparison, the number is 329 million (UN populationdivision). (Figure drawn by the World Business Council for Sustainable Developmentin WBCSD, 2012, based on data from the UN Population Division UN, 2010)SUDAN16.343%S AFRICA28.660%UKRAINE30.968%ROMANIA11.654RUSSIA103.673%ISTANBUL11.7TURKEY51.168%SYRIA10.251%INDIA329.3ETHIOPIA16%13KENYA7.6TANZANIA29% 25%9.9MOZAM-BIQUEIRAQ20.367%SAUDI ARABIA20.981%MOSCOW13.4CHINATEHERAN12.1559.2IRAN48.442% 68%BANGLADESH38.226%BEIJING12.7DHAKANEW DELHI13.8KOLKATA 21.115.5MUMBAI21.3SHANGHAI17.3KAZAKH-STAN8.6UZBEKISTAN10.137%AFGHAN-ISTAN7.8PAKISTAN59.336%KARACHI MYANMAR14.8 16.532%GUANDONG7.3VIETNAM23.327%THAILAND21.533%MALAYSIA18.169%N KOREA14.162%INDIA329.329%JAKARTA14.9S KOREA39.081%SEOUL23.2INDONESIA114.150%CHINA559.242%OSAKA16.6BEIJING12.7MYANMAR16.5PHILIPPINES32%MANILA55 BANGLADESH15.438.264% 26%AUSTRALIA18.389%JAPAN84.766%DHAKA13.8KOLKATA15.5TOKYO33.4SHANGHAI17.3GUANDONG7.3VIETNAM23.327%THAILAND21.533%MALAYSIA18.169%N KOREA14.162%JAKARTA14.9S KOREA39.081%SEOUL23.2INDONESIA114.150%OSAKA16.6PHILIPPINES5564%AUSTRALIA18.389%JAPAN84.766%MANILA15.4TOKYO33.4WWF Living Planet Report 2012 page 58 Chapter 1: The state of the planet page 59
Ecological Footprint <strong>and</strong> sustainabledevelopmentIs a high level of consumption necessary for a high level ofdevelopment? Currently the most widely used indicator fordevelopment is the United Nations Development Programme’s(UNDP) Human Development Index (HDI) which – bycombining per capita income, life expectancy <strong>and</strong> educationalattainment – compares countries’ economic <strong>and</strong> socialdevelopment (UNDP, 2009. For the latest report see, UNDP,2011). The world’s average HDI has increased by 41 per centsince 1970, reflecting large improvements in life expectancy,school enrolment, literacy <strong>and</strong> income.Some low-income countries are able to increase theirHDI at a relatively fast rate, primarily because they have sucha small HDI in the first place <strong>and</strong> can rapidly capitalize onmany improvements that can be implemented. However, somelow-income nations are stagnated at their current HDI level(for example, Zimbabwe). The tendency is for the transitionaleconomies to have the largest improvements in their HDI.Figure 39 below shows the HDI of each country plotted againstits Ecological Footprint.Like all averages, the HDI conceals disparities in hum<strong>and</strong>evelopment in individual countries <strong>and</strong> does not take intoaccount other important variables, such as inequality.HDIWorld average <strong>biocapacity</strong> per person in 2008Low HumanDevelopmentMediumHumanDevelopmentHigh HumanDevelopmentVery HighHumanDevelopmentMeets minimum criteriafor sustainability00.0 0.20.4 0.6 0.8 1.0Human Development Index (HDI)12108642Ecological Footprint (global hectares per person)Figure 39: TheEcological Footprintfor each countryversus the HumanDevelopment Index,2008The dot representing eachcountry are colouredaccording to theirgeographic region <strong>and</strong>are scaled relative to itspopulation The shadingin the background ofthis figure <strong>and</strong> in figure40 indicates the HDIthresholds for low, medium,high <strong>and</strong> very high hum<strong>and</strong>evelopment <strong>and</strong> are basedon UNDP, 2010 (GlobalFootprint Network, 2011).KeyNorthern AmericaEUOther EuropeLatin AmericaMiddle East/Central AsiaAsia-PacificAfricaFigure 40: TheEcological Footprintfor each country(in 2008) versus theInequality-adjustedHuman DevelopmentIndex (in 2011)The Inequality-adjustedHDI (IHDI) accountsfor inequality in each ofthe three dimensions ofthe HDI – education, lifeexpectancy <strong>and</strong> income percapita – by “discounting”the average value of eachone according to its levelof inequality. Therefore,although the general shapeof this graph is the sameas in Figure 39, manycountries have moved tothe left. Countries with lesshuman development tendto have greater inequalityin more dimensions – <strong>and</strong>thus see larger losses intheir HDI value. Note: Thedevelopment thresholdsare the same in both thisfigure <strong>and</strong> Figure 39 tomake it easier to comparethe two of them. The IHDIvalues shown here are from2011 - for more informationsee UNDP, 2011 (GlobalFootprint Network, 2011).Development within one planet boundariesA new version of the HDI developed for the 2011 HumanDevelopment Report allows the HDI to take into account howachievements in health, education <strong>and</strong> income are distributed(UNDP, 2011). This new version of the index – called the InequalityadjustedHuman Development Index or IHDI – is a measure ofhuman development that accounts for societal inequality.Under perfect equality, the IHDI is equal to the HDI; but itprogressively falls below the HDI as inequality rises. In this sense,the IHDI is the actual level of human development, while the HDIcan be viewed as an index of the potential human developmentthat could be achieved if there is no inequality. The IHDI“discounts” each dimension’s average value according to its levelof inequality. Countries with less human development tend to havegreater inequality in more dimensions – <strong>and</strong> thus larger losses inhuman development.The average loss in the HDI due to inequality is about 23 percent – that is, adjusted for inequality, the global HDI of 0.682 in2011 would fall to 0.525.What does the relationship between the Ecological Footprint<strong>and</strong> this new index mean? Linking Ecological Footprint <strong>and</strong> IHDIreinforces the conclusion that the majority of countries withhigh IHDI have improved the well-being of their citizens at theexpense of a larger footprint. Lower IHDI nations, which strivetoward higher development levels, have smaller footprints, butthey have higher inequality, making their development goalsharder to meet. Concerted, collective efforts are needed to providethe environmental space for countries to pursue sustainabledevelopment objectives.IHDIWorld average <strong>biocapacity</strong> per person in 2008Low HumanDevelopmentMediumHumanDevelopmentHigh HumanDevelopment0.0 0.20.4 0.6 0.8Inequality-Adjusted Human Development Index (IHDI)Very HighHumanDevelopmentMeets minimum criteriafor sustainability1210864201.0Ecological Footprint (global hectares per person)WWF Living Planet Report 2012 page 60 Chapter 1: The state of the planet page 61
THE Water FootprintThe Water Footprint provides a global indicator of bothdirect <strong>and</strong> indirect freshwater use. The focus on freshwateris important because it is scarce; making up only 2.5 percent of the water on the planet, 70 per cent of which islocked up in the ice <strong>and</strong> snow of mountainous regions, theArctic <strong>and</strong> Antarctic. Whereas the Ecological Footprintcalculates the amount of <strong>biocapacity</strong> (global hectares)needed to sustain a population, the Water Footprint ofProduction represents the volume of freshwater (in cubicmetres per year, m 3 /y) used directly or indirectly to producegoods <strong>and</strong> services.© Istockphoto.com / WWF-CanadaCrops on a farm are watered using irrigation equipment.
the Water FootprintThe average global Water Footprint between 1996 <strong>and</strong> 2005was over 9,000 billion m 3 per year; with agricultural productionaccounting for 92 per cent of this total. Although out-of-sight,rainwater stored in soil (Green Water Footprint) was by far thelargest Water Footprint component (74 per cent), while blue waterresources accounted for 11 per cent (Hoekstra <strong>and</strong> Mekonnen,2012). The Water Footprint can be presented as a single number,or be broken down into its different components (Figure 41).Figure 41: Three ways of presenting the Water Footprint(a) In total <strong>and</strong> broken down into its three components; (b) Calculated for specific areas,such as a river basin, <strong>and</strong> (c) during different times in the year (adapted from ChapagainA.K. <strong>and</strong> Tickner, 2011; global Water Footprint data from Hoekstra <strong>and</strong> Mekonnen, 2012).a. Total Water Footprint of global production (9087 billion m 3 /yr)11%74%15%Green Water Footprint: Rainwater that evaporates duringthe production of goods. For agricultural products, this isthe rainwater stored in soil that evaporates from crop fields.Blue Water Footprint: Freshwater withdrawn from surfaceor groundwater sources that is used by people <strong>and</strong> notreturned; in agricultural products this is mainly accountedfor by evaporation of irrigation water from fields.Grey Water Footprint: Water required to dilute pollutantsreleased in production processes to such an extent that thequality of the ambient water remains above agreed waterquality st<strong>and</strong>ards.b. Water Footprints can be calculated for different locations (e.g., x, y, z)At least 2.7 billionpeople live inriver basins thatexperience severewater scarcityduring at least onemonth of the yearBlue Water FootprintVersus Blue Water AvailabilityAt least 2.7 billion people live in river basins that experience severewater scarcity during at least one month of the year. To providea more refined insight into water availability <strong>and</strong> dem<strong>and</strong> than isgenerally considered, a recent study (Hoekstra et al., 2012 ) hasanalysed the monthly Blue Water Footprint of 405 major riverbasins, in which 65 per cent of the global population reside. Aprecautionary approach was taken based on natural flows (theestimated flow through the river basin before any water is takenout), <strong>and</strong> the presumed environmental flow requirement (theamount of water needed to maintain the integrity of freshwaterecosystems), assumed to be 80 per cent of monthly natural run-off(Richter et al., 2011).If more than 20 per cent of the natural flow is being used bypeople, then the Blue Water Footprint is greater than the amountof blue water available <strong>and</strong> water stress will occur. Figure 42 showsthe number of months during the year in which blue water scarcityexceeded 100 per cent in the world’s major river basins between1996 <strong>and</strong> 2005; meaning that, during these months, more than 20per cent of the natural flow is being used by people.Million m 3 water/yearx y zThe Water Footprint<strong>and</strong> its componentsvary according tolocation. Locations canbe measured regionally,nationally or forindividual river basins.c. Water Footprints can now be calculated for different times of the yearSpring Summer Autumn WinterWithin each locationthe components can bemeasured from seasonto season <strong>and</strong> month tomonth (Figure 44).Number of months in whichwater scarcity > 100%Months inwhich waterscarcity> 100%1210 - 118 - 96 - 74 - 52 - 310no dataFigure 42: Blue water scarcity in 405 river basins between 1996<strong>and</strong> 2005The darkest blue shading indicates river basins where more than 20%of water available in the basin is being used throughout the year. Someof these areas are in the most arid areas in the world (such as inl<strong>and</strong>Australia) however other areas (such as western USA) have many monthsof water scarcity because significant amounts of water within these basinsare being channelled into agriculture (Hoekstra et al., 2012).WWF Living Planet Report 2012 page 64 Chapter 1: The state of the planet page 65
Water scarcity depends on the amount of water available <strong>and</strong> levelsof consumption in a river basin, not only the absolute size of theBlue Water Footprint. For example, even though the Blue WaterFootprint is not particularly large in eastern European <strong>and</strong> Asianriver basins in February or March, these basins (including theDniepr, Don, Volga, Ural, Ob, Balkhash <strong>and</strong> Amur) experience highwater scarcity in these months as the river flows are low during thisperiod (Figure 43).Industrial <strong>and</strong> domestic water supply is impacted if waterflows cannot be maintained. In the Yellow <strong>and</strong> Tarim river basinsin China, the most severe water scarcity is in early spring, whenrun-off is low <strong>and</strong> water dem<strong>and</strong> for irrigation is high. SouthAfrica’s Orange <strong>and</strong> Limpopo river basins experience water scarcityin September <strong>and</strong> October, <strong>and</strong> the Mississippi River basin in theUS in August <strong>and</strong> September, when the Blue Water Footprint ishighest <strong>and</strong> run-off is lowest (Hoekstra et al., 2012). A careful waterallocation mechanism that takes into account current <strong>and</strong> predictedfuture water uses <strong>and</strong> environmental requirements on monthlybasis, not on the basis of annual averages, is therefore necessary.FebruaryFigure 43: Water scarcityin the world’s majorriver basins in February<strong>and</strong> JuneLight blue shading indicateslow water scarcity, meaningthat presumed environmentalflow requirements are notcompromised <strong>and</strong> monthlyrun-off is unmodified or onlyslightly modified; bright blueshading indicates moderatewater scarcity (i.e., theBlue Water Footprint is20-30% of natural run-off)<strong>and</strong> environmental flowrequirements are not fullymet; dark blue shadingindicates significant waterscarcity (i.e., the Blue WaterFootprint is 30-40% of naturalrun-off); purple shadingindicates severe water scarcity(i.e., the Blue Water Footprintexceeds 40% of naturalrun-off). The differences inwater scarcity in the twomonths for many river basinshighlights the importanceof underst<strong>and</strong>ing waterscarcity at monthly time scales(Hoekstra et al., 2012).KeyNatural run-offMore than 40%30 - 40%20 - 30%0 - 20%Blue WaterFootprintRecently, for the first time, the Water Footprint Network has beenable to estimate the Blue Water Footprint at a high spatial resolution(at 5 by 5 arc minutes, which is a grid of about 9km by 9km at theequator <strong>and</strong> decreasing gradually toward the poles), on a monthlybasis. This detail of data on water availability throughout the year atriver basin level provides water planners <strong>and</strong> users with an importantplanning tool to ensure they make the most of this vital renewableresource. One example is given here <strong>and</strong> more can be found inHoekstra et al., 2012.Tigris-Euphrates BasinThe Tigris-Euphrates River Basin extends over four countries:Turkey, Syria, Iraq <strong>and</strong> Iran. Almost all of the run-off in the tworivers is generated in the highl<strong>and</strong>s of the northern <strong>and</strong> easternparts of the basin in Turkey, Iraq <strong>and</strong> Iran. Precipitation in thebasin is largely confined to the winter months of October to April,with high waters occurring from March to May – as snow melts inthe highl<strong>and</strong>s. The typical low water season occurs from June toDecember. The basin faces severe water scarcity for five months ofthe year (June to October). Most of the Blue Water Footprint (52 percent) is due to evaporation of irrigation water in agriculture, mostlyfor wheat, barley <strong>and</strong> cotton.Million m 3 per month1200010000800060004000JuneBlue water scarcity2000> 21.5 - 21 - 1.50.5 - 10.25 - 0.50 - 0.25no dataSeverity ofBlue waterscarcity0Jan Feb Mar Apr May Jun Jul Aug Sep Oct Nov DecMonthFigure 44: Water scarcity over the year for the Tigris-Euphrates Basin(monthly average for the period 1996-2005) The river run-off is dividedinto four zones – green, bright blue, dark blue <strong>and</strong> white – based on presumptiveenvironmental flow requirements. The actual Blue Water Footprint is plotted overthis hydrograph as a solid thick red line. If the line falls in the green zone, the waterscarcity is low, meaning that there is no abstraction from the environmental quota.However, if it moves up into the bright blue, dark blue or white zones, water scarcitybecomes moderate, significant or severe in that part of the year.WWF Living Planet Report 2012 page 66 Chapter 1: The state of the planet page 67
Chapter 2: Why weshould care~A satellite image features the heart-shaped northern tip of thewestern half of the Large Aral Sea (or South Aral Sea) in CentralAsia. Once the world’s fourth-largest inl<strong>and</strong> body of water, the AralSea has been steadily shrinking over the past 50 years since therivers that fed it were diverted for irrigation. In 2005, a dam wasbuilt between the sea’s northern <strong>and</strong> southern sections to helpimprove water resource management <strong>and</strong> reverse the man‐madeenvironmental disaster. The dam allowed the river to feed thenorthern Aral, which has begun to recover. It hasn’t solved theentire problem though, as the southern section is expected to dryout completely by 2020. The whitish area surrounding the lakebedis a vast salt plain, now called the Aralkum Desert, left behind bythe evaporating sea. It comprises some 40,000 sq km zone of dry,white salt <strong>and</strong> mineral terrain. Each year violent s<strong>and</strong>storms pick upat least 150,000 tonnes of salt <strong>and</strong> s<strong>and</strong> from Aralkum <strong>and</strong> transportthem across hundreds of kilometres, causing severe health problemsfor the local population <strong>and</strong> making regional winters colder <strong>and</strong>summers hotter.design note:Check for gutter <strong>and</strong> repeatimage if necessary© USGS
Linking biodiversity,ecosystem services<strong>and</strong> peopleCausal factorsPopulationConsumptionResource efficiency<strong>Biodiversity</strong> is vital for human health <strong>and</strong> livelihoods.Living organisms – plants, animals <strong>and</strong> microorganisms– interact to form complex, interconnected webs ofecosystems <strong>and</strong> habitats, which in turn supply a myriadof ecosystem services upon which all life depends.Although technology can replace some ecosystemservices <strong>and</strong> buffer against their degradation, manycannot be replaced.Underst<strong>and</strong>ing the interactions betweenbiodiversity, ecosystem services <strong>and</strong> people isfundamental to reversing the trends outlined in Chapter1 <strong>and</strong> achieving the <strong>better</strong> <strong>choices</strong> presented in Chapter4 – <strong>and</strong> so safeguarding the future security, health <strong>and</strong>well-being of human societies.All human activities make use of ecosystemservices – but can also put pressure on the biodiversitythat supports these systems.Recent scientific analyses (Naidoo et al., 2008;Larsen et al., 2011; Strassburg et al., 2010) show ameasureable correspondence between ecosystemservices <strong>and</strong> biodiversity, while global analyses such asThe Economics of Ecosystems <strong>and</strong> <strong>Biodiversity</strong> (TEEB),the Millennium Ecosystem Assessment (MEA) <strong>and</strong> theStern Report underline how humanity is wholly relianton well functioning ecosystems to supply essentialservices (Millennium Ecosystem Assessment, 2005a;b; c; Stern, 2006; TEEB, 2010).Indirect driversDirect pressureson biodiversity<strong>and</strong> ecosystemsState of Global<strong>Biodiversity</strong>ecosystem servicesFigure 45:Interconnections between people,biodiversity, ecosystem health <strong>and</strong>provision of ecosystem servicesAgriculture<strong>and</strong> forestryHabitat loss,alteration <strong>and</strong>fragmentationProvisioningservices• food• medicine• timber• fibre• bioenergyFishing <strong>and</strong>huntingTerrestrialOverexploitationRegulatingservicesUrban <strong>and</strong>industryInvasivespeciesFreshwaterSupportingservicesWater usePollutionThe benefits that people obtain from ecosystems• water filtration• waste decomposition• climate regulation• crop pollination• regulation of somehuman diseases• nutrient cycling• photosynthesis• soil formationCulturalservices• enriching• recreational• aesthetic• spiritualEnergy <strong>and</strong>transportClimatechangeMarineWWF Living Planet Report 2012 page 70 Chapter 2: Why we should care page 71
Margaret’s storyFor many people living in the industrialized <strong>and</strong> urbanregions, “nature” is a place to visit. Food comes from shops,<strong>and</strong> water from the tap. But for a large part of the planet’spopulation, the connection to nature <strong>and</strong> its services is moredirect. The livelihood opportunities of Margaret WanjiruMundia, a farmer in central Kenya, depend directly on thenatural environment surrounding her. But her needs are thesame as those of city dwellers. And all of these needs findtheir origin in what nature provides. Can underst<strong>and</strong>ingMargaret’s challenges <strong>and</strong> hopes help us <strong>better</strong> underst<strong>and</strong>the risks <strong>and</strong> opportunities facing our planet?© WWF-Canon / Simon RawlesWWF Living Planet Report 2012 page 72 Chapter 2: Why we should care page 73
Forests: Carbon storage<strong>and</strong> climateThe carbon storage service provided by the world’s forests is vitalfor climate stabilization. The amount of carbon stored in differentforests varies: Tropical forests store the most carbon, with currentestimates suggesting the above-ground biomass stores of theseforests is 247 Gt C (Chavez et al., 2008; Lewis et al., 2009; Mahliet al., 2006; UNEP, 2010), which is five times more than the currentglobal carbon emissions of 47 Gt per year (UNEP, 2010). Almosthalf of this above-ground carbon is in the forests of Latin America,26 per cent in Asia, <strong>and</strong> 25 per cent in Africa (Saatchi et al., 2011)(see Figure 46).The vast northern boreal conifer <strong>and</strong> broadleaved forestsare also important carbon stores (Potapov et al., 2008). Temperateforests have been decimated over the centuries, but are nowexp<strong>and</strong>ing in Europe <strong>and</strong> the United States, <strong>and</strong> so are buildingcarbon stores (FAO, 2010a). In some parts of the world, forestsgrow on peatl<strong>and</strong>s, where there can be more carbon in the soil thanin the forest (Malhi et al., 1999).Recognizing the importance of forests in climate stabilization,the United Nations Framework Convention on Climate Change(UNFCCC) is currently negotiating a mechanism known as REDD+to address some of the impacts addressed in the previous section.If agreed, REDD+ (Reducing Emissions from Degradation <strong>and</strong>Deforestation) would provide a strong incentive for developingcountries to conserve their forests while safeguarding againstDeforestation AND forest degradationdrive climate changeclimate change in turn can damageforests AND THE SERVICES THEY PROVIDEFigure 46: Regionalpatterns of forestabove-ground biomassin tropical forestsThis map illustratesregional patterns <strong>and</strong>provides methodologicallycomparable estimatesof forest above-groundbiomass (circa 2000)for 75 tropical countries(Saatchi et al., 2011).Above ground biomass(Mg/ha)0 - 2526 - 5051 - 7576 - 100101 - 150151 - 200201 - 250251 - 300301 - 350351 - 400>400biodiversity loss, ensuring the livelihoods of forest dependentpeoples <strong>and</strong> investing in low carbon paths to sustainabledevelopment (WWF, 2011c). The proposed REDD+ policymechanism needs to contain important safeguards to ensure thatcarbon conservation does not harm biodiversity <strong>and</strong> that livelihoodsfor people are not compromised by REDD+ actions to conserveforest carbon.Conservation actions aimed at conserving carbon in forestsinclude avoiding forest fragmentation; preventing conversion of oldgrowthnatural <strong>and</strong> semi-natural forests into industrial agricultural<strong>and</strong> tree farms (plantations); encouraging sustainable use <strong>and</strong>responsible forest management; conserving forests within protectedareas; improving forest connectivity; managing natural disturbanceregimes such as fires; preventing <strong>and</strong> when necessary controllinginvasive species; <strong>and</strong> slowing climate change.Forest coverReduce degradation,avoid leakage<strong>and</strong> deforestationin business as usualDR CongoSurinameStage 1Little disturbedforests (beyondagricultural frontier)BoliviaBrazilCameroonIndonesiaPapua New GuineaStage 2Forest frontiersReducedeforestationForest transition stagesREDD+ ChallengesContinue conservation<strong>and</strong> afforestation/reforestationIndiaCosta RicaStage 3Forest coverstabilization(forest-agricultural mosaics)Figure 47: Generalized model of forest transition that outlines someof the challenges associated with REDD+ in different countriesThis figure presents an empirical model of forest cover change over time in responseto economic development. Different REDD+ challenges are also highlighted; startingfrom the need to reduce forest degradation <strong>and</strong> deforestation in the early stagesof forest transition (Stage 1) <strong>and</strong> even more importantly as deforestation proceeds(Stage 2). Following deforestation, forest cover tends to regrow or is replanted<strong>and</strong> climate benefits mainly arise from continued conservation, carbon stockenhancement <strong>and</strong> afforestation <strong>and</strong> reforestation (Stage 3). (Modified from Wertz-Kanounnikoff <strong>and</strong> Kongphan-apira, 2009. Note that Meyfroidt <strong>and</strong> Lambin, 2011,contest that forest transitions follow generic pathways. They state that countriesdo not follow a predictable sequence of forest cover change).WWF Living Planet Report 2012 page 74 Chapter 2: Why we should care page 75
Overlaying carbon <strong>and</strong> biodiversityThe world’s forests are being cleared <strong>and</strong> degraded through varioushuman activities, releasing greenhouse gases, especially CO2, intothe atmosphere. Globally, around 13 million ha of forest were losteach year between 2000 <strong>and</strong> 2010 (FAO, 2010a). Deforestation<strong>and</strong> forest degradation currently account for up to 20 per cent ofglobal anthropogenic CO2 emissions, the third-largest source aftercoal <strong>and</strong> oil (IPCC, 2007a). This makes forest conservation a vitalstrategy in global efforts to drastically cut greenhouse gas emissions.Recognizing areas that have important biodiversity <strong>and</strong>ecosystem services values can help to identify where conservationis important for society <strong>and</strong> economic development. In the caseof carbon storage, Strassburg et al., 2010 used global data sets onterrestrial biodiversity <strong>and</strong> carbon storage to map <strong>and</strong> investigatepotential synergies between management aimed at both carbon<strong>and</strong> biodiversity conservation. A strong association between carbonstocks <strong>and</strong> species’ richness suggests that such synergies are highbut unevenly distributed. Many areas of high value for biodiversitycould be protected by carbon management policies, <strong>and</strong> others couldreceive complementary funding due to their carbon stock. However,not all high-biodiversity regions would benefit from carbon-focusedconservation, <strong>and</strong> some areas important for biodiversity couldcome under increased pressure if forest carbon conservation isimplemented without considering biodiversity.Such studies have important policy implications. Theyprovide guidance on places where ecosystem services should besustained alongside biodiversity because of the importance ofecosystem services for society <strong>and</strong> economic development. Morespecifically, conserving the carbon content of tropical forests <strong>and</strong>working to reduce tropical deforestation <strong>and</strong> degradation, is a majorglobal strategy for the UNFCCC <strong>and</strong> its REDD+ policy mechanism.© Roger Leguen / WWF-CanonDefinitions of deforestation <strong>and</strong> degradationWWF uses the following definition of degradation: “Secondary forestthat has been lost through human activities; its structure, function, <strong>and</strong>species’ composition or production normally associated with the foresttype expected at that site. Hence, degradation delivers a decreasingsupply of goods <strong>and</strong> services from the given site <strong>and</strong> maintains onlylimited biodiversity.” (Source: Convention of Biological Diversity).There are different estimations of the percentage contributionof deforestation <strong>and</strong> degradation to global CO2 emissions: for example,20% (IPCC, 2007); 12% of total anthropogenic CO2 emissions <strong>and</strong> 15%if peat degradation is included (van der Werf et al., 2009).Matécho forest near Saül in the centre of French Guiana. Tree distribution showing disturbances,old <strong>and</strong> new. The gaps will be filled in once new trees, such as those in the foreground, are growing.WWF Living Planet Report 2012 page 76
Forests: Providers ofwood fuelIn addition to climate regulating services, the world’s forests provideessential provisioning services for billions of people, including thesupply of fuel, timber, fibre, food <strong>and</strong> medicines. Across much ofthe developing world, for example, the primary way in which peoplecook <strong>and</strong> keep warm is by burning woody biomass from their localenvironment. The two regions most dependant on wood fuel areAsia <strong>and</strong> Africa, which together account for 75 per cent of globaluse (World Resources Institute, 2011).In Africa, 80-90 per cent of rural energy comes from woodfuel obtained within a few kilometres of people’s homes (Chomitzet al., 2007). More than 70 per cent of the urban population relyon wood fuel for cooking, mainly charcoal (DeFries et al., 2010;Mwampamba, 2007; WWF, 2011b). Charcoal is an increasinglypopular wood fuel among urban dwellers. Produced from naturalwoodl<strong>and</strong>s <strong>and</strong> forests, <strong>and</strong> transported to towns for sale, millionsof tonnes of charcoal enter cities in developing countries everyyear. Much of this charcoal production is unsustainable (Ahrendset al., 2010), leading to net deforestation <strong>and</strong> forest degradation,additional CO2 emissions, <strong>and</strong> thus to climate change, as well assignificant biodiversity loss. Although wood can be a sustainableresource, this level of dem<strong>and</strong>, coupled with growing populations,is having a major impact on forests throughout the continent.Case study: Wood fuel impacts on biodiversityForest degradation is exp<strong>and</strong>ing in waves from Africa’s majorcities, leading to significant forest degradation <strong>and</strong> loss offorest biodiversity.In Tanzania, for example, logging has advanced 120km fromDar es Salaam in just 14 years, depleting all high-value timbertrees within 200km of the city. This first wave of degradationwas followed by a second that removed medium-value timber,<strong>and</strong> a third that consumed the remaining woody biomass forcharcoal production.Moving away from the city at a speed of around 9km per year,these degradation waves have severely impacted biodiversity <strong>and</strong>ecosystem services. Forests close to the city contain 70 per cent fewertree species (Figure 48) <strong>and</strong> store 90 per cent less carbon per hectarethan less disturbed forests 200km away (Ahrends et al., 2010).75%ASIA AND AFRICATOGETHER ACCOUNTFOR 75 PER CENTOF GLOBAL USE OFWOOD FUELFigure 48: Waves offorest degradationspreading out fromDar es Salaam (DES)between 1991 <strong>and</strong> 2005Map of the degradationwaves of dominant forestuse in the study area in1991 <strong>and</strong> 2005. Charcoalburning has moved a roaddistance of 30km fromDES in this time period,<strong>and</strong> medium-value timberlogging has moved 160km(Ahrends et al., 2010).KeyDominant forest usecharcoal burningDominant forestuse logging of low/medium-value timberDominant forest uselogging of high-valuetimberFigure 49: <strong>Biodiversity</strong>impact of loggingaround Dar es SalaamThe impact on biodiversity,indicating how speciesrichness increases withdistance from DES. Forestsfurther away from thecity are less impacted bylogging <strong>and</strong> cutting forcharcoal production <strong>and</strong> soare more species rich thanthose closer to it (Ahrendset al., 2010).The progressive removal of high-value trees <strong>and</strong> the increasingdistance travelled to locate fresh supplies suggest a “logging downthe timber value” scenario akin to the “fishing down the food web”pattern observed in the oceans. A lack of affordable alternativesfor charcoal <strong>and</strong> rising dem<strong>and</strong> for construction timber means thatin the absence of sustainable fuel sources, forest degradation willcontinue to exp<strong>and</strong> from Africa’s growing cities.Species richness esimate301500DES1991 200540Kmcharcoal wavelow/medium-valuetimber wavehigh-value timberwaveDES100 200 220Distance from Dar es Salaam (km)WWF Living Planet Report 2012 page 78 Chapter 2: Why we should care page 79
Energy to BurnMargaret occupies an interesting spot on the spectrum ofenergy use. Like 2.7 billion others, she cooks <strong>and</strong> heatswater with wood <strong>and</strong> charcoal. She is planting trees on herproperty to ensure a source of fuel wood. Margaret alsohas a small solar panel that allows her to read her Bible <strong>and</strong>charge her mobile phone.© WWF-Canon / Simon RawlesCould renewable energy leapfrog fossil fuels in developingnations, in the same way that mobile phones leapfroggedl<strong>and</strong>lines, providing people like Margaret with energysecurity, a healthier smoke-free kitchen <strong>and</strong> reducing thepressure on nearby forests?
RIVERS: Impacted byinfrastructureFreshwater ecosystems occupy approximately 1 per cent of theEarth’s surface yet are home to around 10 per cent of all knownanimal species (Abramovitz, 1996; McAllister et al., 1997). Byvirtue of their position in the l<strong>and</strong>scape, these ecosystems connectterrestrial <strong>and</strong> coastal marine biomes <strong>and</strong> provide services vitalto the health <strong>and</strong> stability of human communities, includingfisheries, water for agricultural <strong>and</strong> domestic use, hydrologicalflow regulation, navigation <strong>and</strong> trade, pollution control <strong>and</strong>detoxification services (Millennium Ecosystem Assessment, 2005c).But numerous pressures, including l<strong>and</strong> use change, water use,infrastructure development, pollution <strong>and</strong> global climate change,working individually <strong>and</strong> collectively, are impinging on the healthof rivers <strong>and</strong> lakes around the world.The rapid development of water management infrastructure– such as dams, dykes, levees <strong>and</strong> diversion channels – have leftvery few rivers entirely free flowing. Of the approximately 160rivers greater than 1,000km in length, only around 50 remain freeflowing <strong>and</strong> without dams on their main channel (WWF, 2006a).While clearly this infrastructure provides benefits at one level, suchas hydropower or irrigation, there is often a hidden cost to aquaticecosystems <strong>and</strong> the wider ecosystem services that they provide.In order to sustain the wealth of natural processes providedby freshwater ecosystems – such as sediment transport <strong>and</strong> nutrientdelivery, which are vital to farmers in floodplains <strong>and</strong> deltas;migratory connectivity, vital to inl<strong>and</strong> fisheries; <strong>and</strong> flood storage,vital to downstream cities – it is imperative to appreciate theimportance of free flowing rivers, <strong>and</strong> developing infrastructurewith a basin-wide vision.Number of large free flowing rivers17515012510075502500
Oceans: SOURCE OF FOOD,ENERGY AND MATERIALSThe world’s oceans provide critical services for billions of people,but are threatened by overexploitation, greenhouse gas emissions<strong>and</strong> pollution. Oceans supply fish <strong>and</strong> other seafood that form amajor source of protein for billions of people, <strong>and</strong> provide seaweed<strong>and</strong> marine plants used for the manufacture of food, chemicals,energy <strong>and</strong> construction materials. Marine habitats such asmangroves, coastal marshes <strong>and</strong> reefs, form critical buffers againststorms <strong>and</strong> tsunamis <strong>and</strong> store significant quantities of carbon.Some, especially coral reefs, support important tourism industries.Ocean waves, winds <strong>and</strong> currents offer considerable potential forcreating sustainable energy supplies. These services have a hugevalue in terms of direct food production, providing incomes <strong>and</strong>by preventing loss <strong>and</strong> damage to property, l<strong>and</strong>, human life <strong>and</strong>economic activities.Over the past 100 years, however, the use of the sea <strong>and</strong> itsservices has intensified, from fishing <strong>and</strong> aquaculture, to tourism<strong>and</strong> shipping, oil <strong>and</strong> gas extraction <strong>and</strong> seabed mining.Ocean acidity hasincreased by 30%since the IndustrialRevolutionKeyet al., 2011). This continuing trend also applies to sharks <strong>and</strong> othermarine species.Targeted fishing of top predators has changed wholeecological communities, with increasing abundance of smallermarine animals at lower trophic levels as a consequence of the largerspecies being removed. This in turn has an impact on the growth ofalgae <strong>and</strong> coral health.19502006Fisheries: Impacts on marine ecosystemsThe consequences of increased fishing intensity have beendramatic for the marine environment. Between 1950 <strong>and</strong> 2005,“industrial” fisheries exp<strong>and</strong>ed from the coastal waters of the NorthAtlantic <strong>and</strong> Northwest Pacific southward into the high seas <strong>and</strong> theSouthern Hemisphere.Improved fishing technology allowed deep-sea trawling,purse seining <strong>and</strong> long-lining in waters several kilometres deep,reaching populations that are long lived, late maturing <strong>and</strong> verysensitive to overfishing. One-third of the world’s oceans <strong>and</strong> twothirdsof continental shelves are now exploited by fisheries, withonly inaccessible waters in the Arctic <strong>and</strong> Antarctic remainingrelatively unexploited.A nearly five-fold increase in global catch, from 19 milliontonnes in 1950 to 87 million tonnes in 2005 (Swartz et al., 2010),has left many fisheries overexploited (FAO, 2010b). In some areasfish stocks have collapsed, such as the cod fisheries of the Gr<strong>and</strong>Banks of Newfoundl<strong>and</strong> (FAO, 2010b). Catch rates of some speciesof large predatory fishes – such as marlin, tuna <strong>and</strong> billfish – havedramatically declined over the last 50 years, particularly in coastalareas of the North Atlantic <strong>and</strong> the North Pacific (Tremblay-BoyerAt least 10%PPR extractionAt least 20%PPR extractionAt least 30%PPR extractionPPR is a value thatdescribes the total amountof food a fish needs to growwithin a certain region.Figure 51: The expansion <strong>and</strong> impact of world fishing fleets ina) 1950 <strong>and</strong> b) 2006The maps show the geographical expansion of world fishing fleets from 1950 to2006 (the latest available data). Since 1950, the area fished by global fishing fleetshas increased ten-fold. By 2006 100 million km 2 , around 1/3 of the ocean surface,was already heavily impacted by fishing. To measure how intensively these areasare fished, Swartz et al., (2010) used the fish l<strong>and</strong>ed in each country to calculatethe primary production rate (PPR) of each region of the ocean. PPR is a value thatdescribes the total amount of food a fish needs to grow within a certain region. Inthe areas in blue, the fleet extracted at least 10% of this energy. Orange indicatesa minimum of 20% extraction <strong>and</strong> red shows least 30%, highlighting the mostintensively <strong>and</strong> potentially overfished, areas. WWF <strong>and</strong> the Sea Around Us projectcollaborated to produce an animated map showing these changes over time <strong>and</strong>also the expansion of the EU fishing fleet, see http://www.wwf.eu/fisheries/cfp_reform/external_dimension/WWF Living Planet Report 2012 page 84 Chapter 2: Why we should care page 85
Give to GetAs competition for l<strong>and</strong> increases, it is all about improvingefficiency <strong>and</strong> preventing negative impacts on the naturalenvironment. In many cases there are win-win solutionsfor people <strong>and</strong> nature. In April 2010, Margaret reorientedher farm <strong>and</strong> implemented basic conservation measures toimprove soil <strong>and</strong> water retention. Her yields shot up, whilerun-off into the Turasha River dropped. Her neighbourshave taken note, <strong>and</strong> are making the same changes ontheir l<strong>and</strong>. With increased productivity, the same farms aresupporting more people. Margaret, a farmer with virtuallyno safety net, took a chance on change. It’s time for othersto be as brave.© WWF-Canon / Simon Rawlesdesign note:Check for gutter <strong>and</strong> repeatimage if necessary
Scramble for l<strong>and</strong>:Competing claims <strong>and</strong>commercial pressurel<strong>and</strong> <strong>and</strong> water resources they have held under customary tenure.Many cases show how the resource base of rural livelihoods is beingsqueezed through the loss of access to grassl<strong>and</strong>s, forests <strong>and</strong>marshl<strong>and</strong>s that are customarily held as common property. Thepoor are bearing disproportionate costs, but reaping few benefits,largely because of poor governance. The l<strong>and</strong> rush is also leadingto extensive conversion of natural ecosystems with accompanyinglosses of ecosystem services <strong>and</strong> biodiversity (Anseeuw et al., 2012).L<strong>and</strong> use decisions are invariably complex, involving manystakeholders with different priorities. Productive l<strong>and</strong> may besimultaneously in dem<strong>and</strong> by communities (e.g., homel<strong>and</strong>s <strong>and</strong>sacred sites), or for food production, forest products, biodiversityconservation, urban development or carbon storage. Renewableenergy dem<strong>and</strong>s add an extra dimension, through use of l<strong>and</strong> forbioenergy feedstock production. The situation is further complicatedby the interdependence between the production <strong>and</strong> consumptionof key resources such as food, fibre, energy <strong>and</strong> water. Agriculturerequires l<strong>and</strong>, water <strong>and</strong> energy; water extraction <strong>and</strong> distributionrequire energy; <strong>and</strong> energy production often requires water (WorldEconomic Forum, 2011). All require ecosystem services, <strong>and</strong> onel<strong>and</strong> use decision can affect the provision of many different services.Moreover, the poorest <strong>and</strong> most vulnerable people are most affectedby the consequences of poor l<strong>and</strong> use <strong>choices</strong>, while being the leastable to influence such decisions.The frequency <strong>and</strong> complexity of l<strong>and</strong> use competition isexpected to rise as human dem<strong>and</strong>s grow.Scramble for l<strong>and</strong>: Food <strong>and</strong> fuelThroughout the developing world, external investors are scramblingto secure access to agricultural l<strong>and</strong> for future food production.Since the mid-2000s, it is estimated that an area almost the size ofWestern Europe has been transferred in l<strong>and</strong> allocation deals. Thelatest rush for farml<strong>and</strong> was triggered by the food crisis of 2007-08, but long-term drivers include population growth; increasedconsumption by a global minority; <strong>and</strong> market dem<strong>and</strong>s for food,biofuels, raw materials <strong>and</strong> timber (Anseeuw et al., 2012).Recent research shows that deals reported as approved orunder negotiation worldwide amounted to a total of 203 millionhectares: 134 million hectares of this total are located in Africa;43 million hectares in Asia <strong>and</strong> 19 million hectares in Latin America.Of these, deals for 71 million hectares have so far been crossreferenced,confirming the unprecedented scale of the l<strong>and</strong> rushover the past decade (Anseeuw et al., 2012).The best agricultural l<strong>and</strong> is often targeted for thisacquisition. The rural poor are frequently being dispossessed ofthe poorest <strong>and</strong>most vulnerablepeople are mostaffected by theconsequences ofpoor l<strong>and</strong>-use<strong>choices</strong>An area almost thesize of WesternEurope has beentransferred in l<strong>and</strong>allocation dealssince mid-20005.2 millionhectares of l<strong>and</strong> inPapua New Guineahas been acquiredfor long-termleasesCase study: Papua New GuineaIn the last five years, 5.2 million hectares of l<strong>and</strong> in Papua NewGuinea has been acquired for long-term leases – termed SpecialAgricultural <strong>and</strong> Business Leases (SABLs). These now encompass15 per cent of the country’s l<strong>and</strong> area. Nearly all of these leases havebeen h<strong>and</strong>ed to foreign investors or multinational corporations –mostly for logging <strong>and</strong> oil palm plantations. Under existing SABLs,around 2 million hectares of forests are allowed to be legally cleared.In a number of cases, the leases appear to have been grantedwithout the free <strong>and</strong> prior consent of a majority of the traditionall<strong>and</strong>owners, which is a legal requirement in Papua New Guinea.In response to a growing domestic <strong>and</strong> international outcry, thegovernment declared a temporary moratorium on SABLs, butthis offers only a temporary respite to one of the most serious<strong>and</strong> immediate threats to the country’s forests <strong>and</strong> biodiversity(Laurance, 2012, in press).The sheer pace of change demonstrated by this exampleunderlies an urgent challenge: to stop dispossession <strong>and</strong> l<strong>and</strong>allocations that do not serve a genuine public interest; to legallyrecognize the rights of the rural poor; <strong>and</strong> to steer toward moreequitable models that give a key role to existing l<strong>and</strong> users(Anseeuw et al., 2012).The L<strong>and</strong> MatrixThe L<strong>and</strong> Matrix is an online public database of large-scale l<strong>and</strong>deals. It is facilitated by a partnership of organizations withan interest in promoting transparency <strong>and</strong> accountability indecisions over l<strong>and</strong> <strong>and</strong> investment through open data. The L<strong>and</strong>Matrix aims to provide a permanent observatory to which anyuser can contribute information. www.l<strong>and</strong>portal.info/l<strong>and</strong>matrixWWF Living Planet Report 2012 page 88 Chapter 2: Why we should care page 89
Chapter 3: What doesthe future hold?~The Sun shining down upon the Earth as photographedby an astonaut from the International Space Station.© ESA / T. Reiter
The emerging impactsof rising greenhousegas emissionsAverage global surface temperatures were 0.8 o C warmer during thefirst decade of the 21st century than during the first decade of the20th century, <strong>and</strong> the most pronounced warming has been over thepast 30 years. According to the National Research Council (NRC)of the US National Academies, “the past few decades have beenwarmer than any other comparable period for at least the last 400years, <strong>and</strong> possibly for the last 1,000 years or longer” (NationalResearch Council, 2010).The principle culprits driving the long-term global warmingtrend are rising atmospheric concentrations of greenhouse gases,especially carbon dioxide (CO2), from fossil fuel use. Additionallesser amounts of greenhouse gases have come from deforestation<strong>and</strong> from other l<strong>and</strong> use <strong>and</strong> l<strong>and</strong> cover changes. Emissions of CO2from fossil fuel use have been rising since the Industrial Revolution(i.e., since the mid-1700s); <strong>and</strong> by the 1950s, the atmosphericconcentration of CO2 had risen from pre-industrial levels of 284parts-per-million (ppm) to 300 ppm – the highest level in at least800,000 years (Luthi, 2008). By 2010, emissions of CO2 from fossilfuels had risen to the highest level in history: 9.1 billion tonnes ofcarbon (Oak Ridge National Laboratory, 2011), <strong>and</strong> atmosphericconcentrations followed suit, reaching 388.5 ppm that year (<strong>and</strong>390.5 ppm in 2011) (NOAA/ESRL).“Warming of the climate system is unequivocal… Most of the observed increase in globalaverage temperatures since the mid-20th centuryis very likely due to the observed increase inanthropogenic greenhouse gas concentrations… Anthropogenic warming over the last threedecades has likely had a discernible influence atthe global scale on observed changes in manyphysical <strong>and</strong> biological systems” (IPCC 2007a).By 2010, emissionsof CO2 from fossilfuels had risen tothe highest levelin historyThe volume of Arcticsea ice dropped to arecord low in 2011Warming oceansCO2 levels would have increased even more, were it not for thefact that about one quarter of CO2 is being absorbed by the globalgrassl<strong>and</strong>s <strong>and</strong> forests, <strong>and</strong> another quarter by the oceans. Theresult has been a 30 per cent increase in the acidity of the oceansrelative to pre-industrial levels. At the same time, oceans haveabsorbed 80-90 per cent of the heating from rising greenhousegas concentrations over the last half-century, driving up oceantemperatures (National Research Council, 2010). Sea surfacetemperatures affect a range of climate variables including airtemperatures <strong>and</strong> humidity, precipitation, atmospheric circulation<strong>and</strong> storm attributes. The warmer oceans also exp<strong>and</strong>, accountingfor 50-60 per cent of the sea level rise observed since the mid-1800s(National Research Council, 2010). In the 20th century, the rate ofsea level rise – 2.1mm per year – was faster than for any century in2,000 years (Kemp et al., 2011).The rising temperatures of both the atmosphere <strong>and</strong> oceansare altering worldwide weather patterns. Colder temperaturesare increasingly edged-out by warmer temperatures. Heat wavesare becoming more common <strong>and</strong> intense. Precipitation patternsare changing <strong>and</strong> heavy precipitation events are becoming morefrequent. There are changes in the frequency <strong>and</strong> severity ofdroughts. Storm tracks <strong>and</strong> intensity are changing, including a risein the intensity of tropical storms over the North Atlantic Ocean(IPCC, 2007a).<strong>Biodiversity</strong> impactsIn 2007 the Intergovernmental Panel on Climate Change (IPCC)concluded with “very high confidence” that “recent warming isstrongly affecting terrestrial biological systems”; <strong>and</strong> stated with“high confidence” that “observed changes in marine <strong>and</strong> freshwaterecological systems are associated with rising water temperatures,as well as related changes in ice cover, salinity, oxygen levels <strong>and</strong>circulation” (IPCC, 2007a).Some of the most dramatic <strong>and</strong> important impacts are evidentin the Arctic, where the warming has been particularly pronounced(see box overleaf). The Arctic holds a vast quantity of l<strong>and</strong>-ice(concentrated in Greenl<strong>and</strong>), as does the Antarctic <strong>and</strong> otherregions with glaciers, such as the Himalayas. Rising temperaturesare shrinking the amount of ice – releasing immense quantitiesof freshwater into the oceans, <strong>and</strong> contributing to rising sea levels(National Research Council, 2010).WWF Living Planet Report 2012 page 92 Chapter 3: What does the future hold? page 93
Impacts in the far northern latitudes, including the Arctic, are ofparticular concern. Dieback of boreal forests, along with thawingpermafrost <strong>and</strong> methane deposits, could release large quantitiesof greenhouse gases. Similarly, more frequent severe droughts inthe Amazon region – as occurred twice over the last decade (2005<strong>and</strong> 2010) – can shift carbon from the Amazon’s forests to theatmosphere (see box below) (Davidson et al., 2012; Lewis et al.,2011; Ma et al., 2012; Xiao et al., 2011; Schuur <strong>and</strong> Abbott, 2011).Arctic rapidly warms, sea ice precipitously declinesSurface temperatures have been rising rapidly in the Arctic sincethe late 1970s <strong>and</strong> were at a record high in 2011 (Figure 52). Inaddition there has been a precipitous decline in Arctic sea ice,which dropped to the second lowest extent in the satellite recordin September 2011 – just short of the record set in 2007. At thesame time the sea ice is thinning <strong>and</strong> the volume of Arctic sea icedropped to a record low in 2011. The decline is unprecedented forthe past 1,450 years (Kinnard, 2011). The rapid sea ice decline hasnegatively affected people living <strong>and</strong> working in the Arctic, as wellas wildlife. The decline in sea ice combined with rising sea surfacetemperatures also is affecting weather patterns from the Arctic tothe mid-latitudes (USGCRP, 2009; Jaiser, 2012).2.52.01.51.0Figure 52: Surfacetemperature trends inthe ArcticTwo recentAmazon droughtsdemonstrate amechanism by whichremaining intacttropical forests ofSouth America canshift from bufferingthe increase inatmosphericcarbon dioxide toaccelerating itExtreme droughts in the AmazonScientists are concerned that climate change may bringincreasingly arid conditions (along with more frequent extremedroughts) to the Amazon, resulting in net carbon losses from theregion’s forests to the atmosphere (Davidson et al., 2012; Lewiset al., 2011; Zhao <strong>and</strong> Running, 2010). Those concerns werehighlighted in 2005 when a “once in a century” drought affectedthe Amazon, with impacts so severe the government declared astate of emergency for much of the area. The drought resultedin a massive release of 0.8-2.6 Gigatons (billion metric tonnes)of carbon to the atmosphere. This can be compared to globalemissions of CO2 from fossil fuels in 2005 of 7.4 Gigatons ofcarbon (Lewis et al., 2011).In 2009, WWF identified the prospect of more frequentextreme droughts in the Amazon <strong>and</strong> the related rainforestdieback as being among the “tipping points” that could be passedin coming decades as climate changes, with “significant impactswithin the first half of this century” (Lenton et al., 2009). Thevery next year, in 2010, another extraordinary drought afflictedthe region, this time with perhaps even greater emissions,estimated at between 1.2 <strong>and</strong> 3.4 Gigatons of carbon. “The tworecent Amazon droughts demonstrate a mechanism by whichremaining intact tropical forests of South America can shiftfrom buffering the increase in atmospheric carbon dioxide toaccelerating it,” said researchers in the 4 February 2011 issue ofScience. “If drought events continue, the era of intact Amazonforests buffering the increase in atmospheric carbon dioxide mayhave passed.” (Lewis et al., 2011).Surface temperature0.50.0-0.5-1.0-1.5-2.01880 2011YearWWF Living Planet Report 2012 page 94 Chapter 3: What does the future hold? page 95
A matter of degrees: Future impacts tiedto CO2 emissionsThe IPCC in 2007 projected a warming of about 0.2°C perdecade over the following two decades with subsequent warmingincreasingly depending on specific emissions scenarios (IPCC 2007).The NRC reported in 2011 that limiting the ultimate global averagewarming to 2ºC above pre-industrial levels likely would require thatatmospheric CO2 concentrations be stabilized at around 430 ppm.Stabilizing concentrations “for a century or so” at that level – or atany level – will require emissions reductions larger than 80 per centbelow peak levels, but the NRC says that “even greater reductions inemissions would be required to maintain stabilized concentrationsin the longer term” (National Research Council, 2011).With concentrations already exceeding 390 ppm <strong>and</strong>emissions at record levels, warming is likely to exceed 2ºC in thelong term unless a sharp <strong>and</strong> sustained decline of at least 80 percent in emissions by 2050 compared to 1990 is underway before2020. If emissions continue to grow, large regions probably willindividually exceed a 2ºC increase in average annual temperaturesby 2040. Under “business as usual” emissions scenarios, the 2ºCwarming is likely to be reached globally by 2060 or earlier, <strong>and</strong>temperatures will continue rising well beyond that time (Joshi etal., 2011; Rogelj et al., 2011).“The world is entering a new geologic epoch,sometimes called the Anthropocene, in whichhuman activities will largely control theevolution of Earth’s environment. Carbonemissions during this century will essentiallydetermine the magnitude of eventual impacts<strong>and</strong> whether the Anthropocene is a short-term,relatively minor change from the current climateor an extreme deviation that lasts thous<strong>and</strong>s ofyears.” (National Research Council, 2011).The IPCC concludes that during this century “it isvery likely that hot extremes, heat waves <strong>and</strong>heavy precipitation will become more frequent”<strong>and</strong> that “it is likely that future tropical cyclones(typhoons <strong>and</strong> hurricanes) will become moreintense, with larger peak wind speeds <strong>and</strong> moreheavy precipitation.” (IPCC, 2007a).The rising global temperatures <strong>and</strong> atmospheric CO2 concentrationswill bring dangerously disruptive changes to both the oceans <strong>and</strong>climate. Researchers warned in March 2012 that “the current rateof (mainly fossil fuel) CO2 release st<strong>and</strong>s out as capable of drivinga combination <strong>and</strong> magnitude of ocean geochemical changespotentially unparalleled in at least the last ~300My [million years]of Earth history, raising the possibility that we are entering anunknown territory of marine ecosystem change.” (Honisch et al.,2012). Sea levels could rise 0.75-1.9 meters above 1990 levels by2100 (Vermeer <strong>and</strong> Rahmstorf, 2009). Increases in the frequency<strong>and</strong> severity of floods <strong>and</strong> droughts are likely (IPCC, 2007a).The IPCC describes in unambiguous terms <strong>and</strong> with highconfidence the implications for ecosystems: “During the course ofthis century the resilience of many ecosystems (their ability to adaptnaturally) is likely to be exceeded by an unprecedented combinationof change in climate, associated disturbances (e.g., flooding, drought,wildfire, insects, ocean acidification) <strong>and</strong> in other global changedrivers (especially l<strong>and</strong>-use change, pollution <strong>and</strong> over-exploitationof resources), if greenhouse gas emissions <strong>and</strong> other changescontinue at or above current rates …” (IPCC, 2007c).These <strong>and</strong> other impacts on systems <strong>and</strong> sectors aresummarized in Figure 55 for a range of average global temperatureincreases relative to 1980-1999 temperatures (which were already0.5°C above pre-industrial levels).WWF Living Planet Report 2012 page 96 Chapter 3: What does the future hold? page 97
What does the future hold?The use of scenariosScenarios are a recognized planning tool for generating differentmodels of how the world “might” look in the future. They are usedto improve underst<strong>and</strong>ing of the future consequences of today’sactions, against a range of possible outcomes.Scenarios are not predictions or forecasts; they simplyrepresent a variety of future alternatives. They are not intended toillustrate preferable developments or undesirable progressions, butinstead to describe possible futures. They can be used to further ourunderst<strong>and</strong>ing of how systems evolve, develop, behave <strong>and</strong> interact,as well as the potential impacts of specific policies.The IPCC has produced scenarios that contrast the climateimpacts of a future of slow economic growth with reliance ontraditional technologies, against a future of high economic growth<strong>and</strong> the rapid spread of new, more efficient technologies. As can beseen in Figure 53, under these scenarios, future global temperatureincreases, <strong>and</strong> the impacts of climate change, are very different. Inthe same way, scenarios can suggest how the Ecological Footprint<strong>and</strong> ecosystem service delivery might change in the future, <strong>and</strong> canhighlight the <strong>choices</strong> needed to ensure a sustainable existence.Figure 53 (opposite): Illustrative examples of global impacts projectedfor climate changes (<strong>and</strong> sea level <strong>and</strong> atmospheric carbon dioxidewhere relevant) associated with different amounts of increase in globalaverage surface temperature in the 21st century (IPCC 2007c)The solid lines link impacts, dotted arrows indicate impacts continuing withincreasing temperature. Entries are placed so that the left-h<strong>and</strong> side of the textindicates the approximate onset of a given impact. Quantitative entries for waterstress <strong>and</strong> flooding represent the additional impacts of climate change relative tothe conditions projected across the range of Special Report on Emissions Scenarios(SRES) scenarios A1FI, A2, B1 <strong>and</strong> B2 (for more information about these scenariossee IPCC 2007, <strong>and</strong> for the sources used to create this figure, see 2007c). Adaptationto climate change is not included in these estimations. All entries are from publishedstudies recorded in the chapters of the Assessment. Confidence levels for allstatements are high.1Significant is defined here as more than 40%2Based on average rate of sea level rise of 4.2mm/year from 2000 to 2080Scenarios can beused to furtherunderst<strong>and</strong>ingof how systemsevolve, develop,behave <strong>and</strong> interact012345ºCSignificant extinctions 1around the globeWidespread coral mortalityUp to 30% of species atincreasing risk of extinctionIncreased coral bleaching Most corals bleachedTerrestrial biosphere tends toward a net carbon source, as:~15% ~40% of ecosystems affectedIncreasing species range shifts <strong>and</strong> wildfire riskEcosystem changes due to weakening of the meridionaloverturning circulationComplex, localized negative impacts on small holders, subsistence farmers <strong>and</strong> fishersProductivity of all cerealsdecreases in low lattitudesTendencies for cereal productivityto decrease in low lattitudesCereal productivity todecrease in some regionsTendencies for cereal productivityto increase in mid to high lattitudesIncreased damage from floods <strong>and</strong> stormsWATERIncreased water availability in moist tropics <strong>and</strong> high latitudesDecreasing water availability <strong>and</strong> increasing drought in mid latitudes <strong>and</strong> semi-arid low latitudesHundreds of millions of people exposed to increased water stressAbout 30% of globalcoastal wetl<strong>and</strong>s lost 2Millions more people could experiencecoastal flooding each yearIncreasing burden from malnutrition, diarrhoea, cardio-respiratory <strong>and</strong> infectious diseasesIncreased morbidity <strong>and</strong> mortality from heat waves, floods <strong>and</strong> droughtsChanged distribution of some disease vectorsSubstantial burden on health services012345ºCGlobal average annual temperature change relative to 1980-1999 (°C)ECO-SYSTEMSFOODCOASTHEALTHGlobal average annual temperature change relative to 1980-1999 (°C)WWF Living Planet Report 2012 page 98 Chapter 3: What does the future hold? page 99
Projecting the EcologicalFootprint to 2050Modelling NATURALCAPITAL in SumatraAccording to the United Nations Food <strong>and</strong> Agriculture Organization(FAO), dem<strong>and</strong> for food, feed <strong>and</strong> fibres could grow by 70 per centby 2050 (FAO, 2009). This has considerable implications for l<strong>and</strong>use <strong>and</strong> natural ecosystems, <strong>and</strong> also for the size of humanity’sEcological Footprint.The Ecological Footprint Scenario Calculator uses footprintdata between 1961 <strong>and</strong> 2008 as a baseline, <strong>and</strong> projects the sizeof each component of the footprint in 2015, 2030 <strong>and</strong> 2050(Moore et al., 2012; WBCSD, 2010). The calculator uses data<strong>and</strong> projections from other scenario models for population, l<strong>and</strong>use, l<strong>and</strong> productivity, energy use, diet <strong>and</strong> climate change, <strong>and</strong>translates them into corresponding trends in Ecological Footprints<strong>and</strong> <strong>biocapacity</strong>. The datasets <strong>and</strong> parameters used in the “businessas usual” scenario are included in the figure legend below.The “business as usual” scenario for humanity’s EcologicalFootprint shows more <strong>and</strong> more pressure being placed on theplanet. By 2050 humanity would require an equivalent of 2.9planets to support the “business as usual” assumptions (Figure 54).Ecological Footprint (no. of planet Earths)32101961 1970 1980 1990 2000 2008 2015 2030 2050Figure 54: “Business asusual” scenario of theEcological Footprintfrom 2009 to 2050The Ecological Footprintscenario calculator usestrends from 1961 to 2008 tocreate a possible pathwayup to 2050.KeyBuilt-up l<strong>and</strong>FishingForestGrazingCropl<strong>and</strong>CarbonFigure 55: Overlapbetween conservationareas <strong>and</strong> ecosystemservices (carbonstocks <strong>and</strong> erosionprevention) inSumatra, IndonesiaThe maps illustrate theoverlay between tigerl<strong>and</strong>scapes (red outlines)<strong>and</strong> areas of (a) highsediment retention (erosion<strong>and</strong> run-off prevention)<strong>and</strong> (b) carbon storage incentral Sumatra in 2008(Bhagabati et al., 2012).Map right (a)Tiger conservationl<strong>and</strong>scapesTotal sediment retained(annual average)highlowMap far right (b)Tiger conservationl<strong>and</strong>scapesCarbon stock(metric tonnes / ha)1 - 5050 - 200200 - 1,000> 1,000Scenarios can help outline the <strong>choices</strong> where investment in naturalcapital can enhance human development <strong>and</strong> conservation.New software called InVEST, developed by WWF <strong>and</strong>partners, allows comparisons of important areas for biodiversityconservation <strong>and</strong> ecosystem services provision. This enablesecosystem services to be <strong>better</strong> integrated into the operationalwork of WWF <strong>and</strong> its partners.InVEST was recently used in Sumatra, Indonesia, to map theco-occurrence of important areas for tiger conservation, the stockof terrestrial carbon <strong>and</strong> erosion prevention across the l<strong>and</strong>scape.High quality tiger habitat overlaps with high soil carbon stocks inthe eastern peatl<strong>and</strong>s. In the mountainous west of the isl<strong>and</strong>,forested slopes contain tiger habitat <strong>and</strong> substantially reduceerosion, which helps provide clean water to downstream users.Ecosystem services were quantified <strong>and</strong> mapped for twoalternative scenarios of the future in central Sumatra: a “green”scenario of sustainable l<strong>and</strong> use, <strong>and</strong> a “business as usual”scenario representing l<strong>and</strong> use plans proposed by the Indonesiangovernment. InVEST results demonstrated that the “green” scenariowould yield higher levels of habitat <strong>and</strong> services relative to thegovernment plan. There is considerable variation in the distributionof services <strong>and</strong> their expected change across the l<strong>and</strong>scape.Local governments are using these results to prioritize<strong>and</strong> spatially target policy mechanisms, such as forest carbon<strong>and</strong> watershed conservation projects, to improve both wildlifeconservation <strong>and</strong> human welfare.a) Total sediment retained b) Carbon stockYearWWF Living Planet Report 2012 page 100 Chapter 3: What does the future hold? page 101
Million haThe Living Forests ModelThe Living Forests Model, developed by WWF with theInternational Institute for Applied Systems Analysis (IIASA) isbeing used to project forest loss <strong>and</strong> other l<strong>and</strong> use changes underdifferent scenarios (WWF, 2011a; b; c).Starting from the reference (a) Do Nothing Scenario, themodel projects changes if measures were introduced to rein-indeforestation <strong>and</strong> forest degradation <strong>and</strong> to increase biodiversityconservation. A number of scenarios have been developed forreductions in forest loss <strong>and</strong> degradation: (b) Target Scenario– Zero Net Deforestation <strong>and</strong> Forest Degradation (ZNDD – seedefinition in glossary) by 2020 <strong>and</strong> maintained at that levelindefinitely; (c) Target Delayed Scenario – ZNDD by 2030 <strong>and</strong>maintained at that level indefinitely; <strong>and</strong> (d) Half Measures Scenario– gross deforestation rate declines by at least 50 per cent from thereference rate by 2020 <strong>and</strong> is maintained at that level indefinitely.The Target Scenario was used to explore the costs <strong>and</strong> benefitsof fast action to cut deforestation <strong>and</strong> degradation compared to theDo Nothing Scenario (Figure 56). Compared to the Target Scenario,doing nothing, delaying or taking half measures all result in moreforest loss <strong>and</strong> associated GHG emissions, irreversible impacts onbiodiversity, <strong>and</strong> declines in ecosystem services (for further analysis,see WWF, 2011a; b; c <strong>and</strong> for further information on the model seeStrassburg et al., 2012).25020015010050020102020 20302040 2050YearDO NOTHINGHALF MEASURESTARGET DELAYEDTARGETFigure 56: Comparisonof gross deforestationunder the Do NothingScenario, TargetScenario, TargetDelayed Scenario <strong>and</strong>Half Measures ScenarioThe figure showscumulative deforestationbetween 2010 <strong>and</strong> 2050.Under the Do NothingScenario, the areadeforested is greater thanthe current total forest areaof the Democratic Republicof Congo, Peru <strong>and</strong> PapuaNew Guinea combined(WWF, 2011a).55.5MILLION HA232MILLION HA124.7MILLION HAForest Loss139MILLION HAFigure 57: Forest coverin 2000 <strong>and</strong> projectedforest cover in 2050The Living Forests Modelwas used to model changesin forest cover withintiger range states between2000 <strong>and</strong> 2050. Theavailable habitat for tigerswill shrink, according toprojections based on pasttrends. This projection doesnot take in account national<strong>and</strong> local policies to protectforest resources (for moredetails about the modelunderlying these maps, seeStrassburg et al., 2012).Forest Cover %1 - 1010 - 2020 - 4040 - 6060 - 8080 - 100Scenarios of biodiversity change: Modellingfuture habitat availability for tigersAsia’s most iconic species, the tiger, <strong>and</strong> its forests are not strangersto change. Over the last century, tigers have decreased in the wild from100,000 individuals to an estimated 3,200 to 3,500 (Global TigerInitiative, 2011), while Asia’s forests have decreased by more than70 per cent in half of the countries in this region (Laurance, 2007).What’s in store for Asia’s forests <strong>and</strong> tigers?Projections of forest change using the Living Forests ModelDo Nothing Scenario suggest that 332,207 km 2 (roughly 42 per cent)of habitat within WWF Tiger L<strong>and</strong>scapes will experience a declinein forest cover, with 50,708 km 2 of habitat declining to a 0-10 percent forest cover (Figure 57). Asia has the opportunity to addressdeforestation by taking actions to conserve the forests in which tigerslive. This includes smart, planned development; accounting for thebenefits provided by these forests in decision-making; <strong>and</strong> investmentin forests <strong>and</strong> tigers by nations following through on their existingcommitments to tiger conservation. At the rate forests <strong>and</strong> tigers arecurrently being lost, immediate action is crucial.Forest Coverin 2000Projected ForestCover for 2050WWF Living Planet Report 2012 page 102 Chapter 3: What does the future hold? page 103
Chapter 4:Better <strong>choices</strong>for a living planet~A satellite image of a phytoplankton bloom stretching across theBarents Sea off the coast of mainl<strong>and</strong> Europe’s most northern point,Cape Nordkinn. Free-floating phytoplankton highlight the whirls ofocean currents in spectacular shades of blue <strong>and</strong> green. Thesemicroscopic marine organisms that drift on or near the surface ofoceans <strong>and</strong> seas have been called “the grass of the sea” becausethey are the foundation of the oceanic food chain. Phytoplanktonare able to convert inorganic compounds such as water, nitrogen<strong>and</strong> carbon into complex organic materials. With their ability to“digest” these compounds, they are credited with removing as muchcarbon dioxide from the atmosphere as their plant “cousins” on l<strong>and</strong>– therefore having a profound influence on climate. They are alsosensitive to environmental changes, so it is important to monitor <strong>and</strong>model phytoplankton into calculations of future climate change.© ESA
One Planet perspectiveMost people essentially desire the same thing: A life where needsare met; to be safe <strong>and</strong> healthy; to be able to explore interests<strong>and</strong> realize potential; <strong>and</strong> to improve well-being. Along with thesepersonal aspirations, they have the support of all 193 memberstates of the United Nations, which have committed under variousinternational agreements to end poverty, ensure safe drinkingwater, protect biodiversity <strong>and</strong> reduce greenhouse gas emissions.The trends <strong>and</strong> analyses outlined in this report suggestthat under “business as usual”, such expectations <strong>and</strong> commitmentswill become increasingly difficult to meet.In order to reverse the declining Living Planet Index, bringthe Ecological Footprint down to within planetary limits, avoiddangerous climate change <strong>and</strong> achieve sustainable development,a fundamental reality must be embedded as the basis of economies,business models <strong>and</strong> lifestyles: The Earth’s natural capital –biodiversity, ecosystems <strong>and</strong> ecosystem services – is limited.WWF’s One Planet perspective explicitly proposes tomanage, govern <strong>and</strong> share natural capital within the Earth’secological boundaries. In addition to safeguarding <strong>and</strong> restoringthis natural capital, WWF seeks <strong>better</strong> <strong>choices</strong> along the entiresystem of production <strong>and</strong> consumption, supported by redirectedfinancial flows <strong>and</strong> more equitable resource governance. All ofthis, <strong>and</strong> more, is required to decouple human development fromunsustainable consumption (moving away from material <strong>and</strong>energy-intensive commodities), to avoid greenhouse gas emissions,to maintain ecosystem integrity, <strong>and</strong> to promote pro-poor growth<strong>and</strong> development (Figure 58).The One Planet perspective reminds us that our <strong>choices</strong>are highly interdependent. Preserving natural capital, for example,will affect decisions <strong>and</strong> possible outcomes relating to the way weproduce <strong>and</strong> consume. Financial flows <strong>and</strong> governance structureswill similarly determine to a great extent whether production<strong>and</strong> consumption <strong>choices</strong> will actually contribute to biodiversityconservation, ecosystem integrity <strong>and</strong>, ultimately, food, water<strong>and</strong> energy for all.This chapter outlines the top 16 priority actions requiredfor living within the means of one planet. Implementing sucha paradigm shift will be a tremendous challenge. We all faceuncomfortable <strong>choices</strong> <strong>and</strong> trade-offs, but only by taking brave,informed decisions can healthy, sustainable <strong>and</strong> equitable humansocieties be ensured, now <strong>and</strong> into the future.WWF’s One Planetperspectiveproposes tomanage, govern<strong>and</strong> share naturalcapital within theEarth’s ecologicalboundariesFigure 58: OnePlanet perspectiveThe centre panelsreflect <strong>better</strong> <strong>choices</strong>for managing, using<strong>and</strong> sharing naturalresources within OnePlanet limitations <strong>and</strong>ensuring food, water<strong>and</strong> energy security.Redirected financial flows<strong>and</strong> equitable resourcegovernance are essentialenabling factors.€$¥RedirectFinancialFlowsValue natureAccount forenvironmental<strong>and</strong> social costsSupport <strong>and</strong> rewardconservation,sustainable resourcemanagement<strong>and</strong> innovationECOSYSTEMINTEGRITYBETTER CHOICESFROM A ONE PLANETPERSPECTIVEPreserve Natural Capital• Restore damaged ecosystems <strong>and</strong>ecosystem services• Halt loss of priority habitats• Significantly exp<strong>and</strong> the globalprotected areas networkProduce Better• Significantly reduce inputs <strong>and</strong> wastein production systems• Manage resources sustainably• Scale-up renewable energy productionConsume More Wisely• Achieve low-footprint lifestyles• Change energy consumption patterns• Promote healthy consumption patternsBIODIVERSITYCONSERVATIONEquitableResourceGovernanceShare availableresourcesMake fair <strong>and</strong>ecologicallyinformed <strong>choices</strong>Measure successbeyond GDPFOOD, WATER ANDENERGY SECURITYWWF Living Planet Report 2012 page 106 Chapter 4: Better <strong>choices</strong> for a living planet page 107
SHARE AND SHARE ALIKEA visitor to Margaret’s farm will be given sweet, milkytea <strong>and</strong> a hearty helping of potatoes, beans <strong>and</strong> greens.Margaret will also share her time <strong>and</strong> her knowledge, <strong>and</strong>her warm laugh. Sharing enriches us. It feels good. While weunderst<strong>and</strong> this on a personal level, we tend to forget it whenit comes time to make decisions about allocating resources.When we remember what counts, we will be able to countwhat matters.© WWF-Canon / Simon Rawles
Preserve Natural CapitalNatural capital – biodiversity, ecosystems <strong>and</strong> ecosystem services– must be preserved <strong>and</strong> restored as the foundation of humansocieties <strong>and</strong> economies. Efforts must particularly focus onprotecting <strong>and</strong> restoring key ecological processes necessary for food,water <strong>and</strong> energy security, as well as climate change resilience <strong>and</strong>adaptation. The Earth’s diversity of species <strong>and</strong> habitats must alsobe preserved for their intrinsic value.i. Significantly exp<strong>and</strong> the global protected areasnetwork• Protect 20 per cent of representative l<strong>and</strong>, freshwater <strong>and</strong>marine areas, including areas key for ecological processesnecessary for biodiversity, food, water <strong>and</strong> energy security,<strong>and</strong> climate change resilience <strong>and</strong> adaptation.• Implement adequate funding mechanisms for effectiveprotected area management.Halting forest degradation <strong>and</strong> deforestationAchieving Zero Net Deforestation <strong>and</strong> Degradation (ZNDD)would not only stem the depletion of forest-based biodiversity<strong>and</strong> ecosystem services, but also eliminate the second-largestsource of anthropogenic greenhouse gas emissions. WWFadvocates ZNDD by 2020 to reflect the scale <strong>and</strong> urgency ofthese threats.WWF defines ZNDD as: no net forest loss throughdeforestation <strong>and</strong> no net decline in forest quality throughdegradation; <strong>and</strong> stresses that: (a) most natural forest shouldbe retained – the annual rate of loss of natural or semi-naturalforests should be reduced to near zero; <strong>and</strong> (b) any gross loss ordegradation of pristine natural forests would need to be offsetby an equivalent area of socially <strong>and</strong> environmentally soundforest restoration.WWF’s Living Forests Model projects that it is possibleto achieve ZNDD by 2020, <strong>and</strong> warns that the longer it takes toachieve this goal the harder it will become to stem forest loss.But major changes in l<strong>and</strong> <strong>and</strong> resource use will be needed; theimplications <strong>and</strong> options for this are explored in WWF’s LivingForests Report (WWF, 2011a; b; c).Efforts must focuson protecting<strong>and</strong> restoring keyecological processesnecessary for food,water <strong>and</strong> energysecurity, as wellas climate changeresilience <strong>and</strong>adaptationii. Halt loss of priority habitats• Achieve Zero Net Deforestation <strong>and</strong> Degradation by 2020 <strong>and</strong>maintain thereafter.• Halt fragmentation of freshwater systems.• Increase the area of effectively managed marine protected areasfrom 5 per cent to at least 20 per cent.iii. Restore damaged ecosystems <strong>and</strong>ecosystem services• Prioritize restoration of ecosystems <strong>and</strong> ecosystem servicesnecessary for food, water <strong>and</strong> energy security, <strong>and</strong> climatechange resilience <strong>and</strong> adaptation.Water reserves: Securing water resources forpeople <strong>and</strong> natureThe Mexican National Water Commission(CONAGUA), with support from WWF <strong>and</strong> the FundacionGonzalo Río Arronte, is working to manage freshwaterecosystems. In 2011, a national environmental flow st<strong>and</strong>ardwas approved, <strong>and</strong> 189 basins were identified as potential “waterreserves”: watersheds with high biological richness <strong>and</strong> relativelyhigh water availability. These basins are the main targets of theNational Water Reserves Program (CONAGUA, 2011) that iscreating conditions to safeguard the natural flow regimes thatsustain critical ecosystems, secure the services they support<strong>and</strong> maintain buffering capacity against climate uncertainty<strong>and</strong> water scarcity risk.WWF Living Planet Report 2012 page 110 Chapter 4: Better <strong>choices</strong> for a living planet page 111
Produce <strong>better</strong>Efficient production systems would help lower humanity’sEcological Footprint to within ecological limits by significantlyreducing human dem<strong>and</strong> for water, l<strong>and</strong>, energy <strong>and</strong> other naturalresources. This is especially urgent in light of the growing humanpopulation <strong>and</strong> the need to meet the needs of the world’s poor. Suchsystems must manage food, fibre, energy <strong>and</strong> water in an integratedmanner, <strong>and</strong> ensure that sustainability is no longer a choice, butembedded into every commodity, product <strong>and</strong> process.iv. Significantly reduce inputs <strong>and</strong> waste inproduction systems• Increase total food supply-chain efficiency.• Maximize energy, water <strong>and</strong> material efficiency.• Maximize recycling <strong>and</strong> recovery.• Minimize greenhouse gas emissions.A new energy paradigmIn order for the world to stay below 2°C of warming – <strong>and</strong> so avoiddangerous climate change – global greenhouse gas emissions mustbe reduced to no more than 80 per cent of 1990 levels by 2050.The energy sector is key to achieving this goal. WWF’sEnergy Report presents one of the possible pathways towardachieving a cost-effective energy system, based wholly on renewableenergy (WWF, 2011d). The report raises a number of significantissues <strong>and</strong> challenges – political, economic, environmental <strong>and</strong>social – that will need to be addressed in order to realize thisenergy vision <strong>and</strong> minimize the impact of using more bioenergy.Better cotton in PakistanPakistan is the world’s third-largest producer of cotton, whichcontributes 55 per cent of its foreign earnings. 40,000 farmers inPakistan are now growing cotton with help from the Better CottonInitiative – a programme initiated by WWF <strong>and</strong> IKEA in 2006 toreduce the severe environmental impacts of conventional cottonproduction. In 2010, 170,000 hectares of cotton production utilized40 per cent less chemical fertilizers, 47 per cent less pesticides <strong>and</strong>37 per cent less water. <strong>Biodiversity</strong> was not the only beneficiary.While yields remained the same, farmers received a 15 per centincrease in income <strong>and</strong> their working conditions improvedsubstantially. Support for the initiative came from Levi Strauss<strong>and</strong> Co, H&M, Adidas <strong>and</strong> Marks & Spencer (WWF, 2003).Efficient productionsystems would helplower humanity’sEcologicalFootprint to withinecological limitsv. Manage resources sustainably• Eliminate overfishing by commercial fleets, including theindiscriminate capture of non-target organisms.• Eliminate water over-abstraction.• Implement policies to secure water quality.• Minimize further habitat conversion through maximizingthe sustainable use of productive l<strong>and</strong> by improvinggenetic selection, adopting best practices, increasingefficiency, improving soil organic matter <strong>and</strong> rehabilitatingdegraded l<strong>and</strong>s.vi. Scale-up renewable energy production• Increase the proportion of sustainable renewable energies inthe global energy mix to at least 40 per cent by 2030 <strong>and</strong> 100per cent by 2050.• Increase the share of renewable energy in the overall energymix, along with ambitious energy dem<strong>and</strong> management,especially in sectors with limited renewable options that arelikely to be dependent on bioenergy. (Aviation, shipping <strong>and</strong>high heat industrial applications are likely to be among these.)Certification in ChileChile currently has one of the strongest economies in Latin America,with projections suggesting that it could meet OECD criteria fordeveloped countries by 2020. It supplies 8 per cent of the globalpulp <strong>and</strong> paper market. To avoid large environmental impacts <strong>and</strong>depletion of natural resources, fundamental <strong>choices</strong> are needed totransform the forestry sector <strong>and</strong> enable Chile to continue to supplypulp <strong>and</strong> paper in a more environmentally <strong>and</strong> socially sustainableway. The rising global dem<strong>and</strong> for Forest Stewardship Council(FSC) certified paper is contributing to this transformation. WWF istherefore working closely with the forestry sector <strong>and</strong> the governmentof Chile to strengthen <strong>and</strong> broaden the scope of FSC certification.Similar developments are underway in Chile’s oceans <strong>and</strong> lakes.Chile is an important exporter of fish: It accounts for around 30 percent of the global salmon market, 13 per cent of the global market forforage fish; <strong>and</strong> 3 per cent of the global market for whitefish. MarineStewardship Council (MSC) certification is an important mechanismto tackle the current overexploitation of the Chilean fisheries <strong>and</strong> toachieve both environmentally sustainable <strong>and</strong> economically viablefisheries. The Chilean hake fishery has recently become the first toenter the MSC certification process. The Chilean salmon industry isworking with WWF in developing Aquaculture Stewardship Council(ASC) st<strong>and</strong>ards for sustainable salmon farming.WWF Living Planet Report 2012 page 112 Chapter 4: Better <strong>choices</strong> for a living planet page 113
Consume more wiselyLiving within the Earth’s ecological limits also requires a globalconsumption pattern in balance with the Earth’s <strong>biocapacity</strong>. Theimmediate focus must be on drastically shrinking the EcologicalFootprint of high-income populations – particularly their carbonfootprint. Changed dietary patterns among wealthy populations<strong>and</strong> reduced food waste are crucial, as is innovation for “low<strong>and</strong> fair” footprint solutions that allow developing nations <strong>and</strong>emerging economies to fulfil human needs <strong>and</strong> rights.vii. Change energy consumption patterns• Decrease energy dem<strong>and</strong> by 15 per cent by 2050 comparedto 2005.• Increase the proportion of electricity produced usingrenewable energy to cover all global energy needs by 2050.• Provide sustainable energy to everyone in “off-grid” areas.The immediatefocus must beon drasticallyshrinking theEcologicalFootprint of highincomepopulationsviii. Promote healthy consumption patterns• Balance protein intake per capita as recommended by theWorld Health Organization (WHO).• Minimize retailer <strong>and</strong> consumer food waste in high- <strong>and</strong>middle-income countries.ix. Achieve low-footprint lifestyles• Minimize resource consumption <strong>and</strong> waste by highincomeindividuals.• Maximize market share of certified sustainable products.• Transition urban areas to “smart” cities with low-footprintsolutions for meeting urban housing, food, water, energy, <strong>and</strong>mobility needs.The impact of food <strong>choices</strong>The type <strong>and</strong> amount of food eaten by people living in higherincomecountries already has global impacts on climate change,l<strong>and</strong> <strong>and</strong> sea use, water availability <strong>and</strong> quality, biodiversity<strong>and</strong> equity issues. Future scenarios for achieving Zero NetDeforestation <strong>and</strong> Degradation <strong>and</strong> 100 per cent renewableenergy are dependent on changed food consumption patterns.In particular, red meat <strong>and</strong> dairy consumption, <strong>and</strong> overall foodloss <strong>and</strong> waste, must decrease in developed countries. Theneveryone on the planet can enjoy healthy levels of protein intheir diets, more space can be kept for nature, <strong>and</strong> bioenergycan exp<strong>and</strong> without creating food shortages. Such a shift is alsonecessary to provide everyone on the planet with healthy levels ofprotein in their diet. Achieving such dietary changes will requirecooperation from a broad set of stakeholders, including the foodindustry, governments, health institutions (such as the WorldHealth Organization), consumer groups <strong>and</strong> individuals.WWF Living Planet Report 2012 page 114 Chapter 4: Better <strong>choices</strong> for a living planet page 115
ENOUGH FOR ALLNot much goes to waste on Margaret’s farm. But for a rapidlyurbanizing population, growing their own food may not bean option. Instead, consumers can learn about where foodcomes from <strong>and</strong> how it is produced. By asking questions<strong>and</strong> demonstrating a commitment to sustainability, each ofus can help push retailers to improve efficiency along theirsupply chains. A series of <strong>better</strong> <strong>choices</strong> can contribute to thefight against hunger <strong>and</strong> poverty, while conserving nature.© WWF-Canon / Simon Rawles
Redirect financial flowsIn too many cases, the overexploitation of resources <strong>and</strong> damageor destruction of ecosystems are highly profitable for a fewstakeholders in the short term; while the long-term benefitsof protecting, maintaining <strong>and</strong> investing in natural capital areinadequately valued or not valued in an economic sense at all.As a result, the importance of biodiversity <strong>and</strong> ecosystem servicesis undervalued in economic <strong>and</strong> political trade-offs. Redirectedfinancial flows that support conservation <strong>and</strong> sustainableecosystem management are therefore an essential enablingcondition for both preserving natural capital <strong>and</strong> for making<strong>better</strong> production <strong>and</strong> consumption <strong>choices</strong> – <strong>and</strong> ensuring thatburdens are not passed on to future generations.x. Value nature• Implement an inclusive <strong>and</strong> globally accepted systemfor measuring the economic <strong>and</strong> non-economic value ofnatural capital.• Fully integrate this value into mainstream economicdevelopment policy <strong>and</strong> decision-making.€$¥Redirected financialflows supportconservation<strong>and</strong> sustainableecosystemmanagementxi. Account for environmental <strong>and</strong> social costs• Integrate social <strong>and</strong> environmental costs of production <strong>and</strong>consumption over long timeframes into st<strong>and</strong>ard national<strong>and</strong> corporate accounting <strong>and</strong> reporting methodologies.• Ensure that social <strong>and</strong> environmental costs are reflected inthe market price of all commodities <strong>and</strong> products, <strong>and</strong> inenvironmental impact assessments.xii. Support <strong>and</strong> reward conservation, sustainableresource management <strong>and</strong> innovation• Eliminate all subsidies that undermine sustainable resourceuse <strong>and</strong> conservation, particularly those underpinning fossilfuel use <strong>and</strong> unsustainable agriculture, forestry <strong>and</strong> fisheries.• Develop/implement new financial mechanisms that redirectpublic <strong>and</strong> private investment to support sustainable practices<strong>and</strong> new technologies for sustainability, <strong>and</strong> provide newadditional financing for conservation <strong>and</strong> restoration ofnatural capital.• Improve policy for increased investments <strong>and</strong> large-scaledeployment of innovations <strong>and</strong> new technologies thatcan enable sustainable development in both public <strong>and</strong>private spheres.The sustainable finance sectorThe International Finance Corporation (IFC), the private sectorbranch of the World Bank Group, reports an 11 per cent higherreturn from companies that demonstrate environmental <strong>and</strong>social st<strong>and</strong>ards. By attaching sustainability criteria to theirlending <strong>and</strong> investment conditions, financial institutions canhelp raise st<strong>and</strong>ards in critical markets. Important incentivesinclude cost savings from using resources efficiently, avoidingreputational risks <strong>and</strong> <strong>better</strong> access to markets. WWF engageswith leading financial institutions such as IFC in developingnew risk management tools <strong>and</strong> services. The IFC performancest<strong>and</strong>ards, which include credible st<strong>and</strong>ards such as MSC <strong>and</strong>FSC, are now adopted by 70 financial institutions worldwide.With guidance from WWF, Rabobank – the largest agriculturalfinancer in the world – has attached similar sustainabilityconditions to its investments.WWF Living Planet Report 2012 page 118 Chapter 4: Better <strong>choices</strong> for a living planet page 119
Equitable resourcegovernanceEquitable resource governance is the second essential enablingcondition to shrink <strong>and</strong> share our resource use to stay withinthe regenerative capacity of one planet. In addition to efforts toreduce the footprint of high-income populations (see “Consumemore wisely” section), we must also improve health <strong>and</strong> educationst<strong>and</strong>ards, <strong>and</strong> create viable economic development plans. Thesemust exist within legal <strong>and</strong> policy frameworks that provide equitableaccess to food, water <strong>and</strong> energy, <strong>and</strong> be supported by inclusiveprocesses for sustainably managed l<strong>and</strong> use. Equitable resourcegovernance also requires a changed definition of well-being <strong>and</strong>success that includes personal, societal <strong>and</strong> environmental health.Cities as solution hot spots for aOne Planet economyWhile political gridlock may stop rational action elsewhere,leading cities are already realizing the shared benefits of footprintreduction, social well-being <strong>and</strong> economic resilience. WWF’sEarth Hour City Challenge invites cities to inspire the world withtheir plans for moving towards a 100% renewable economy <strong>and</strong>supporting One Planet Lifestyles. Whereas Earth Hour channelsthe public’s impatient calls for global political action, the EarthHour City Challenge helps local governments realize the social,economic <strong>and</strong> ecological benefits of developing One Planetsolutions (for housing, energy, mobility, food, etc.) togetherwith their citizens <strong>and</strong> businesses. City Challenge c<strong>and</strong>idatesare supported to report their performance, commitments <strong>and</strong>action plans. Public participation is promoted <strong>and</strong> best practicefrom finalist cities in all countries is documented <strong>and</strong> sharedinternationally. An international jury of experts awards the cityundertaking the most inspiring, ambitious <strong>and</strong> credible actions“Earth Hour Capital of the year”.For more information: http://www.earthhour.org/Equitable resourcegovernance is ANessential enablingcondition to shrink<strong>and</strong> share ourresource useInvestmentin energyefficient urbaninfrastructure<strong>and</strong> ecosystemservices is essentialto ensure food,water <strong>and</strong> energysecurity forbillions of peoplexiii. Share available resources• Implement natural resource governance built on inclusiveprocesses <strong>and</strong> broad participation by communities dependenton natural resources.• Minimize the footprint of high-income populations <strong>and</strong> urbanareas (see “Consume more wisely”).• Promote the transition toward sustainable, resource-efficientcities <strong>and</strong> reduce the direct impact of cities on water <strong>and</strong> l<strong>and</strong>by limiting urban sprawl, promoting urban agriculture <strong>and</strong>sustainable waste (water) management.xiv. Make fair <strong>and</strong> ecologically informed <strong>choices</strong>• Implement policies <strong>and</strong> tools for analysing, resolving <strong>and</strong>managing competing l<strong>and</strong> use <strong>and</strong> water use claims.xv. Measure success “beyond GDP”• Include social <strong>and</strong> environmental indices in national indicatorsto measure <strong>and</strong> reward success.• Implement economic policies with targets <strong>and</strong> indicators tomonitor the impact of economic governance on natural capital<strong>and</strong> human well-being.xvi. Sustainable population• Explicitly integrate population dynamics (size, growthrate, composition, location <strong>and</strong> migration) <strong>and</strong> per capitaconsumption trends into national planning policies to support a<strong>better</strong> balance between population <strong>and</strong> available resources.• Ensure universal access to gender-sensitive reproductive healthservices <strong>and</strong> information, reduce child mortality <strong>and</strong> supportthe empowerment of women <strong>and</strong> young girls through greateraccess to higher education <strong>and</strong> employment opportunities.WWF Living Planet Report 2012 page 120 Chapter 4: Better <strong>choices</strong> for a living planet page 121
FINDING A NEW WAYOnce on a path, it can be difficult to see other routes. It canbe tempting to think that the current way is the only way.But that’s rarely the case. Margaret has farmed her l<strong>and</strong> fordecades <strong>and</strong> raised two children, thinking their lives wouldbe much like hers. But through her willingness to change,she has opened new opportunities for the next generation.With her new income, she will send her son to studycomputers. Our adaptability <strong>and</strong> creativity can put humanityon a <strong>better</strong> path.© WWF-Canon / Simon Rawlesdesign note:Check for gutter <strong>and</strong> repeatimage if necessary
Closing words:actions from inspirATIONAL leadersIt always seems impossibleuntil it’s doneNelson M<strong>and</strong>elaI just have somethinginside me that tells methere is a problem <strong>and</strong>I must do somethingabout it, so I am doingsomething about itWangari MaathaiThe vulnerable needsolutions from you; <strong>and</strong>future generations need avisionary legacy from youChristiana FigueresWe must be the change wewish to see in the worldMahatma G<strong>and</strong>hiSustainable development is anotion of discipline. It meanshumanity must ensure thatmeeting present needs does notcompromise the ability of futuregenerations to meet their needsGro Harlem Brundtl<strong>and</strong>You cannot solve a problemfrom the same consciousnessthat created it. You mustlearn to see the world anewAlbert EinsteinWWF Living Planet Report 2012 page 124 Chapter 4: Better <strong>choices</strong> for a living planet page 125
Annex: Technicalnotes <strong>and</strong> datatables~Photo: A hurricane as viewed from the International Space Station.© ESA / T. Reiter
Annex 1:The Living Planet IndexWhat is the Living Planet Index?The Living Planet Index (LPI) tracks trends in a large number ofpopulations of species in much the same way that a stock marketindex tracks the value of a set of shares or a retail price indextracks the cost of a basket of consumer goods. The data used inconstructing the index are time series of either population size,density, abundance or a proxy of abundance. For example, thenumber of nests or breeding pairs recorded may be used instead ofa direct count of population. The Living Planet Index now containspopulations between 1970 <strong>and</strong> 2008.How many species <strong>and</strong> populations are there in the20012 LPI?The Living Planet Index is based on trends in 9,014 populations of2,688 species of mammal, bird, reptile, amphibian <strong>and</strong> fishfrom around the globe. This represents a substantial increase indata from previous years <strong>and</strong> means we have an ever clearer pictureabout the status the world’s vertebrate species, which are themselvesan indicator of the state of our natural capital.What “cuts” of the LPI are included in the LivingPlanet Report (LPR) 2012?LPR 2012 contains cuts of the LPI to reflect trends in:1. Tropical <strong>and</strong> temperateThe tropical index consists of terrestrial <strong>and</strong> freshwaterspecies’ populations found in the Afrotropical, Indo-Pacific <strong>and</strong>Neotropical realms, as well as marine species’ populations fromthe zone between the Tropics of Cancer <strong>and</strong> Capricorn.The temperate index includes terrestrial <strong>and</strong> freshwaterspecies’ populations from the Palearctic <strong>and</strong> Nearctic realms,as well as marine species’ populations found north or southof the tropics.2. Systems – freshwater, marine <strong>and</strong> terrestrialThis was assigned according to the system in which thepopulation was monitored <strong>and</strong> in which it is normally found.Some species, such as Pacific salmon, can be found in bothfreshwater <strong>and</strong> marine environments, so it was possible fordifferent populations of the same species to be included indifferent indices.3. Biogeographic realms – Afrotropical, Neotropical,Palearctic, Nearctic <strong>and</strong> Indo-PacificBiogeographic realms combine geographic regions with thehistoric <strong>and</strong> evolutionary distribution patterns of terrestrialplants <strong>and</strong> animals. They represent large areas of the Earth’ssurface separated by major barriers to plant <strong>and</strong> animal migration– such as oceans, broad deserts <strong>and</strong> high mountain ranges –where terrestrial species have evolved in relative isolation overlong periods of time.Trends in the LPIWhat are the main trends in the latest LPI?The global Living Planet Index has declined by 28 per cent between1970 <strong>and</strong> 2008.The index shows that the decline in biodiversity has beenmore much serious in tropical regions – where the index shows anaverage decline of 60 per cent – than in temperate regions, wherethere had already been significant biodiversity losses before 1970.Temperate regions show an average increase of 30 per cent in theindex; however, this average does mask losses in individual speciesor regions whose conservation status has worsened. Moreover, thetemperate index starts from a much lower baseline in 1970 thanthe tropical index, since most of the decline in temperate zoneshappened before 1970. The Living Planet Index is also calculatedfor systems <strong>and</strong> biogeographical realms, providing a clearer picturethan ever before of the state of the world’s biodiversity.Between 1970 <strong>and</strong> 2008 temperate species showedan overall increase – particularly in comparison totropical species. How can we explain this?One explanation is that most habitat destruction since 1970 hastaken place in the tropics. However, that is not to say that the stateof biodiversity in temperate regions is <strong>better</strong> than in the tropicsnecessarily. The LPI shows only trends since 1970. Most habitatalteration <strong>and</strong> destruction in temperate regions occurred prior to 1970.If data were available, an LPI from 1900 to 1970 might show a declinein temperate regions equal to that in the tropics from 1970 to 2008.Other causes of population decline in wild species that may have hada greater impact in the tropics since 1970 are overexploitation of species<strong>and</strong> introduction of alien invasive species. Again, the important pointto remember is that these drivers of biodiversity loss are not restrictedto the tropics, but have occurred there mostly post-1970, whereas intemperate regions these processes have been at work for much longer.WWF Living Planet Report 2012 page 128 Annex: Technical notes <strong>and</strong> data tables page 129
No. specieson indexPercent Change1970-200895% Confidence LimitsLowerUpperTotal Global 2688 -28% -38% -18%Temperate 1518 31% 19% 44%Tropical 1354 -61% -70% -49%Terrestrial Global 1432 -25% -34% -13%Temperate 757 5% -3% 15%Tropical 725 -44% -55% -30%Freshwater Global 737 -37% -49% -21%Temperate 436 36% 11% 67%Tropical 386 -70% -80% -57%Marine Global 675 -22% -44% 6%Temperate 438 53% 27% 85%Tropical 287 -62% -78% -32%Biogeographic realms Afrotropical 250 -38% -57% -12%Indo-Pacific 384 -64% -73% -51%Neotropical 515 -50% -69% -21%Nearctic 684 -6% -16% 6%Palearctic 535 6% -7% 17%By country income High income 1732 7% -1% 17%Middle income 1205 -31% -42% -19%Low income 204 -60% -72% -40%Table 1: Trends in theLiving Planet indicesbetween 1970 <strong>and</strong> 2008,with 95% confidencelimitsIncome categories arebased on the World Bankincome classifications(2008). Positive numbermeans increase, negativemeans decline.Why is the total number of species in the marine,freshwater <strong>and</strong> terrestrial LPIs more than that ofthe global index?The system the population is assigned depends on where thepopulation is located, rather than where the species lives in general.This means that some species, like Pacific salmon, can have bothmarine populations <strong>and</strong> freshwater populations, depending onwhere they are in their migration cycle. This effectively “doublecounts” the species numbers (but not the population numbers) asthey appear in both the marine <strong>and</strong> freshwater LPI cut, but onlyappear once in the global species counts.Cases like this are minimized by asking a series of questionsbefore assigning the population a system:1. In which system does the species spend the majority of its time?2. Which system does the species primarily rely on tosustain itself?3. In which system does the species breed?4. In which system is the species most threatened?Borderline cases are the hardest to assign. For example, how doyou assign a system to a seabird that spends most of its time atsea (where it is at risk from longline fishing), but breeds on l<strong>and</strong>(where it is being impacted by rats preying on its eggs)? These aredealt with on a case-by-case basis <strong>and</strong> result in some species beingincluded in more than one system, giving rise to the differences intotals seen in Table 1.Are extinct species included in the LPI?Possibly, although thankfully very few. For example, the baiji – orYangtze River dolphin – is now considered to be extinct (accordingto a survey in 2006 that failed to find any individuals in the YangtzeRiver in China). Accidental mortality caused by the fishing gearwidely used in the Yangtze ecosystem is thought to be the maincause. In any case, absence of evidence is not evidence of absence,<strong>and</strong> biologists normally consider an absence of 50 years as evidencefor extinction.What role has climate change played in the overalldecline of species, particularly in recent trends?It is likely that climate change has caused a decline in populationsof some species, particularly those in vulnerable ecosystems suchas coral reefs, mountains <strong>and</strong> the Arctic, but the LPI measures onlyaverage trends in species’ populations. We have not analysed thecauses of trends in species’ populations. Over the last 30 years,the principal cause of population decline in wild species has beenhabitat loss or alteration. Over the next 30 years, however, it isWWF Living Planet Report 2012 page 130 Annex: Technical notes <strong>and</strong> data tables page 131
likely that climate change will be a more important factor affectingpopulation trends, as well as itself being a driver of habitat loss<strong>and</strong> alteration.Calculating the LPIWhere do the data used in the LPI come from?All data used in constructing the index are time series of eitherpopulation size, density, abundance or a proxy of abundance. Thespecies’ population data used to calculate the index are gathered froma variety of sources. We collate time-series information for vertebratespecies from published scientific literature, online databases (e.g.,NERC Centre for Population Biology [Global Population DynamicsDatabase], Pan-European Common Bird Monitoring Scheme) <strong>and</strong>grey literature. Data are only included if a measure of population sizeis available for at least two years, <strong>and</strong> information available on howthe data were collected, what the units of measurement were <strong>and</strong> thegeographic location of the population. The data must be collected usingthe same method on the same population throughout the time series<strong>and</strong> the data source referenced <strong>and</strong> traceable.The period covered by the index is from 1970 to 2008.The year 2008 is chosen as the “cut-off” year for the index becausethere is not yet enough data to calculate a robust index for 2009-2011. Datasets are currently being added to the database to allowthe calculation of the index for those years.How is the Living Planet Index calculated?The LPI is based on population trends in over 2,600 vertebratespecies worldwide. Data on species’ populations from two or moreyears since 1970 are collected from a wide variety of publishedsources <strong>and</strong> entered into the LPI database. In some cases, wehave data on more than one population of a single species. Foreach population, the rate of change from one year to the nextis calculated. If we have data from only a few, non-consecutiveyears, we assume there was a constant annual rate of change in thepopulation between each data year. Where we have data from manyyears (consecutive or not) we fit a curve through the data pointsusing a statistical method called generalized additive modelling.Where we have more than one population trend for a single species,the average rate of change across all of the populations is calculatedfor each year. Then we calculate the average rate of change acrossall species from year to year. The index is set equal to 1 in 1970, <strong>and</strong>the average annual rate of population change is used to calculatethe index value in each successive year.Technical details of the calculationsAnnual data points were interpolated for time series with six ormore data points using generalized additive modelling, or byassuming a constant annual rate of change for time series with lessthan six data points. First, the average rate of change in each year iscalculated across all populations of a species, then across all species.The average annual rates of change in successive years were chainedtogether to make an index, with the index value in 1970 set to 1.Details of each of the methodologies used for each of the cutsof the LPI are outlined below:a. System LPIsEach species is classified as being terrestrial, freshwater ormarine, according to the system on which it is most dependentfor survival <strong>and</strong> reproduction. The indices for terrestrial,freshwater <strong>and</strong> marine systems were aggregated by giving equalweight to temperate <strong>and</strong> tropical species within each system,i.e., a tropical index <strong>and</strong> a temperate index were first calculatedfor each system <strong>and</strong> the two were then aggregated to create thesystem index.b. Realm LPIsEach species’ population in the LPI database was assigned toa realm according to its geographic location. Realm indiceswere calculated by giving equal weight to each species, withthe exception of the Palearctic realm, in which families wereaggregated with equal weight. This was done because thevolume of time series data for birds available from this realmfar outweighs all other species put together. The data fromIndo-Malaya, Australasia <strong>and</strong> Oceania were insufficient tocalculate indices for these realms, so they were combinedinto a super-realm, Indo-Pacific.How has the Living Planet Index changed sinceLPR 2010?On the whole, the results are very similar to the LPIs in LPR 2010.As we continue to add data, we are consistently seeing the samepatterns of population trend at the global level. The followingsection details changes to the data set since LPR 2010.Increases in the LPI DatabaseThe size of the dataset has increased by 13 per cent since LPR 2010(see Figure 59). As populations in the LPI are continually added,so the average trend for each index changes. As a result, the 2012dataset may show differences in the detail of some of the indicesproduced in 2010, but the overall trajectory of the trend remainsroughly the same.WWF Living Planet Report 2012 page 132 Annex: Technical notes <strong>and</strong> data tables page 133
Compared to 2010 there are:• 6 per cent more species <strong>and</strong> 13 per cent more populations inthe global LPI;• 7 per cent more terrestrial species <strong>and</strong> 19 per cent moreterrestrial populations;• 6 per cent more marine species <strong>and</strong> 18 per cent moremarine populations;• 3 per cent more freshwater species <strong>and</strong> 4 per cent morefreshwater populations.These changes have improved the spread of the data amongdifferent regions <strong>and</strong> different taxa also. There is a <strong>better</strong> balancebetween tropical <strong>and</strong> temperate species; for example, tropicalspecies now account for 47 per cent of the species in the indexcompared to 41 per cent in 2010. Each of the taxa is <strong>better</strong>represented; for example, reptile species have increased by thegreatest proportion at 39 per cent. Increasing the dataset in thisway generally improves the robustness of the indices <strong>and</strong> usuallyproduces smoother trends.Methodology changesThe method used to calculate the LPI has remained unchangedsince 2008 (see Collen et al., 2009 for more details).Number of populations1000090008000700060005000400030002000Living PlanetReport 20061,313 SpeciesLiving PlanetReport 20081,686 SpeciesMar 06Jun 06Sep 06Dec 06Apr 07Jul 07Oct 07Jan 08May 08Aug 08Living PlanetReport 20102,544 SpeciesNov 08Mar 09Jun 09Sep 09Dec 09Apr 10Jul 10Oct 10Feb 11May 11Living PlanetReport 20122,688 SpeciesAug 11Nov 11Figure 59: Thecumulative number ofpopulation time seriesin the LPI databaseAnnex 2: EcologicalFootprint: Frequentlyasked questionsHow is the Ecological Footprint calculated?The Ecological Footprint measures the amount of biologicallyproductive l<strong>and</strong> <strong>and</strong> water area required to produce the resources anindividual, population or activity consumes <strong>and</strong> to absorb the wasteit generates, given prevailing technology <strong>and</strong> resource management.This area is expressed in global hectares (hectares with worldaveragebiological productivity). Footprint calculations use yieldfactors to normalize countries’ biological productivity to worldaverages (e.g., comparing tonnes of wheat per UK hectare versus perworld average hectare) <strong>and</strong> equivalence factors to take into accountdifferences in world average productivity among l<strong>and</strong> types (e.g.,world average forest versus world average cropl<strong>and</strong>).Footprint <strong>and</strong> <strong>biocapacity</strong> results for countries are calculatedannually by the Global Footprint Network. Collaborations withnational governments are invited, <strong>and</strong> serve to improve the data<strong>and</strong> methodology used for the National Footprint Accounts. To date,Switzerl<strong>and</strong> has completed a review, <strong>and</strong> Belgium, Ecuador, Finl<strong>and</strong>,Germany, Irel<strong>and</strong>, Japan <strong>and</strong> the UAE have partially reviewedor are reviewing their accounts. The continuing methodologicaldevelopment of the National Footprint Accounts is overseen by aformal review committee. A detailed methods paper <strong>and</strong> copies ofsample calculation sheets can be obtained fromwww.footprintnetwork.orgFootprint analyses can be conducted at any scale. Thereis growing recognition of the need to st<strong>and</strong>ardize sub-nationalFootprint applications in order to increase comparability acrossstudies <strong>and</strong> longitudinally. Methods <strong>and</strong> approaches for calculatingthe Footprint of municipalities, organizations <strong>and</strong> products arecurrently being aligned through a global Ecological Footprintst<strong>and</strong>ards initiative. For more information on Ecological Footprintst<strong>and</strong>ards see www.footprintst<strong>and</strong>ards.orgWWF Living Planet Report 2012 page 134 Annex: Technical notes <strong>and</strong> data tables page 135
What is included in the Ecological Footprint?What is excluded?To avoid exaggerating human dem<strong>and</strong> on nature, the EcologicalFootprint includes only those aspects of resource consumption <strong>and</strong>waste production for which the Earth has regenerative capacity, <strong>and</strong>where data exists that allow this dem<strong>and</strong> to be expressed in terms ofproductive area. For example, toxic releases are not accounted forin Ecological Footprint accounts. Nor are freshwater withdrawals,although the energy used to pump or treat water is included.Ecological Footprint accounts provide snapshots of pastresource dem<strong>and</strong> <strong>and</strong> availability. They do not predict the future.Thus, while the Footprint does not estimate future losses causedby current degradation of ecosystems, if this degradation persistsit may be reflected in future accounts as a reduction in <strong>biocapacity</strong>.Footprint accounts also do not indicate the intensitywith which a biologically productive area is being used. Being abiophysical measure, it also does not evaluate the essential social<strong>and</strong> economic dimensions of sustainability.How is international trade taken into account?The National Footprint Accounts calculate the Ecological Footprintassociated with each country’s total consumption by summingthe Footprint of its imports <strong>and</strong> its production, <strong>and</strong> subtractingthe Footprint of its exports. This means that the resource use <strong>and</strong>emissions associated with producing a car that is manufactured inJapan, but sold <strong>and</strong> used in India, will contribute to India’s ratherthan Japan’s consumption Footprint.National consumption Footprints can be distorted when theresources used <strong>and</strong> waste generated in making products for exportare not fully documented for every country. Inaccuracies in reportedtrade can significantly affect the Footprint estimates for countrieswhere trade flows are large relative to total consumption. However,this does not affect the total global Footprint.How does the Ecological Footprint account for theuse of fossil fuels?Fossil fuels such as coal, oil <strong>and</strong> natural gas are extracted fromthe Earth’s crust <strong>and</strong> are not renewable in ecological time spans.When these fuels burn, carbon dioxide (CO2) is emitted into theatmosphere. There are two ways in which this CO2 can be stored:human technological sequestration of these emissions, such asdeep-well injection, or natural sequestration. Natural sequestrationoccurs when ecosystems absorb CO2 <strong>and</strong> store it either in st<strong>and</strong>ingbiomass, such as trees, or in soil.The Carbon footprint is calculated by estimating how muchnatural sequestration would be necessary to maintain a constantconcentration of CO2 in the atmosphere. After subtracting theamount of CO2 absorbed by the oceans, Ecological Footprintaccounts calculate the area required to absorb <strong>and</strong> retain theremaining carbon based on the average sequestration rate of theworld’s forests. CO2 sequestered by artificial means would also besubtracted from the Ecological Footprint total, but at present thisquantity is negligible. In 2008, 1 global hectare could absorb theCO2 released by burning approximately 1,450 litres of gasoline.Expressing CO2 emissions in terms of an equivalentbioproductive area does not imply that carbon sequestrationin biomass is the key to resolving global climate change. On thecontrary, it shows that the biosphere has insufficient capacityto offset current rates of anthropogenic CO2 emissions. Thecontribution of CO2 emissions to the total Ecological Footprintis based on an estimate of world average forest yields. Thissequestration capacity may change over time. As forests mature,their CO2 sequestration rates tend to decline. If these forests aredegraded or cleared, they may become net emitters of CO2.Carbon emissions from some sources other than fossil fuelcombustion are incorporated in the National Footprint Accountsat the global level. These include fugitive emissions from the flaringof gas in oil <strong>and</strong> natural gas production, carbon released by chemicalreactions in cement production <strong>and</strong> emissions from tropicalforest fires.How does the Ecological Footprint account forcarbon emissions absorbed by the oceans versusuptake by forests?The National Footprint Accounts calculate the Carbon Footprintby considering sequestration from the world’s oceans <strong>and</strong> forests.Annual ocean uptake values are taken from Khatiwala et al., 2009(ref: Khatiwala, S. et al., 2009. Reconstruction of the history ofanthropogenic CO2 concentrations in the ocean. Nature 462, 346-350) <strong>and</strong> used with the anthropogenic carbon emissions taken fromCDIAC (CDIAC, 2011). There is a relatively constant percentageuptake for oceans, varying between 28 per cent <strong>and</strong> 35 per cent overthe period 1961-2008. The remaining CO2 requires l<strong>and</strong> basedsequestration. Due to the limited availability of large-scale datasets,the calculation currently assumes the world average sequestrationrate for uptake of carbon dioxide into forests. Therefore the CarbonFootprint is a measure of the area of world average forest l<strong>and</strong> thatis necessary to sequester the carbon dioxide emissions that are notabsorbed into the world’s oceans.WWF Living Planet Report 2012 page 136 Annex: Technical notes <strong>and</strong> data tables page 137
Does the Ecological Footprint take into accountother species?The Ecological Footprint compares human dem<strong>and</strong> on biodiversitywith the natural world’s capacity to meet this dem<strong>and</strong>. It thus servesas an indicator of human pressure on local <strong>and</strong> global ecosystems.In 2008, humanity’s dem<strong>and</strong> exceeded the biosphere’s regenerationrate by more than 50 per cent. This overshoot may result indepletion of ecosystems <strong>and</strong> fill-up of waste sinks. This ecosystemstress may negatively impact biodiversity. However, the Footprintdoes not measure this latter impact directly, nor does it specifyhow much overshoot must be reduced if negative impacts are tobe avoided.For additional information about current Ecological Footprintmethodology, data sources, assumptions <strong>and</strong> results, please visit:www.footprintnetwork.org/atlasFor more information on the Ecological Footprint at a globallevel, please see: (Butchart et al., 2010; Global Footprint Network,2010; GTZ, 2010; Kitzes et al., 2009; Kitzes et al., 2008) at aregional <strong>and</strong> national level, please see (Ewing et al., 2009; GlobalFootprint Network, 2008; WWF, 2007; 2008a) <strong>and</strong> for furtherinformation on the methodology used to calculate the EcologicalFootprint, please see (Ewing B. et al., 2009; Galli et al., 2007).Does the Ecological Footprint say what is a “fair” or“equitable” use of resources?The Footprint documents what has happened in the past. Itcan quantitatively describe the ecological resources used by anindividual or a population, but it does not prescribe what theyshould be using. Resource allocation is a policy issue, based onsocietal beliefs about what is or is not equitable. While Footprintaccounting can determine the average <strong>biocapacity</strong> that is availableper person, it does not stipulate how this <strong>biocapacity</strong> should beallocated among individuals or countries. However, it does providea context for such discussions.How relevant is the Ecological Footprint if thesupply of renewable resources can be increased <strong>and</strong>advances in technology can slow the depletion ofnon-renewable resources?The Ecological Footprint measures the current state of resourceuse <strong>and</strong> waste generation. It asks: In a given year, did hum<strong>and</strong>em<strong>and</strong>s on ecosystems exceed the ability of ecosystems to meetthese dem<strong>and</strong>s? Footprint analysis reflects both increases in theproductivity of renewable resources <strong>and</strong> technological innovation(for example, if the paper industry doubles the overall efficiencyof paper production, the footprint per tonne of paper will halve).Ecological Footprint Accounts capture these changes once theyoccur <strong>and</strong> can determine the extent to which these innovationshave succeeded in bringing human dem<strong>and</strong> within the capacity ofthe planet’s ecosystems. If there is a sufficient increase in ecologicalsupply <strong>and</strong> a reduction in human dem<strong>and</strong> due to technologicaladvances or other factors, Footprint Accounts will show this asthe elimination of global overshoot.WWF Living Planet Report 2012 page 138 Annex: Technical notes <strong>and</strong> data tables page 139
Table 2: Ecological Footprint data tables. Please note: World populationis inclusive of countries not included in the Table. Table includesFootprint data for countries with populations greater than 1 million.Country/regionPopulation(millions)Cropl<strong>and</strong>Grazing l<strong>and</strong>Forest l<strong>and</strong>FishinggroundCarbonEcological Footprint 2008(global hectares per person)Built up l<strong>and</strong>TotalEcologicalFootprintCropl<strong>and</strong>Grazing l<strong>and</strong>Forest l<strong>and</strong>FishinggroundBuilt up l<strong>and</strong>Biocapacity 2008(global hectares per person)Total<strong>biocapacity</strong>Country/regionPopulation(millions)Cropl<strong>and</strong>Grazing l<strong>and</strong>Forest l<strong>and</strong>FishinggroundCarbonEcological Footprint 2008(global hectares per person)Built up l<strong>and</strong>TotalEcologicalFootprintCropl<strong>and</strong>Grazing l<strong>and</strong>Forest l<strong>and</strong>FishinggroundBuilt up l<strong>and</strong>Biocapacity 2008(global hectares per person)Total<strong>biocapacity</strong>Country/regionPopulation(millions)Cropl<strong>and</strong>Grazing l<strong>and</strong>Forest l<strong>and</strong>FishinggroundCarbonEcological Footprint 2008(global hectares per person)Built up l<strong>and</strong>TotalEcologicalFootprintCropl<strong>and</strong>Grazing l<strong>and</strong>Forest l<strong>and</strong>FishinggroundBuilt up l<strong>and</strong>Biocapacity 2008(global hectares per person)World 6,739.6 0.59 0.21 0.26 0.10 1.47 0.06 2.70 0.57 0.23 0.76 0.16 0.06 1.78High-incomecountriesMiddle-incomecountriesLow-incomecountriesTotal<strong>biocapacity</strong>1,037.0 1.03 0.31 0.58 0.19 3.38 0.11 5.60 0.98 0.28 1.17 0.51 0.11 3.054,394.1 0.53 0.17 0.19 0.10 0.85 0.07 1.92 0.49 0.21 0.78 0.16 0.07 1.721,297.5 0.47 0.12 0.23 0.06 0.18 0.07 1.14 0.46 0.21 0.31 0.09 0.07 1.14Africa 975.5 0.51 0.23 0.29 0.07 0.29 0.06 1.45 0.46 0.41 0.48 0.11 0.06 1.52Algeria 34.4 0.51 0.35 0.13 0.02 0.62 0.02 1.65 0.19 0.31 0.02 0.01 0.02 0.56Angola 18.0 0.36 0.14 0.13 0.11 0.09 0.06 0.89 0.29 1.66 0.72 0.25 0.06 2.98Benin 8.4 0.55 0.06 0.31 0.10 0.30 0.04 1.36 0.46 0.04 0.41 0.03 0.04 0.98Botswana 2.0 0.42 1.22 0.18 0.01 0.93 0.07 2.84 0.17 2.58 0.65 0.28 0.07 3.76Burkina Faso 15.5 0.84 0.19 0.35 0.01 0.06 0.08 1.53 0.83 0.18 0.27 0.00 0.08 1.37Burundi 7.9 0.26 0.07 0.45 0.01 0.02 0.04 0.85 0.24 0.15 0.01 0.01 0.04 0.45Cameroon 18.8 0.48 0.12 0.27 0.06 0.11 0.05 1.09 0.52 0.11 1.08 0.11 0.05 1.87Central AfricanRepublic4.2 0.37 0.62 0.30 0.01 0.03 0.04 1.36 0.32 0.62 7.38 0.00 0.04 8.35Chad 10.7 0.64 0.87 0.29 0.01 0.01 0.08 1.89 0.60 1.36 1.05 0.09 0.08 3.17Congo 3.8 0.26 0.11 0.48 0.07 0.12 0.03 1.08 0.14 3.51 8.07 0.44 0.03 12.20Congo, DemocraticRepublic of62.5 0.15 0.02 0.50 0.01 0.03 0.05 0.76 0.13 0.28 2.60 0.05 0.05 3.10Egypt 78.3 0.66 0.07 0.16 0.03 0.96 0.18 2.06 0.45 0.00 0.00 0.02 0.18 0.65Eritrea 4.9 0.16 0.23 0.20 0.01 0.03 0.03 0.66 0.09 0.23 0.10 1.01 0.03 1.47Ethiopia 79.4 0.41 0.13 0.50 0.00 0.04 0.06 1.13 0.36 0.13 0.05 0.05 0.06 0.65Gabon 1.5 0.48 0.22 0.96 0.12 0.00 0.03 1.81 0.24 4.11 20.94 3.41 0.03 28.72Gambia 1.6 0.72 0.15 0.21 0.09 0.20 0.05 1.41 0.43 0.07 0.21 0.39 0.05 1.15Ghana 23.3 0.58 0.10 0.61 0.17 0.21 0.07 1.74 0.70 0.28 0.17 0.06 0.07 1.28Guinea 9.6 0.65 0.33 0.51 0.04 0.10 0.08 1.72 0.65 0.91 0.76 0.52 0.08 2.93Guinea-Bissau 1.5 0.35 0.42 0.19 0.03 0.07 0.05 1.10 0.47 0.41 0.39 2.08 0.05 3.40Kenya 38.5 0.20 0.27 0.28 0.06 0.11 0.03 0.95 0.19 0.27 0.02 0.02 0.03 0.53Lesotho 2.1 0.19 0.49 0.37 0.00 0.01 0.01 1.07 0.08 0.72 0.00 0.00 0.01 0.81Liberia 3.7 0.31 0.03 0.75 0.02 0.12 0.05 1.28 0.21 0.71 1.66 0.33 0.05 2.95Libyan ArabJamahiriya6.2 0.65 0.54 0.12 0.04 1.82 0.02 3.19 0.15 0.23 0.02 0.24 0.02 0.66Madagascar 19.5 0.30 0.39 0.27 0.08 0.06 0.06 1.16 0.27 1.50 0.89 0.19 0.06 2.92Malawi 14.0 0.46 0.04 0.17 0.01 0.05 0.05 0.78 0.44 0.09 0.03 0.06 0.05 0.67Mali 14.5 0.74 0.75 0.16 0.03 0.10 0.10 1.86 0.76 0.73 0.64 0.05 0.10 2.29Mauritania 3.3 0.43 1.79 0.20 0.10 0.30 0.05 2.86 0.12 3.40 0.06 1.60 0.05 5.21Mauritius 1.3 0.60 0.54 0.12 1.88 1.41 0.00 4.55 0.17 0.00 0.01 0.38 0.00 0.56Morocco 31.3 0.60 0.21 0.06 0.05 0.37 0.03 1.32 0.30 0.18 0.09 0.10 0.03 0.70Mozambique 22.3 0.26 0.04 0.32 0.03 0.08 0.05 0.78 0.22 1.09 0.68 0.16 0.05 2.21Namibia 2.2 0.43 1.05 0.14 0.00 0.38 0.03 2.03 0.21 1.67 0.37 4.90 0.03 7.18Nigeria 150.7 0.81 0.10 0.21 0.10 0.15 0.07 1.44 0.84 0.17 0.02 0.02 0.07 1.12Rw<strong>and</strong>a 10.0 0.40 0.06 0.15 0.01 0.05 0.04 0.71 0.40 0.06 0.01 0.01 0.04 0.52Senegal 11.8 0.69 0.27 0.23 0.08 0.21 0.04 1.53 0.43 0.21 0.53 0.19 0.04 1.40Sierra Leone 5.6 0.32 0.15 0.39 0.13 0.06 0.09 1.13 0.86 0.38 0.19 0.19 0.09 1.71Somalia 8.9 0.18 0.66 0.50 0.02 0.04 0.04 1.44 0.08 0.65 0.26 0.33 0.04 1.36South Africa 49.3 0.42 0.19 0.31 0.08 1.57 0.03 2.59 0.32 0.62 0.02 0.22 0.03 1.21Sudan 41.4 0.47 0.82 0.21 0.00 0.09 0.03 1.63 0.42 0.81 0.94 0.14 0.03 2.34Swazil<strong>and</strong> 1.2 0.40 0.53 0.11 0.00 0.33 0.07 1.45 0.29 0.55 0.05 0.01 0.07 0.97Tanzania, UnitedRepublic of42.3 0.36 0.36 0.24 0.09 0.08 0.06 1.19 0.37 0.39 0.13 0.07 0.06 1.02Togo 5.8 0.41 0.11 0.31 0.05 0.13 0.03 1.03 0.44 0.14 0.04 0.02 0.03 0.67Tunisia 10.2 0.65 0.12 0.21 0.10 0.66 0.03 1.76 0.53 0.09 0.05 0.25 0.03 0.96Ug<strong>and</strong>a 31.3 0.53 0.15 0.54 0.23 0.06 0.05 1.57 0.52 0.17 0.02 0.05 0.05 0.81Zambia 12.4 0.18 0.18 0.35 0.01 0.10 0.02 0.84 0.07 1.08 1.11 0.03 0.02 2.31Zimbabwe 12.5 0.24 0.35 0.30 0.00 0.25 0.02 1.17 0.18 0.35 0.14 0.01 0.02 0.72Middle East/Central Asia383.7 0.60 0.20 0.12 0.04 1.44 0.06 2.47 0.39 0.22 0.12 0.13 0.06 0.92Afghanistan 29.8 0.24 0.20 0.06 0.00 0.01 0.02 0.54 0.16 0.20 0.02 0.00 0.02 0.40Armenia 3.1 0.58 0.39 0.08 0.01 0.61 0.06 1.73 0.31 0.27 0.07 0.02 0.06 0.72Azerbaijan 8.9 0.59 0.26 0.10 0.01 0.96 0.04 1.97 0.34 0.21 0.10 0.02 0.04 0.72Georgia 4.4 0.44 0.30 0.11 0.07 0.48 0.04 1.43 0.15 0.36 0.57 0.05 0.04 1.17Iran, IslamicRepublic of72.3 0.55 0.13 0.05 0.10 1.77 0.06 2.66 0.36 0.08 0.07 0.28 0.06 0.84Iraq 29.8 0.33 0.09 0.01 0.00 0.96 0.02 1.42 0.14 0.02 0.05 0.01 0.02 0.24Israel 7.1 0.86 0.36 0.33 0.01 2.33 0.06 3.96 0.17 0.01 0.03 0.01 0.06 0.29Jordan 5.8 0.66 0.41 0.18 0.05 0.74 0.09 2.13 0.09 0.02 0.03 0.00 0.09 0.24Kazakhstan 15.7 0.76 0.25 0.12 0.02 2.95 0.04 4.14 1.13 2.01 0.24 0.06 0.04 3.48Kuwait 2.5 0.80 0.64 0.23 0.29 7.70 0.07 9.72 0.01 0.01 0.00 0.32 0.07 0.43Kyrgyzstan 5.2 0.55 0.16 0.08 0.01 0.41 0.07 1.29 0.43 0.68 0.09 0.06 0.07 1.33Lebanon 4.2 0.66 0.48 0.28 0.05 1.33 0.05 2.85 0.22 0.05 0.06 0.01 0.05 0.39OccupiedPalestinian3.8 0.33 0.05 0.00 0.00 0.09 0.00 0.46 0.11 0.02 0.00 0.00 0.00 0.13TerritoryOman 2.6 0.74 1.04 0.16 0.37 3.27 0.11 5.69 0.09 0.07 0.00 1.92 0.11 2.20Qatar 1.4 0.91 1.12 0.17 0.46 8.91 0.11 11.68 0.03 0.00 0.00 1.91 0.11 2.05Saudi Arabia 26.2 0.80 0.36 0.26 0.06 2.44 0.07 3.99 0.18 0.13 0.07 0.21 0.07 0.65Syrian ArabRepublic19.7 0.48 0.16 0.05 0.01 0.71 0.04 1.45 0.37 0.11 0.04 0.00 0.04 0.57Tajikistan 6.7 0.42 0.17 0.02 0.00 0.21 0.08 0.90 0.29 0.17 0.01 0.01 0.08 0.56Turkey 70.9 0.92 0.08 0.28 0.03 1.17 0.07 2.55 0.74 0.13 0.32 0.05 0.07 1.31Turkmenistan 4.9 0.93 0.54 0.01 0.01 2.37 0.13 3.98 0.89 2.01 0.02 0.14 0.13 3.19United ArabEmirates8.1 0.77 1.06 0.37 0.25 5.97 0.03 8.44 0.05 0.00 0.07 0.49 0.03 0.64Uzbekistan 26.8 0.54 0.09 0.03 0.00 1.09 0.07 1.82 0.53 0.21 0.06 0.03 0.07 0.91Yemen 22.6 0.29 0.18 0.03 0.00 0.32 0.05 0.87 0.13 0.13 0.04 0.25 0.05 0.60Asia-Pacific 3,729.6 0.46 0.07 0.15 0.11 0.76 0.07 1.63 0.40 0.09 0.18 0.12 0.07 0.86Australia 21.5 1.61 1.11 1.16 0.10 2.68 0.03 6.68 2.14 6.16 2.55 3.69 0.03 14.57Bangladesh 145.5 0.33 0.01 0.08 0.02 0.15 0.07 0.66 0.28 0.00 0.00 0.06 0.07 0.42Cambodia 13.8 0.52 0.04 0.25 0.07 0.27 0.05 1.19 0.51 0.11 0.21 0.13 0.05 1.01China 1,358.8 0.52 0.13 0.14 0.10 1.15 0.09 2.13 0.38 0.11 0.22 0.07 0.09 0.87India 1,190.9 0.37 0.00 0.12 0.02 0.31 0.05 0.87 0.38 0.00 0.02 0.03 0.05 0.48Indonesia 235.0 0.44 0.04 0.16 0.20 0.23 0.07 1.13 0.47 0.06 0.32 0.41 0.07 1.32Japan 126.5 0.50 0.15 0.24 0.39 2.83 0.06 4.17 0.11 0.00 0.34 0.07 0.06 0.59Korea, DemocraticPeople’s Republic of24.1 0.33 0.01 0.14 0.02 0.75 0.06 1.31 0.27 0.00 0.23 0.07 0.06 0.62WWF Living Planet Report 2012 page 140
Country/regionPopulation(millions)Cropl<strong>and</strong>Grazing l<strong>and</strong>Forest l<strong>and</strong>FishinggroundCarbonBuilt up l<strong>and</strong>TotalEcologicalFootprintCropl<strong>and</strong>Grazing l<strong>and</strong>Forest l<strong>and</strong>FishinggroundBuilt up l<strong>and</strong>Total<strong>biocapacity</strong>Country/regionPopulation(millions)Cropl<strong>and</strong>Grazing l<strong>and</strong>Forest l<strong>and</strong>FishinggroundCarbonBuilt up l<strong>and</strong>TotalEcologicalFootprintCropl<strong>and</strong>Grazing l<strong>and</strong>Forest l<strong>and</strong>FishinggroundBuilt up l<strong>and</strong>Total<strong>biocapacity</strong>Country/regionPopulation(millions)Cropl<strong>and</strong>Grazing l<strong>and</strong>Forest l<strong>and</strong>FishinggroundCarbonBuilt up l<strong>and</strong>TotalEcologicalFootprintCropl<strong>and</strong>Grazing l<strong>and</strong>Forest l<strong>and</strong>FishinggroundBuilt up l<strong>and</strong>Total<strong>biocapacity</strong>Ecological Footprint 2008(global hectares per person)Biocapacity 2008(global hectares per person)Ecological Footprint 2008(global hectares per person)Biocapacity 2008(global hectares per person)Ecological Footprint 2008(global hectares per person)Biocapacity 2008(global hectares per person)Korea, Republic of 47.7 0.73 0.18 0.23 0.47 2.93 0.07 4.62 0.18 0.00 0.09 0.38 0.07 0.72Lao People’sDemocratic6.0 0.56 0.14 0.39 0.01 0.08 0.13 1.30 0.57 0.18 0.73 0.04 0.13 1.65RepublicMalaysia 27.5 0.61 0.26 0.47 0.46 2.02 0.08 3.90 0.85 0.01 0.70 0.86 0.08 2.50Mongolia 2.7 0.28 3.97 0.13 0.00 1.13 0.01 5.53 0.08 8.93 6.16 0.15 0.01 15.33Myanmar 47.3 1.09 0.01 0.34 0.28 0.08 0.14 1.94 1.11 0.01 0.64 0.32 0.14 2.22Nepal 28.9 0.36 0.05 0.20 0.00 0.07 0.09 0.76 0.34 0.04 0.06 0.00 0.09 0.53New Zeal<strong>and</strong> 4.3 0.72 0.00 1.21 0.75 1.56 0.06 4.31 0.22 2.91 4.91 2.09 0.06 10.19Pakistan 167.4 0.35 0.01 0.09 0.01 0.24 0.05 0.75 0.30 0.00 0.01 0.04 0.05 0.40Papua New Guinea 6.5 0.31 0.18 0.38 0.81 0.84 0.16 2.68 0.43 0.04 2.45 0.59 0.16 3.67Philippines 90.2 0.45 0.07 0.09 0.32 0.00 0.06 0.98 0.37 0.02 0.10 0.07 0.06 0.62Singapore 4.8 0.52 0.92 0.31 0.15 4.20 0.00 6.10 0.00 0.00 0.00 0.02 0.00 0.02Sri Lanka 20.5 0.36 0.07 0.15 0.28 0.29 0.06 1.21 0.30 0.02 0.04 0.05 0.06 0.46Thail<strong>and</strong> 68.3 0.57 0.05 0.16 0.67 0.89 0.07 2.41 0.73 0.01 0.22 0.14 0.07 1.17Timor-Leste 1.1 0.24 0.07 0.05 0.02 0.05 0.04 0.47 0.20 0.06 0.56 0.00 0.04 0.86Vietnam 86.0 0.52 0.02 0.18 0.12 0.43 0.12 1.39 0.59 0.01 0.16 0.22 0.12 1.09Latin America 576.8 0.64 0.67 0.39 0.12 0.80 0.08 2.70 0.80 0.80 3.60 0.31 0.08 5.60Argentina 39.7 0.80 0.62 0.28 0.13 0.77 0.12 2.71 2.88 1.72 0.71 1.69 0.12 7.12Bolivia 9.6 0.44 1.58 0.17 0.01 0.35 0.06 2.61 0.59 2.41 15.26 0.06 0.06 18.39Brazil 191.5 0.80 0.95 0.55 0.05 0.48 0.10 2.93 1.09 1.03 7.25 0.16 0.10 9.63Chile 16.8 0.55 0.33 0.91 0.62 0.73 0.09 3.24 0.32 0.47 2.12 0.73 0.09 3.74Colombia 45.0 0.38 0.72 0.14 0.03 0.43 0.11 1.80 0.29 1.22 2.23 0.04 0.11 3.89Costa Rica 4.5 0.37 0.24 0.81 0.05 0.93 0.11 2.52 0.43 0.33 0.62 0.10 0.11 1.60Cuba 11.3 0.71 0.22 0.11 0.06 0.79 0.02 1.90 0.26 0.08 0.21 0.14 0.02 0.71DominicanRepublic9.7 0.39 0.14 0.12 0.08 0.65 0.04 1.42 0.20 0.12 0.17 0.01 0.04 0.54Ecuador 14.1 0.36 0.34 0.23 0.75 0.62 0.07 2.37 0.39 0.33 1.21 0.17 0.07 2.18El Salvador 6.1 0.53 0.31 0.41 0.14 0.57 0.04 1.99 0.31 0.11 0.05 0.11 0.04 0.62Guatemala 13.7 0.42 0.23 0.56 0.04 0.47 0.06 1.78 0.39 0.19 0.38 0.04 0.06 1.07Haiti 9.7 0.29 0.06 0.10 0.02 0.09 0.03 0.60 0.22 0.03 0.01 0.01 0.03 0.31Honduras 7.3 0.29 0.33 0.55 0.03 0.48 0.06 1.73 0.37 0.29 1.03 0.23 0.06 1.97Jamaica 2.7 0.41 0.30 0.22 0.12 0.63 0.04 1.72 0.14 0.00 0.10 0.05 0.04 0.33Mexico 110.6 0.74 0.40 0.32 0.09 1.69 0.06 3.30 0.49 0.25 0.49 0.14 0.06 1.42Nicaragua 5.6 0.36 0.33 0.43 0.07 0.33 0.04 1.56 0.41 0.58 0.80 0.50 0.04 2.33Panama 3.4 0.45 0.54 0.21 0.78 0.96 0.04 2.97 0.21 0.49 1.33 0.61 0.04 2.67Paraguay 6.2 0.50 1.06 0.84 0.01 0.48 0.11 2.99 2.05 2.35 6.36 0.06 0.11 10.92Peru 28.5 0.50 0.50 0.20 0.45 0.30 0.08 2.03 0.35 0.50 2.65 0.24 0.08 3.82Uruguay 3.3 0.84 2.98 0.37 0.11 0.67 0.11 5.08 1.31 5.25 1.12 2.24 0.11 10.03Venezuela,BolivarianRepublic of28.1 0.48 0.88 0.17 0.12 1.32 0.05 3.02 0.20 0.61 1.84 0.30 0.05 3.00North America 338.4 1.13 0.22 0.85 0.10 4.75 0.07 7.12 1.66 0.26 2.22 0.75 0.07 4.95Canada 33.3 1.49 0.42 0.74 0.10 3.63 0.05 6.43 2.81 0.23 8.27 3.55 0.05 14.92United Statesof America305.0 1.09 0.19 0.86 0.09 4.87 0.07 7.19 1.53 0.26 1.56 0.44 0.07 3.86EU 497.1 1.13 0.34 0.53 0.14 2.42 0.16 4.72 0.91 0.13 0.77 0.27 0.16 2.24Austria 8.3 1.08 0.22 0.62 0.03 3.05 0.28 5.29 0.87 0.15 2.04 0.00 0.28 3.34Belgium 10.6 1.82 0.95 0.47 0.17 3.26 0.45 7.11 0.46 0.11 0.28 0.05 0.45 1.33Bulgaria 7.6 0.95 0.21 0.51 0.03 1.68 0.17 3.56 1.19 0.18 1.01 0.09 0.17 2.65Czech Republic 10.4 1.17 0.19 0.83 0.02 2.89 0.17 5.27 1.17 0.12 1.21 0.00 0.17 2.68Denmark 5.5 2.77 0.70 1.21 0.78 2.54 0.26 8.25 2.40 0.03 0.27 1.85 0.26 4.81Estonia 1.3 0.83 0.07 1.60 0.15 1.93 0.15 4.73 0.79 0.36 3.32 4.11 0.15 8.73Finl<strong>and</strong> 5.3 1.11 0.19 0.40 0.27 4.15 0.10 6.21 0.95 0.00 8.64 2.50 0.10 12.19France 62.1 1.25 0.39 0.60 0.18 2.24 0.25 4.91 1.47 0.24 0.87 0.16 0.25 2.99Germany 82.5 1.18 0.26 0.43 0.01 2.49 0.20 4.57 0.95 0.09 0.64 0.08 0.20 1.95Greece 11.3 1.26 0.53 0.38 0.13 2.53 0.11 4.92 1.03 0.09 0.14 0.22 0.11 1.59Hungary 10.0 1.29 0.03 0.44 0.01 1.63 0.18 3.59 1.82 0.10 0.58 0.01 0.18 2.68Irel<strong>and</strong> 4.4 1.26 0.47 0.53 0.04 3.75 0.16 6.22 0.59 0.79 0.24 1.64 0.16 3.41Italy 59.9 1.03 0.40 0.46 0.14 2.39 0.10 4.52 0.62 0.06 0.30 0.06 0.10 1.15Latvia 2.3 0.79 0.10 1.25 0.26 1.48 0.07 3.95 0.98 0.66 3.03 1.88 0.07 6.63Lithuania 3.4 1.05 0.13 1.02 0.39 1.59 0.20 4.38 1.43 0.75 1.67 0.27 0.20 4.32Netherl<strong>and</strong>s 16.5 1.30 1.09 0.54 0.10 3.14 0.16 6.34 0.30 0.06 0.08 0.44 0.16 1.03Pol<strong>and</strong> 38.2 0.98 0.04 0.75 0.07 2.01 0.08 3.94 0.99 0.12 0.71 0.10 0.08 2.00Portugal 10.6 0.96 0.00 0.14 0.95 2.01 0.05 4.12 0.29 0.24 0.64 0.07 0.05 1.29Romania 21.6 0.92 0.13 0.35 0.04 1.23 0.16 2.84 0.93 0.16 1.00 0.09 0.16 2.33Slovakia 5.4 1.07 0.25 0.86 0.02 2.28 0.18 4.66 1.00 0.08 1.60 0.00 0.18 2.86Slovenia 2.0 0.94 0.25 0.61 0.04 3.22 0.15 5.21 0.37 0.23 1.84 0.00 0.15 2.59Spain 45.1 1.26 0.31 0.35 0.38 2.39 0.06 4.74 0.98 0.11 0.25 0.06 0.06 1.46Sweden 9.2 0.97 0.47 0.99 0.17 3.00 0.10 5.71 0.64 0.04 6.36 2.38 0.10 9.51United Kingdom 61.5 0.88 0.45 0.53 0.06 2.65 0.15 4.71 0.49 0.10 0.11 0.50 0.15 1.34Other Europe 239.3 1.05 0.16 0.40 0.17 2.23 0.05 4.05 1.01 0.27 2.82 0.73 0.05 4.88Albania 3.2 0.71 0.21 0.09 0.02 0.71 0.06 1.81 0.41 0.13 0.20 0.08 0.06 0.88Belarus 9.7 1.41 0.02 0.42 0.07 1.98 0.08 3.99 1.38 0.31 1.61 0.02 0.08 3.40Bosnia <strong>and</strong>Herzegovina3.8 0.78 0.22 0.48 0.04 1.16 0.05 2.74 0.41 0.26 0.91 0.00 0.05 1.64Croatia 4.4 1.02 0.13 0.66 0.07 1.89 0.43 4.19 0.87 0.17 1.14 0.32 0.43 2.92Macedonia TFYR 2.1 0.79 0.21 0.33 0.07 3.87 0.09 5.36 0.53 0.22 0.70 0.01 0.09 1.55Moldova 3.6 1.01 0.09 0.11 0.06 0.77 0.06 2.10 1.11 0.07 0.09 0.01 0.06 1.33Norway 4.8 1.05 0.13 0.66 1.27 1.58 0.08 4.77 0.36 0.02 3.18 1.75 0.08 5.40Russian Federation 143.2 1.05 0.20 0.47 0.09 2.55 0.04 4.40 0.94 0.34 4.22 1.08 0.04 6.62Serbia 9.8 0.87 0.06 0.34 0.05 1.25 0.00 2.57 0.95 0.07 0.39 0.00 0.00 1.41Switzerl<strong>and</strong> 7.6 0.76 0.28 0.55 0.06 3.26 0.10 5.01 0.21 0.15 0.73 0.01 0.10 1.20Ukraine 46.0 1.14 0.03 0.17 0.11 1.68 0.07 3.19 1.49 0.13 0.41 0.13 0.07 2.23WWF Living Planet Report 2012 page 143 WWF Living Planet Report 2012 page 144Annex: Technical notes <strong>and</strong> data tables page 145
Annex 3: Glossary of terms <strong>and</strong>abbreviations used in the reportBiocapacityBiocapacity deficitBiocapacity perperson<strong>Biodiversity</strong>BiomeCarbon budgetCarbon FootprintThe capacity of ecosystems to produce useful biological materials <strong>and</strong> toabsorb waste materials generated by humans, using current managementschemes <strong>and</strong> extraction technologies. Biocapacity is measured in globalhectares (Global Footprint Network, 2012).The difference between the <strong>biocapacity</strong> <strong>and</strong> Ecological Footprint ofa region or country. A <strong>biocapacity</strong> deficit occurs when the Footprintof a population exceeds the <strong>biocapacity</strong> of the area available to thatpopulation. Conversely, a <strong>biocapacity</strong> remainder exists when the<strong>biocapacity</strong> of a region exceeds its population’s Footprint. If there isa regional or national <strong>biocapacity</strong> deficit, it means that the region isimporting <strong>biocapacity</strong> through trade or liquidating regional ecologicalassets. In contrast, the global <strong>biocapacity</strong> deficit cannot be compensatedthrough trade, <strong>and</strong> is therefore equal to overshoot.This is calculated by dividing the number of productive global hectaresavailable by the number of people living on the planet in that year.Shorth<strong>and</strong> for biological diversity. Variability among living organismsfrom all sources including terrestrial, marine <strong>and</strong> other aquaticecosystems, <strong>and</strong> the ecological complexes of which they are part; thisincludes diversity within species, between species <strong>and</strong> of ecosystems(CBD <strong>and</strong> UNEP).A major portion of the living environment of a particular regioncharacterized by its distinctive vegetation <strong>and</strong> maintained by localclimatic conditions.The average global temperature must not rise more than 2 degreesCelsius over pre-industrial levels if we are to avoid dangerous climatechange (many Parties to the Convention have accepted this objective, asfirst asserted in 1995. A review of the objective to look at whether a 1.5ºClimit is in fact needed is scheduled for 2013-15). The 2ºC objective can befurther expressed as a global carbon budget. To have a reasonable chance(<strong>better</strong> than 50 per cent) of forestalling such a rise, cumulative globalcarbon emissions must be limited to 870 gigatons of CO2 equivalentbetween 2009 <strong>and</strong> 2100 (Höhne <strong>and</strong> Moltmann, 2009).The dem<strong>and</strong> on <strong>biocapacity</strong> required to sequester (throughphotosynthesis) the carbon dioxide (CO2) emissions from fossil fuelcombustion. Although fossil fuels are extracted from the Earth’s crust<strong>and</strong> are not regenerated in human time scales, their use dem<strong>and</strong>secological services if the resultant CO2 is not to accumulate in theatmosphere. The Ecological Footprint therefore includes the <strong>biocapacity</strong>,typically that of unharvested forests, needed to absorb that fraction ofThe CLUM model– ConsumptionL<strong>and</strong> Use MatrixCountry incomecategoriesEcologicalFootprintEcologicalFootprint: Futurescenarios(continues over)fossil CO2 that is not absorbed by the ocean (Global Footprint Network,2012). There are several calculators that use the phrase “CarbonFootprint”, but many just calculate tonnes of carbon, or tonnes of carbonper Euro, rather than dem<strong>and</strong> on bioproductive area.The CLUM presented in Chapter 1 represents the Ecological Footprintof consumption <strong>and</strong> contains three main components. The firstcomponent is short-lived consumption paid by individuals (also knownas “household” or “HH”). This component contains food, housingmaintenance <strong>and</strong> operations, personal transportation, goods <strong>and</strong>services. The second component is consumption paid for by government(called “government”) <strong>and</strong> it contains short-lived consumptionexpenditure such as public services, public schools, policing <strong>and</strong>governance, <strong>and</strong> defence. The third component is consumption for longlivedassets (called “gross fixed capital formation”), which may be paid byhouseholds (e.g., new housing), firms (e.g., new factories <strong>and</strong> machinery)or governments (e.g., transport infrastructure). These three componentssummed are equivalent to the total Ecological Footprint per nation.Countries were assigned to high, middle or low income categories basedon World Bank income thresholds. The World Bank classifies economiesaccording to 2007 Gross National Income (GNI) per person per year.This is calculated by dividing the gross national income of each country(converted to US dollars using the World Bank Atlas method), by themid-year population (for more information see The World Bank, 2012).The categories are: Low income: ≤US$935 GNI per person.Middle income: US$936-11,455 GNI per person (combines WorldBank categories of lower middle <strong>and</strong> upper middle income).High income: ≥US$11,456 GNI per person.A measure of how much biologically productive l<strong>and</strong> <strong>and</strong> water anindividual, population or activity requires to produce all the resourcesit consumes, <strong>and</strong> to absorb the waste it generates, using prevailingtechnology <strong>and</strong> resource management practices. The EcologicalFootprint is usually measured in global hectares. Because trade is global,an individual or country’s Footprint includes l<strong>and</strong> or sea from all overthe world. Ecological Footprint is often referred to in short form asFootprint (Global Footprint Network, 2012).This “business as usual” scenario has the following assumptions: (a)Global population of 9.3 billion by 2050 (UN, 2010 Medium variant);(b) Total energy dem<strong>and</strong> doubles from 2005 levels (IEA Business asUsual from IEA, 2008); (c) Increasing dependency on coal for powergeneration from 45% in 2005 to 60% by 2050 (IEA Business as Usual);(d) 12% increase in caloric intake per person, with an increase in theamount from meat, milk, <strong>and</strong> dairy; decrease in amount from cereals <strong>and</strong>fish (FAO Agriculture Towards 2030/2050 FAO, 2006); (e) Constantcrop <strong>and</strong> forest yields based on 2005 figures; (f) Increase in crops fedto animals (FAO Agriculture Towards 2030/2050, FAO, 2006); (g)Increases in atmospheric CO2 <strong>and</strong> methane concentrations associatedWWF Living Planet Report 2012 page 146 Annex: Technical notes <strong>and</strong> data tables page 147
EcologicalFootprint: Futurescenarios(continued)EcosystemEcosystemservicesProvisioningservicesRegulatingservicesSupportingserviceswith the scenarios in food <strong>and</strong> energy were combined with the estimatesof the IPCC (IPCC, 2007b) <strong>and</strong> a l<strong>and</strong> suitability model (Global Agro-Ecological Zones – GAEZ) to predict changes in the area <strong>and</strong> suitabilityof l<strong>and</strong> for growing crops (Fischer et al., 2008).A dynamic complex of plant, animal <strong>and</strong> micro-organism communities<strong>and</strong> their non-living environment interacting as a functional unit.The Millennium Ecosystem Assessment distinguished supporting,provisioning, regulating <strong>and</strong> cultural services that contribute to humanwell-being (Millennium Ecosystem Assessment, 2005a; b). Theseservices are defined in the four panels below:Goods obtained directly from ecosystems (e.g., food, medicine, timber,fibre <strong>and</strong> bioenergy).Benefits obtained from the regulation of natural processes (e.g., waterfiltration, waste decomposition, climate regulation, crop pollination <strong>and</strong>regulation of some human diseases).Regulation of basic ecological functions <strong>and</strong> processes that are necessaryfor the provision of all other ecosystem services (e.g. nutrient cycling,photosynthesis <strong>and</strong> soil formation).HDIsimply not available <strong>and</strong> many opportunities remain inaccessible. Butthe realm of human development goes further: Essential areas of choice,highly valued by people, range from political, economic <strong>and</strong> socialopportunities for being creative <strong>and</strong> productive; to enjoying self-respect,empowerment <strong>and</strong> a sense of belonging to a community. The concept ofhuman development is a holistic one, putting people at the centre of allaspects of the development process. (Source: Human DevelopmentReport webpage).The HDI – Human Development Index – is a summary composite indexthat measures a country’s average achievements in three basic aspects ofhuman development: health, knowledge <strong>and</strong> a decent st<strong>and</strong>ard of living.The HDI contains three components:1. Health: Life expectancy at birth (number of years a newborn infantwould live if prevailing patterns of mortality at the time of birthwere to stay the same throughout the child’s life).2. Knowledge: A combination of the adult literacy rate <strong>and</strong>the combined primary, secondary <strong>and</strong> tertiary grossenrolment ratio.3. St<strong>and</strong>ard of living: GDP per capita (PPP US$).(Source: Human Development Report webpage).Cultural servicesGlobal hectare(gha)Hum<strong>and</strong>evelopmentPsychological <strong>and</strong> emotional benefits gained from human relationswith ecosystems (e.g., enriching recreational, aesthetic <strong>and</strong> spiritualexperiences).A productivity weighted area used to report both the <strong>biocapacity</strong> of theEarth, <strong>and</strong> the dem<strong>and</strong> on <strong>biocapacity</strong> (the Ecological Footprint). Theglobal hectare is normalized to the area-weighted average productivity ofbiologically productive l<strong>and</strong> <strong>and</strong> water in a given year. Because differentl<strong>and</strong> types have different productivity, a global hectare of, for example,cropl<strong>and</strong>, would occupy a smaller physical area than the much lessbiologically productive pasture l<strong>and</strong>, as more pasture would be needed toprovide the same <strong>biocapacity</strong> as one hectare of cropl<strong>and</strong>. Because worldbioproductivity varies slightly from year to year, the value of a gha maychange slightly from year to year (Global Footprint Network, 2012).Human development is a process of “enlarging” people’s <strong>choices</strong>.Enlarging people’s <strong>choices</strong> is achieved by exp<strong>and</strong>ing human capabilities<strong>and</strong> functioning. At all levels of development the three essentialcapabilities for human development are for people to lead long <strong>and</strong>healthy lives; to be knowledgeable; <strong>and</strong> to have a decent st<strong>and</strong>ard ofliving. If these basic capabilities are not achieved, many <strong>choices</strong> aresimply not available <strong>and</strong> many opportunities remain inaccessible. ButHuman development is a process of “enlarging” people’s <strong>choices</strong>.Enlarging people’s <strong>choices</strong> is achieved by exp<strong>and</strong>ing human capabilities<strong>and</strong> functioning. At all levels of development the three essentialcapabilities for human development are for people to lead long <strong>and</strong>healthy lives; to be knowledgeable; <strong>and</strong> to have a decent st<strong>and</strong>ard ofliving. If these basic capabilities are not achieved, many <strong>choices</strong> areInequalityadjustedHumanDevelopmentIndex (IHDI)Living PlanetIndex (LPI)The IHDI is a measure of the level of human development of people ina society that accounts for inequality. Under perfect equality, the IHDIis equal to the HDI; but it falls below the HDI when inequality rises. Inthis sense, the IHDI is the actual level of human development while theHDI can be viewed as an index of the potential human developmentthat could be achieved if there is no inequality. The IHDI accounts forinequality in HDI dimensions by “discounting” each dimension’s averagevalue according to its level of inequality.The average loss in the HDI due to inequality is about 23 percent – that is, adjusted for inequality, the global HDI of 0.682 in 2011would fall to 0.525. Countries with less human development tend to havegreater inequality in more dimensions – <strong>and</strong> thus larger losses in hum<strong>and</strong>evelopment.This new version of the HDI was developed for the 2011 HumanDevelopment Report (UNDP, 2011) <strong>and</strong> at the time of publication, theadjustment has been applied to 134 countries. For this definition <strong>and</strong>more information, see the IHDI homepage.The LPI reflects changes in the health of the planet’s ecosystems bytracking trends in over 9,000 populations of vertebrate species. Muchas a stock market index tracks the value of a set of shares over time asthe sum of its daily change, the LPI first calculates the annual rate ofchange for each species’ population in the dataset (example populationsare shown in Figures 4-6). The index then calculates the average changeacross all populations for each year from 1970, when data collectionbegan, to 2008, the latest date for which data is available (Collen et al.,2009 <strong>and</strong> see Annex 1 for more details).WWF Living Planet Report 2012 page 148 Annex: Technical notes <strong>and</strong> data tables page 149
NationalAccounts ReviewCommitteeNational FootprintAccountsNatural capitalOvershootSustainabledevelopmentVirtual waterWater FootprintZNDDGlobal Footprint Network’s scientific advisors who develop <strong>and</strong> endorserecommendations for methodological changes to the EcologicalFootprint Accounts (Global Footprint Network, 2012).The central data set that calculates the footprints <strong>and</strong> biocapacities ofthe world, <strong>and</strong> roughly 150 nations from 1961 to the present (generallywith a three-year lag due to data availability). The ongoing development,maintenance <strong>and</strong> upgrades of the National Footprint Accounts arecoordinated by Global Footprint Network <strong>and</strong> its 70+ partners (GlobalFootprint Network, 2012).Natural capital can be defined as all of the raw materials <strong>and</strong> naturalcycles on Earth. Footprint analysis considers one key component:life-supporting natural capital, or ecological capital for short. Thiscapital is defined as the stock of living ecological assets that yield goods<strong>and</strong> services on a continuous basis. Main functions include resourceproduction (such as fish, timber or cereals), waste assimilation (suchas CO2 absorption or sewage decomposition) <strong>and</strong> life support services(such as UV protection, biodiversity, water cleansing or climate stability).Global overshoot occurs when humanity’s dem<strong>and</strong> on the natural worldexceeds the biosphere’s supply, or regenerative capacity. Such overshootleads to a depletion of Earth’s life-supporting natural capital <strong>and</strong> abuild-up of waste. At the global level, <strong>biocapacity</strong> deficit <strong>and</strong> overshootare the same, since there is no net-import of resources to the planet.Local overshoot occurs when a local ecosystem is exploited more rapidlythan it can renew itself (Global Footprint Network, 2012).Development that meets the needs of the present without compromisingthe ability of future generations to meet their own needs.The “virtual water content” of a product is the same as its “WaterFootprint”. The Water Footprint of a product (a commodity, goodor service) is the volume of freshwater used to produce the product,measured at the place where the product was actually produced. It refersto the sum of the water used in the various steps of the production chain.The Water Footprint of an individual, community or business is definedas the total volume of freshwater that is used to produce the goods <strong>and</strong>services consumed by the individual or community, or produced by thebusiness. The Water Footprint of a nation is defined as the total amountof water that is used to produce the goods <strong>and</strong> services consumed by theinhabitants of the nation.WWF defines ZNDD as: no net forest loss through deforestation <strong>and</strong>no net decline in forest quality through degradation; <strong>and</strong> stresses that:(a) most natural forest should be retained – the annual rate of loss ofnatural or semi-natural forests should be reduced to near zero; <strong>and</strong> (b)any gross loss or degradation of pristine natural forests would need tobe offset by an equivalent area of socially <strong>and</strong> environmentally soundforest restoration.List of abbreviationsASC Aquaculture Stewardship CouncilBRIICS Brazil, Russia, India, Indonesia, China, South AfricaCBD Convention on Biological DiversityCLUM Country L<strong>and</strong> Use MatrixCONAGUA Mexican National Water Commission (Comisión Nacional del Agua)EF Ecological FootprintEFR Ecological Footprint ReportESA European Space AgencyESRI Environmental Systems Research InstituteFAO United Nations Food <strong>and</strong> Agricultural OrganizationFSC Forest Stewardship CouncilGAM General Additive ModelingGAEZ Global Agro Ecological ZonesGDP Gross Domestic ProductGha Global HectaresGHG Greenhouse GasGNI Gross National IncomeHDI Human Development IndexICCAT International Commission for the Conservation of Atlantic TunasIEA International Energy AgencyIFC International Finance CorporationIHDI Inequality-adjusted Human Development IndexIIASA International Institute for Applied Systems AnalysisIPCC International Panel on Climate ChangeIUCN International Union for the Conservation of NatureMEA Millennium Ecosystem AssessmentMSC Marine Stewardship CouncilLPI Living Planet IndexLPR Living Planet ReportOECD Organization for Economic Cooperation <strong>and</strong> DevelopmentREDD Reducing Emissions from Deforestation <strong>and</strong> Forest DegradationTEEB The Economics of Ecosystems <strong>and</strong> <strong>Biodiversity</strong>TOE Tons of Oil EquivalentUNDP United Nations Development ProgrammeUNFCCC United Nations Convention on Climate ChangeUNFPA United Nations Population FundWBCSD World Business Council for Sustainable DevelopmentWF Water FootprintWHO World Health OrganizationWMO World Meteorological OrganizationWWF World Wide Fund for NatureZNDD Zero Net Deforestation <strong>and</strong> Forest DegradationZSL Zoological Society LondonWWF Living Planet Report 2012 page 150 Annex: Technical notes <strong>and</strong> data tables page 151
A satellite image of the Canary Isl<strong>and</strong>s with unique cloud formations, created by “Von Karmanvortices”, off the coast of Africa (right) in the Atlantic Ocean. These vortices, named after aeronauticalengineer Theodore von Karman, form as air flows around an object in its path, causing it to separate<strong>and</strong> create eddies in its wake. The clockwise <strong>and</strong> counter-clockwise spirals in this image were createdas wind blowing from the north over the Atlantic was disturbed by the archipelago. The isl<strong>and</strong>s are(left to right): El Hierro, La Palma, La Gomera, Tenerife, Gran Canaria, Fuerteventura <strong>and</strong> Lanzarote.© ESAReferencesAbramovitz, J.N. 1996. Worldwatch paper #128: Imperiled waters, impoverished future:the decline of freshwater ecosystems. Worldwatch Institute, Washington, DC.Ahrends, A., Burgess, N.D., Milledge, S.A.H., Bulling, M.T., Fisher, B., Smart, J.C.R.,Clarke, G.P., Mhoro, B.E. <strong>and</strong> Lewis, S.L. 2010. Predictable waves of sequentialforest degradation <strong>and</strong> biodiversity loss spreading from an African city.Proceedings of the National Academy of Sciences of the United States of America.107 (33): 14556-14561.Angliss, R.P. <strong>and</strong> Outlaw, R.B. 2006. Bowhead whale (Balaena mysticetus): WesternArctic Stock. NOAA’s National Marine Fisheries Service, Alaska, National MarineFisheries Service.Anseeuw, W., Alden Wily, L., Cotula, L. <strong>and</strong> Taylor, M. 2012. L<strong>and</strong> Rights <strong>and</strong> the Rushfor L<strong>and</strong>: Findings of the Global Commercial Pressures on L<strong>and</strong> Research Project.International L<strong>and</strong> Coalition (ILC), Rome, Italy.Aquamaps 2010. Aquamaps (08/2010). http://www.aquamaps.org/, downloaded on:5th November 2011.Bhagabati, N., Barano, T., Conte, M.N., Ennaanay, D., Hadian, O., McKenzie, E.,Olwero, N., Rosenthal, A., Suparmoko, A., Shapiro, A., Tallis, H. <strong>and</strong> Wolny, S.2012. A Green Vision for Sumatra: Using ecosystem services information to makerecommendations for sustainable l<strong>and</strong> use planning at the province <strong>and</strong> districtlevel. WWF-US <strong>and</strong> the Natural Capital Project, Washington DC, USA.BirdLife International 2008. State of the World’s Birds 2008: Indicators for ourchanging world. BirdLife International, Cambridge, UK.Bosch, J. <strong>and</strong> Martinez-Solano, I. 2006. Chytrid fungus infection related to unusualmortalities of Salam<strong>and</strong>ra salam<strong>and</strong>ra <strong>and</strong> Bufo bufo in the Peñalara Natural Park,Spain. Oryx. (40): 84-89.Braulik, G.T. 2006. Status assessment of the Indus River dolphin, Platanista gangeticaminor, March-April 2001. Biological Conservation. 129: 579-590.Butchart, S.H., Walpole, M., Collen, B., van Strien, A., Scharlemann, J.P., Almond,R.E., Baillie, J.E., Bomhard, B., Brown, C., Bruno, J., Carpenter, K.E., Carr, G.M.,Chanson, J., Chenery, A.M., Csirke, J., Davidson, N.C., Dentener, F., Foster, M.,Galli, A., Galloway, J.N., Genovesi, P., Gregory, R.D., Hockings, M., Kapos, V.,Lamarque, J.F., Leverington, F., Loh, J., McGeoch, M.A., McRae, L., Minasyan, A.,Hern<strong>and</strong>ez Morcillo, M., Oldfield, T.E., Pauly, D., Quader, S., Revenga, C., Sauer,J.R., Skolnik, B., Spear, D., Stanwell-Smith, D., Stuart, S.N., Symes, A., Tierney,M., Tyrrell, T.D., Vie, J.C. <strong>and</strong> Watson, R. 2010. Global biodiversity: indicators ofrecent declines. Science. 328 (5982): 1164-8.CDIAC 2011. Global CO2 Emissions from Fossil-Fuel Burning, Cement Manufacture,<strong>and</strong> Gas Flaring: 1751-2008. Carbon Dioxide Information Analysis Center, OakRidge National Laboratory, Tennessee, USA. http://cdiac.ornl.gov/ftp/ndp030/global.1751_2008.ems, downloaded on: June 10, 2011.Chapagain A.K. <strong>and</strong> Tickner, D. 2011. The utility <strong>and</strong> limits of water footprint in watermanagement. WWF-UK.,Chave, J., Olivier, J., Bongers, F., Châtelet, P., Forget, P.M., van der Meer, P., Norden, N.,Riéra, B. <strong>and</strong> Charles-Dominique, P. 2008. Aboveground biomass <strong>and</strong> productivityin a rain forest of eastern South America. Journal of Tropical Ecology. 24: 355-366.Chomitz, K.M., Buys, P., De Luca, G., Thomas, T.S. <strong>and</strong> Wertz-Kanounnikoff, S. 2007.At loggerheads? Agricultural expansion, poverty reduction <strong>and</strong> environment in thetropical forests. World Bank, Washington DC, USA.Collen, B., Loh, J., Whitmee, S., Mcrae, L., Amin, R. <strong>and</strong> Baillie, J.E.M. 2009. MonitoringChange in Vertebrate Abundance: the Living Planet Index. Conservation Biology.23 (2): 317-327.CONAGUA 2011. Identificación de reservas potenciales de agua para el medio ambienteen México. Comisión Nacional del Agua, Coyoacán, México.Craigie, I.D., Baillie, J.E.M., Balmford, A., Carbone, C., Collen, B., Green, R.E. <strong>and</strong>Hutton, J.M. 2010. Large mammal population declines in Africa’s protected areas.Biological Conservation. 143 (9): 2221-2228.Annex: Technical notes <strong>and</strong> data tables page 153
Davidson, E.A., de Araujo, A.C., Artaxo, P., Balch, J.K., Brown, I.F., MM, C.B., Coe, M.T.,DeFries, R.S., Keller, M., Longo, M., Munger, J.W., Schroeder, W., Soares-Filho,B.S., Souza, C.M., Jr. <strong>and</strong> Wofsy, S.C. 2012. The Amazon basin in transition.Nature. 481 (7381): 321-8.Defra 2010. Wild bird populations in the UK, 1970 to 2010. Defra National StatisticsRelease http://www.defra.gov.uk/statistics/files/Wild-bird-populations-in-the-UK-1970-2010-National-Statistics-Release.pdf, downloaded on: 30th November2010.DeFries, R.S., Rudel, T., Uriarte, M. <strong>and</strong> Hansen, M. 2010. Deforestation driven byurban population growth <strong>and</strong> agricultural trade in the twenty-first century. NatureGeoscience. 3: 178–181.Dodman, D. 2009. Urban Density <strong>and</strong> Climate Change. in: (ed.), Analytical Review of theInteraction between Urban Growth Trends <strong>and</strong> Environmental Changes (Reviseddraft: April 2, 2009), United Nations Population Fund (UNFPA), New York, USA.Ewing, B., Goldfinger, S., Oursler, A., Reed, A., Moore, D. <strong>and</strong> Wackernagel, M. 2009.Ecological Footprint Atlas. Global Footprint Network, San Francisco, California,USA.Ewing B., Goldfinger, S., Oursler, A., Reed, A., Moore, D. <strong>and</strong> Wackernagel, M. 2009.Ecological Footprint Atlas. Global Footprint Network, San Francisco, California,USA.FAO 2005. State of the World’s Forests. FAO, Rome, Italy.FAO 2006. World agriculture: towards 2030/2050 – Interim report. FAO, Rome, Italy.FAO 2009. The Resource Outlook to 2050: By how much do l<strong>and</strong>, water <strong>and</strong> crop yieldsneed to increase by 2050? FAO Expert Meeting: “How to Feed the World in 2050”,FAO, Rome, Italy.FAO 2010a. Global Forest Resources Assessment, 2010: Key findings. FAO, Rome, Italy.FAO 2010b. The State of World Fisheries <strong>and</strong> Aquaculture 2010 (SOFIA) FAO, Rome,Italy.Fischer, G., Nachtergaele, F., Prieler, S., van Velthuizen, H.T., Verelst, L. <strong>and</strong> Wiberg,D. 2008. Global Agro-ecological Zones Assessment for Agriculture (GAEZ 2008).IIASA, Laxenburg, Austria <strong>and</strong> FAO, Rome, Italy.Galli, A., Kitzes, J., Wermer, P., Wackernagel, M., Niccolucci, V. <strong>and</strong> Tiezzi, E. 2007.An exploration of the mathematics behind the Ecological Footprint. InternationalJournal of Ecodynamics. 2 (4): 250-257.Global Footprint Network 2008. India’s Ecological Footprint – a Business Perspective.Global Footprint Network <strong>and</strong> Confederation of Indian Industry, Hyderabad, India.Global Footprint Network 2010. Ecological Wealth of Nations Global Footprint Network,San Francisco, California, USA.Global Footprint Network 2011. The National Footprint Accounts. Global FootprintNetwork, San Francisco, California, USA, downloaded on: 20th February 2012.Global Footprint Network 2012. Glossary. Global Footprint Network, Oakl<strong>and</strong>,USA. http://www.footprintnetwork.org/en/index.php/GFN/page/glossary/,downloaded on: 12th December 2011.Global Tiger Initiative 2011. Global Tiger Recovery Program 2010-2022. Global TigerInitiative Secretariat, The World Bank, Washington DC, USA.GTZ 2010. A Big Foot on a Small Planet? Accounting with the Ecological Footprint.Succeeding in a world with growing resource constraints. In: Sustainability hasmany faces, N° 10. Deutsche Gesellschaft für Technische Zusammenarbeit (GTZ),Eschborn, Germany.Hansen, M.C., Stehman, S.V., Potapov, P.V., Lovel<strong>and</strong>, T.R., Townshend, J.R.G.,DeFries, R.S., Pittman, K.W., Arunarwati, B., Stolle, F., Steininger, M.K., Carroll,M. <strong>and</strong> DiMiceli, C. 2008. Humid tropical forest clearing from 2000 to 2005quantified by using multitemporal <strong>and</strong> multiresolution remotely sensed data.Proceedings of the National Academy of Sciences of the United States of America.105 (27): 9439-9444.Hoekstra, A.Y., Chapagain, A.K., Aldaya, M.M. <strong>and</strong> Mekonnen, M.M. 2011. The WaterFootprint Assessment Manual: Setting the Global St<strong>and</strong>ard Earthscan, London,UK.Hoekstra, A.Y. <strong>and</strong> Mekonnen, M.M. 2012. The Water Footprint of humanity. PNAS,published ahead of print February 13, 2012, doi:10.1073/pnas.1109936109.Hoekstra, A.Y., Mekonnen, M.M., Chapagain, A.K., Mathews, R.E. <strong>and</strong> Richter, B.D.2012. Global Monthly Water Scarcity: Blue Water Footprints versus Blue WaterAvailability. PloS ONE. 7 (2): e32688 (http://dx.plos.org/10.1371/journal.pone.0032688)Höhne, N. <strong>and</strong> Moltmann, S. 2009. Sharing the Effort under a Global Carbon Budget.WWF International <strong>and</strong> Ecofys, Gl<strong>and</strong>, Switzerl<strong>and</strong>.Honisch, B., Ridgwell, A., Schmidt, D.N., Thomas, E., Gibbs, S.J., Sluijs, A., Zeebe, R.,Kump, L., Martindale, R.C., Greene, S.E., Kiessling, W., Ries, J., Zachos, J.C.,Royer, D.L., Barker, S., Marchitto, T.M., Jr., Moyer, R., Pelejero, C., Ziveri, P.,Foster, G.L. <strong>and</strong> Williams, B. 2012. The geological record of ocean acidification.Science. 335 (6072): 1058-63.Hubacek, K., Guan, D., Barrett, J. <strong>and</strong> Wiedmann, T. 2009. Environmental implicationsof urbanization <strong>and</strong> lifestyle change in China: Ecological <strong>and</strong> Water Footprints.Journal of Cleaner Production. 17: 1241–1248.IEA 2008. Energy Technology Perspectives 2008: Scenarios <strong>and</strong> strategies to 2050.International Energy Agency, Paris, France.IPCC 2007a. Climate Change 2007: Synthesis Report. Contribution of Working GroupsI, II <strong>and</strong> III to the Fourth Assessment Report of the Intergovernmental Panel onClimate Change. IPCC, Geneva, Switzerl<strong>and</strong>.IPCC 2007b. Climate Change 2007: The Physical Science Basis. Contribution of WorkingGroup I to the Fourth Assessment Report of the Intergovernmental Panel onClimate Change. Cambridge University Press, Cambridge, United Kingdom <strong>and</strong>New York, NY, USA.IPCC 2007c. Contribution of Working Group II to the Fourth Assessment Report of theIntergovernmental Panel on Climate Change, 2007. Cambridge University Press,Cambridge, UK.IUCN 2011. IUCN Red List of Threatened Species. Version 2011.2. http://www.iucnredlist.org. IUCN downloaded on: 19 December 2011.Jaiser, R., Dethloff, K., H<strong>and</strong>orf, D., Rinke, A. <strong>and</strong> Cohen, J. 2012. Impact of sea icecover changes on the Northern Hemisphere atmospheric winter circulation. TellusSeries A: Dynamic Meteorology <strong>and</strong> Oceanography. 64: 11595.Joshi, M., Hawkins, E., Sutton, R., Lowe, J. <strong>and</strong> Frame, D. 2011. Projections of whentemperature change will exceed 2°C above pre-industrial levels. Nature ClimateChange. 1: 407–412.Kemp, A.C., Horton, B.P., Donnelly, J.P., Mann, M.E., Vermeer, M. <strong>and</strong> Rahmstorf, S.2011. Climate related sea-level variations over the past two millennia. Proc NatlAcad Sci U S A. 108 (27): 11017-22.Kinnard, C., Zdanowicz, C.M., Fisher, D.A., Isaksson, E., de Vernal, A. <strong>and</strong> Thompson,L.G. 2011. Reconstructed changes in Arctic sea ice over the past 1,450 years.Nature. 479 (7374): 509-12.Kitzes, J., Galli, A., Bagliani, M., Barrett, J., Dige, G., Ede, S., Erb, K.-H., Giljum, S.,Haberl, H., Hails, C., Jungwirth, S., Lenzen, M., Lewis, K., Loh, J., Marchettini, N.,Messinger, H., Milne, K., Moles, R., Monfreda, C., Moran, D., Nakano, K., Pyhälä,A., Rees, W., Simmons, C., Wackernagel, M., Wada, Y., Walsh, C. <strong>and</strong> Wiedmann,T. 2009. A research agenda for improving national Ecological Footprint accounts.Ecological Economics. 68 (7): 1991-2007.Kitzes, J., Wackernagel, M., Loh, J., Peller, A., Goldfinger, S. <strong>and</strong> Cheng, D. 2008. Shrink<strong>and</strong> share: humanity’s present <strong>and</strong> future Ecological Footprint. PhilosophicalTransactions of the Royal Society B-Biological Sciences. 363 (1491): 467-475.Larsen, F.W., Londonõ-Murcia, M.C. <strong>and</strong> Turner, W.R. 2011. Global priorities forconservation of threatened species, carbon storage, <strong>and</strong> freshwater services: Scopefor synergy? Conservation Letters. 4 (5): 355–363.Laurance, W.F. 2007. Forest destruction in tropical Asia. Current Science. 93 (11): 1544-1550.Laurance, W.F. 2012. Special Agricultural <strong>and</strong> Business Leases imperil forests in PapuaNew Guinea. Pacific Conservation Biology. (in press).Lenton, T., Footitt, A. <strong>and</strong> Dlugolecki, A. 2009. Major Tipping Points in the Earth’sClimate System <strong>and</strong> Consequences for the Insurance Sector. WWF <strong>and</strong> Allianz,Berlin <strong>and</strong> Munich, Germany.Lewis, S.L., Br<strong>and</strong>o, P.M., Phillips, O.L., van der Heijden, G.M. <strong>and</strong> Nepstad, D. 2011.The 2010 Amazon drought. Science. 331 (6017): 554.WWF Living Planet Report 2012 page 154 Annex: Technical notes <strong>and</strong> data tables page 155
Lewis, S.L., Lopez-Gonzalez, G., Sonke, B., Affum-Baffoe, K., Baker, T.R., Ojo, L.O.,Phillips, O.L., Reitsma, J.M., White, L., Comiskey, J.A., Djuikouo K, M.-N.,Ewango, C.E.N., Feldpausch, T.R., Hamilton, A.C., Gloor, M., Hart, T., Hladik, A.,Lloyd, J., Lovett, J.C., Makana, J.-R., Malhi, Y., Mbago, F.M., Ndangalasi, H.J.,Peacock, J., Peh, K.S.H., Sheil, D., Sunderl<strong>and</strong>, T., Swaine, M.D., Taplin, J., Taylor,D., Thomas, S.C., Votere, R. <strong>and</strong> Woell, H. 2009. Increasing carbon storage inintact African tropical forests. Nature. 457 (7232): 1003-U3.Lotze, H.K., Lenihan, H.S., Bourque, B.J., Bradbury, R.H., Cooke, R.G., Kay, M.C.,Kidwell, S.M., Kirby, M.X., Peterson, C.H. <strong>and</strong> Jackson, J.B.C. 2006. Depletion,degradation, <strong>and</strong> recovery potential of estuaries <strong>and</strong> coastal seas. Science. 312(5781): 1806-1809.Luthi, D., Le Floch, M., Bereiter, B., Blunier, T., Barnola, J.M., Siegenthaler, U.,Raynaud, D., Jouzel, J., Fischer, H., Kawamura, K. <strong>and</strong> Stocker, T.F. 2008. Highresolutioncarbon dioxide concentration record 650,000-800,000 years beforepresent. Nature. 453 (7193): 379-82.Ma, Z., Peng, C., Zhu, Q., Chen, H., Yu, G., Li, W., Zhou, X., Wang, W. <strong>and</strong> Zhang, W.2012. Regional drought-induced reduction in the biomass carbon sink of Canada’sboreal forests. Proc Natl Acad Sci USA. 109 (7): 2423-7.Mahli, Y., Wood, D., Baker, T.R., Wright, J., Phillips, O.L., Cochrane, T., Meir, P., Chave,J., Almeida, S., Arroyo, L., Higuchi, N., Killeen, T.J., Laurance, S.G., Laurance,W.F., Lewis, S.L., Monteagudo, A., Neill, D.A., Vargas, P.N., Pitman, N.C.A.,Quesada, C.A., Salomaro, R., Silva, J.N.M., Lez, A.T., Terborgh, J., Martinez, R.V.<strong>and</strong> Vinceti, B. 2006. The regional variation of aboveground live biomass in oldgrowthAmazonian forests. Global Change Biology. 12: 1107–1138.Malhi, Y., Baldocchi, D.D. <strong>and</strong> Jarvis, P.G. 1999. The carbon balance of tropical,temperate <strong>and</strong> boreal forests. Plant, Cell <strong>and</strong> Environment. 22: 715–740.Matthews, E. 2000. Undying Flame: The Continuing Dem<strong>and</strong> for Wood as Fuel.Earthtrends, World Resources Institute, Washington DC, USA.McAllister, D.E., Hamilton, A.L. <strong>and</strong> Harvey, B. 1997. Global freshwater diversity:Striving for the integrity of freshwater ecosystems. Sea Wind. 11: 1-140.MEA 2005. Ecosystems <strong>and</strong> human well-being: <strong>Biodiversity</strong> synthesis: MillenniumEcosystem Assessment, World Resources Institute, Washington, DC., USA.Meyfroidt, P. <strong>and</strong> Lambin, E.F. 2011. Global forest transition: Prospects for an end todeforestation. Annual Review of Environment <strong>and</strong> Resources. 36: 343-371.Millennium Ecosystem Assessment 2005a. Ecosystems <strong>and</strong> human well-being:<strong>Biodiversity</strong> synthesis: Millennium Ecosystem Assessment, World ResourcesInstitute, Washington, DC., USA.Millennium Ecosystem Assessment 2005b. Ecosystems <strong>and</strong> human well-being:Synthesis. World Resources Institute, Press, I., Washington, DC, USA.Millennium Ecosystem Assessment 2005c. Ecosystems <strong>and</strong> human well-being: Wetl<strong>and</strong>s<strong>and</strong> water synthesis. World Resources Institute, Washington, DC., USA.Milner-Gull<strong>and</strong>, E.J., Kholodova, M.V., Bekenov, A., Bukreeva, O.M., Grachev, I.A.,Amgalan, L. <strong>and</strong> Lushchekina, A.A. 2001. Dramatic declines in saiga antelopepopulations. Oryx. 35 (4): 340-345.Moore, D., Cranston, G., Reed, A. <strong>and</strong> Galli, A. 2012. Projecting future human dem<strong>and</strong>on the Earth’s regenerative capacity. Ecological Indicators. 16: 3-10.Mwampamba, T.H. 2007. Has the woodfuel crisis returned? Urban charcoalconsumption in Tanzania <strong>and</strong> its implications to present <strong>and</strong> future forestavailability Energy Policy. 35 (8): 4221-4234.Naidoo, R., Balmford, A., Costanza, R., Fisher, B., Green, R.E., Lehner, B., Malcolm, T.R.<strong>and</strong> Ricketts, T.H. 2008. Global mapping of ecosystem services <strong>and</strong> conservationpriorities. Proceedings of the National Academy of Sciences of the United States ofAmerica. 105 (28): 9495-9500.NASA 2012. Annual mean L<strong>and</strong>-Ocean Temperature Index in .01 degrees Celsiusselected zonal means. NASA Goddard Institute for Space Studies (GISS), NewYork, USA. http://data.giss.nasa.gov/gistemp/tabledata_v3/ZonAnn.Ts+dSST.txt,downloaded on: 1st January 2012.National Research Council 2010. Advancing the Science of Climate Change. The NationalAcademies Press, Washington, DC, USA.National Research Council 2011. Climate Stabilization Targets: Emissions,Concentrations, <strong>and</strong> Impacts over Decades to Millennia. The National AcademiesPress, Washington, DC, USA.Norm<strong>and</strong>er, B., Gregor Levin, G., Auvinen, A., Bratli, H., Stabbetorp, O., Hedblom, M.,Glimskär, A. <strong>and</strong> Gudmundsson, G.A. 2009. State of biodiversity in the Nordiccountries: An assessment of progress towards achieving the target of haltingbiodiversity loss by 2010. Copenhagen, Denmark.Norris, K., Asase, A., Collen, B., Gockowksi, J., Mason, J., Phalan, B. <strong>and</strong> Wade, A. 2010.<strong>Biodiversity</strong> in a forest-agriculture mosaic: The changing face of West Africanrainforests. Biological Conservation. 143 (10): 2341-2350.Oak Ridge National Laboratory 2011. Carbon Dioxide Emissions Rebound Quickly AfterGlobal Financial Crisis. Tennasee, USA.Porter, J.R., Deutsch, L., Dumaresq, D. <strong>and</strong> Dyball, R. 2011. How will growing cities eat?Nature. 469 (7328): 34-34.Potapov, P., Hansen, M.C., Stehman, S.V., Lovel<strong>and</strong>, T.R. <strong>and</strong> Pittman, K. 2008.Combining MODIS <strong>and</strong> L<strong>and</strong>sat imagery to estimate <strong>and</strong> map boreal forest coverloss. Remote Sensing of Environment. 112: 3708–3719.Poumanyvong, P. <strong>and</strong> Kaneko, S. 2010. Does urbanization lead to less energy use<strong>and</strong> lower CO2 emissions? A cross-country analysis. Ecological Economics. 70:434–444.Richter, B.D., Davis, M.M., Apse, C. <strong>and</strong> Konrad, C. 2011. A presumptive st<strong>and</strong>ard forenvironmental flow protection. River Research <strong>and</strong> Applications.Roberts , C.M. 2007. The Unnatural History of the Sea. Isl<strong>and</strong> Press, Covelo, USA.Rogelj, J., Hare, W., Lowe, J., van Vuuren, D.P., Riahi, K., Matthews, B., Hanaoka,T., Jiang, K. <strong>and</strong> Meinshausen, M. 2011. Emission pathways consistent with a 2degrees C global temperature limit. Nature Climate Change. 1 (8): 413-418.Rosenberg, A.A., Bolster, W.J., Alex<strong>and</strong>er, K.E., Leavenworth, W.B., Cooper, A.B. <strong>and</strong>McKenzie, M.G. 2005. The history of ocean resources: modeling cod biomass usinghistorical recrods. Frontiers in Ecology <strong>and</strong> the Environment. (3): 84-90.Saatchi, S.S., Harris, N.L., Brown, S., Lefsky, M., Mitchard, E.T.A., Salas, W., Zutta, B.R.,Buermann, W., Lewis, S.L., Hagen, S., Petrova, S., White, L., Silman, M. <strong>and</strong> Morel,A. 2011. Benchmark map of forest carbon stocks in tropical regions across threecontinents. Proceedings of the National Academy of Sciences of the United States ofAmerica. 108 (24): 9899-9904.Safina, C. <strong>and</strong> Klinger, D.H. 2008. Collapse of Bluefin Tuna in the Western Atlantic.Conservation Biology. 22 (2): 243-246.S<strong>and</strong>erson, E., Forrest, J., Loucks, C., Ginsberg, J. <strong>and</strong> Dinerstein, E. 2006. Settingpriorities for the conservation <strong>and</strong> recovery of wild tigers 2005–2015: A technicalreport WWF-US, World Wildlife Fund, Smithsonian, <strong>and</strong> National Fish <strong>and</strong>Wildlife Foundation–Save the Tiger Fund, New York <strong>and</strong> Washington, DC, USA.Schuur, E.A. <strong>and</strong> Abbott, B. 2011. Climate change: High risk of permafrost thaw. Nature.480 (7375): 32-3.Stern, N. 2006. Stern Review on The Economics of Climate Change. HM Treasury,London.Strassburg, B.B.N., Kelly, A., Balmford, A., Davies, R.G., Gibbs, H.K., Lovett, A.,Miles, L., Orme, C.D.L., Price, J., Turner, R.K. <strong>and</strong> Rodrigues, A.S.L. 2010.Global congruence of carbon storage <strong>and</strong> biodiversity in terrestrial ecosystems.Conservation Letters. 3 (2): 98-105.Strassburg, B.B.N., Rodrigues, A.S.L., Gusti, M., Balmford, B., Fritz, S., Obersteiner, M.,Turner, R.K. <strong>and</strong> Brooks, T.M. 2012. Impacts of incentives to reduce emissionsfrom deforestation on global species extinctions. Nature Climate Change.Swartz, W., Sala, E., Tracey, S., Watson, R. <strong>and</strong> Pauly, D. 2010. The spatial expansion<strong>and</strong> ecological footprint of fisheries (1950 to present). PloS ONE. 5 (12): e15143(://WOS:000284868000026)TEEB 2010. The Economics of Ecosystems <strong>and</strong> <strong>Biodiversity</strong>: Mainstreamingthe Economics of Nature: A synthesis of the approach, conclusions <strong>and</strong>recommendations of TEEB. European Commission, Brussels, Belgium.The World Bank 2012. World Development Indicators (WDI): GNI per capita, Atlasmethod (current US$). The World Bank http://data.worldbank.org/about/countryclassifications/world-bank-atlas-method,downloaded on: 21st February 2012.WWF Living Planet Report 2012 page 156 Annex: Technical notes <strong>and</strong> data tables page 157
Thurstan, R.H., Brockington, S. <strong>and</strong> Roberts, C.M. 2010. The effects of 118 years ofindustrial fishing on UK bottom trawl fisheries. Nature Communications. 1 (15):1-6.Tremblay-Boyer, L., Gascuel, D., Watson, D.R., Christensen, V. <strong>and</strong> Pauly, D. 2011.Modelling the effects of fishing on the biomass of the world’s oceans from 1950 to2006. Marine Ecology-Progress Series. 442: 169–185.Turvey, S.T., Pitman, R.L., Taylor, B.L., Barlow, J., Akamatsu, T., Barrett, L.A., ZhaoXiujiang, Reeves, R.R., Stewart, B.S., Pusser, L.T., Wang Kexiong, Wei Zhuo, ZhangXianfeng, Richlen, M., Br<strong>and</strong>on, J.R. <strong>and</strong> Ding, W. 2007. First human-causedextinction of a cetacean species? Biology Letters. 3: 537-540.UN 2009. World Urbanization Prospects, the 2009 Revision. The Population Division ofthe Department of Economic <strong>and</strong> Social Affairs of the United Nations http://esa.un.org/unpd/wup/index.htm, downloaded on: 12th December 2011.UN 2010. World Population Prospects, the 2010 Revision. Population Division of theDepartment of Economic <strong>and</strong> Social Affairs of the United Nations Secretariathttp://esa.un.org/unpd/wpp/index.htm, downloaded on: 28th February 2012.UNDP 2009. The Human Development Report: Overcoming barriers: Human Mobility<strong>and</strong> Development. UNDP, New York, USA.UNDP 2010. The Human Development Report: The Real Wealth of Nations: Pathwaysto Human Development. The United Nations Development Programme, NewYork, USA.UNDP 2011. The Human Development Report: Sustainability <strong>and</strong> Equity: A BetterFuture for All. The United Nations Development Programme, New York, USA.UNEP 2010. The Emissions Gap Report. United Nations Environment Programme,Nairobi, Kenya.UNFPA 2007. State of World Population 2007: Unleashing the Potential of UrbanGrowth. United Nations Population Fund, New York, USA.UNFPA 2011. State of World Population 2011: People <strong>and</strong> possibilities in a world of 7billion. United Nations Population Fund, New York, USA.USGCRP 2009. Global Climate Change Impacts on the United States. U.S. GlobalChange Research Program, Washington, DC, USA.van der Werf, G.R., Morton, D.C., DeFries, R.S., Olivier, J.G.J., Kasibhatla, P.S., Jackson,R.B., Collatz, G.J. <strong>and</strong> R<strong>and</strong>erson, J.T. 2009. CO2 emissions from forest loss.Nature Geoscience. 2 (11): 737-738.Vermeer, M. <strong>and</strong> Rahmstorf, S. 2009. Global sea level linked to global temperature. ProcNatl Acad Sci U S A. 106 (51): 21527-32.Wackernagel, M., Schulz, N.B., Deumling, D., Linares, A.C., Jenkins, M., Kapos, V.,Monfreda, C., Loh, J., Myers, N., Norgaard, R. <strong>and</strong> R<strong>and</strong>ers, J. 2002. Tracking theecological overshoot of the human economy. PNAS. 99: 9266–9271.Walston, J., Robinson, J.G., Bennett, E.L., Breitenmoser, U., da Fonseca, G.A.B.,Goodrich, J., Gumal, M., Hunter, L., Johnson, A., Karanth, K.U., Leader-Williams,N., MacKinnon, K., Miquelle, D., Pattanavibool, A., Poole, C., Rabinowitz, A.R.,Smith, J.L.D., Stokes, E.J., Stuart, S.N., Vongkhamheng, C. <strong>and</strong> Wibisono, H. 2010.Bringing the tiger back from the brink - the six percent solution. PloS Biology. 8:e1000485WBCSD 2010. Vision 2050: The New Agenda for Business. World Buisiness Council forSustainable Development, Geneva, Switzerl<strong>and</strong>.Wertz-Kanounnikoff, S. <strong>and</strong> Kongphan-apira, M. 2009. Emerging REDD+: Apreliminary survey of demonstration <strong>and</strong> readiness activities. Center forInternational Forestry Research (CIFOR), Bogor Barat, Indonesia.World Economic Forum 2011. Global Risks 2011: An initiative of the Risk ResponseNetwork (Sixth Edition). World Economic Forum, Geneva, Switzerl<strong>and</strong>.World Resources Institute 2011. World Resources Institute online. www.wri.org,downloaded on: 14th December 2011.WWF 2003. Thirsty Crops: Our food <strong>and</strong> clothes: eating up nature <strong>and</strong> wearing out theenvironment? WWF, Gl<strong>and</strong>, Switzerl<strong>and</strong>.WWF 2006a. Free-flowing rivers: Economic luxury or ecological necessity? WWF-GlobalFreshwater Programme, Zeist, Netherl<strong>and</strong>s.WWF 2006b. Living Planet Report. WWF, Gl<strong>and</strong>, Switzerl<strong>and</strong>.WWF 2007. Europe 2007: Gross Domestic Product <strong>and</strong> Ecological Footprint. WWFEuropean Policy Office (EPO), Brussels, Belgium.WWF 2008a. Hong Kong Ecological Footprint Report: Living Beyond Our Means. WWFHong Kong, Wanchai, Hong Kong.WWF 2008b. The Living Planet Report. WWF International, Gl<strong>and</strong>, Switzerl<strong>and</strong>.WWF 2010a. The Living Planet Report: <strong>Biodiversity</strong>, <strong>biocapacity</strong> <strong>and</strong> development.WWF-International, Gl<strong>and</strong>, Switzerl<strong>and</strong>.WWF 2010b. Reinventing the City: Three Prequisites for Greening Urban Infrastrctures.WWF International, Gl<strong>and</strong>, Switzerl<strong>and</strong>.WWF 2011a. Chapter 1: Forests for a Living Planet. in: WWF Living Forests Report,WWFInternational, Gl<strong>and</strong>, Switzerl<strong>and</strong>.WWF 2011b. Chapter 2: Forests <strong>and</strong> Energy. in: WWF Living Forests Report, WWFInternational, Gl<strong>and</strong>, Switzerl<strong>and</strong>.WWF 2011c. Chapter 3: Forests <strong>and</strong> Climate - REDD+ at a crossroads. in: WWF LivingForest Report, WWF International, Gl<strong>and</strong>, Switzerl<strong>and</strong>.WWF 2011d. The Energy Report: 100% Renewable Energy by 2050. WWF, Gl<strong>and</strong>,Switzerl<strong>and</strong>.WWF/ZSL 2012. The Living Planet Index database. WWF <strong>and</strong> the Zoological Society ofLondon. downloaded on: 22nd February 2012.Xiao, J., Zhuang, Q., Law, B.E., Baldocchi, D.D., Chen, J., Richardson, A.D., Melillo,J.M., Davis, K.J., Hollinger, D.Y., Wharton, S., Oren, R., Noormets, A., FischerM.L., Verma, S.B., Cook, D.R., Sun, G., Mcnulty, S., Wofsy, S.C., Bolstad, P.V.,Burns, S.P., Curtis, P.S., Drake, B.G., Falk, M., Foster, D.R., Gu, L., Hadley, J.L.,Katul, G.G., Litvak, M., Ma, S., Martin, T.A., Matamula, R., Meyers, T.P., Monson,R.K., Munger, J.W., Oechel, W.C., Tha Paw, U.K., Schmid, H.P., Scott, R.L., Starr,G., Suyker, A.E. <strong>and</strong> Torn, M.S. 2011. Assessing net ecosystem carbon exchange ofU.S. terrestrial ecosystems by integrating eddy covariance flux measurements <strong>and</strong>satellite observations. Agricultural <strong>and</strong> Forest Meteorology. 151 (1): 60-69.Zhao, M. <strong>and</strong> Running, S.W. 2010. Drought-Induced Reduction in Global Terrestrial NetPrimary Production from 2000 Through 2009. Science. 329 (5994): 940-943.WWF Living Planet Report 2012 page 158 Annex: Technical notes <strong>and</strong> data tables page 159
WWF WORLDWIDE NETWORKWWF OfficesArmeniaAzerbaijanAustraliaAustriaBelgiumBelizeBhutanBoliviaBrazilBulgariaCambodiaCameroonCanadaCentral African RepublicChileChinaColombiaCosta RicaDemocratic Republic of CongoDenmarkEcuadorFinl<strong>and</strong>FijiFranceGabonGambiaGeorgiaGermanyGhanaGreeceGuatemalaGuyanaHondurasHong KongHungaryIndiaIndonesiaItalyJapanKenyaLaosMadagascarMalaysiaMauritaniaMexicoMongoliaMozambiqueNamibiaNepalNetherl<strong>and</strong>sNew Zeal<strong>and</strong>NorwayPakistanPanamaPapua New GuineaParaguayPeruPhilippinesPol<strong>and</strong>RomaniaRussiaSenegalSingaporeSolomon Isl<strong>and</strong>sSouth AfricaSpainSurinameSwedenSwitzerl<strong>and</strong>TanzaniaThail<strong>and</strong>TunisiaTurkeyUg<strong>and</strong>aUnited Arab EmiratesUnited KingdomUnited States of AmericaVietnamZambiaZimbabweWWF AssociatesFundación Vida Silvestre (Argentina)Fundación Natura (Ecuador)Pasaules Dabas Fonds (Latvia)Nigerian Conservation Foundation(Nigeria)OthersEmirate Wildlife Society (UAE)As at: May 2012Publication detailsPublished in May 2012 by WWF – World WideFund for Nature (formerly World WildlifeFund), Gl<strong>and</strong>, Switzerl<strong>and</strong>. Any reproductionin full or in part of this publication mustmention the title <strong>and</strong> credit the abovementionedpublisher as the copyright owner.Recommended citation:WWF. 2012. Living Planet Report 2012.WWF International, Gl<strong>and</strong>, Switzerl<strong>and</strong>.Text <strong>and</strong> graphics: 2012 WWFAll rights reserved.Reproduction of this publication foreducational or other non-commercialpurposes is authorized without prior writtenpermission from the copyright holder.However, WWF does request advancewritten notification <strong>and</strong> appropriateacknowledgement. Reproduction of thispublication for resale or other commercialpurposes is prohibited without prior writtenpermission of the copyright holder.The designation of geographical entitiesin this report, <strong>and</strong> the presentation of thematerial, do not imply the expression of anyopinion whatsoever on the part of WWFconcerning the legal status of any country,territory, or area, or of its authorities, orconcerning the delimitation of its frontiersor boundaries.WWF Living Planet Report 2012 page 160