Wind Turbine Model for Wind- Tunnel Testing - The City College of ...
Wind Turbine Model for Wind- Tunnel Testing - The City College of ...
Wind Turbine Model for Wind- Tunnel Testing - The City College of ...
- No tags were found...

Create successful ePaper yourself
Turn your PDF publications into a flip-book with our unique Google optimized e-Paper software.
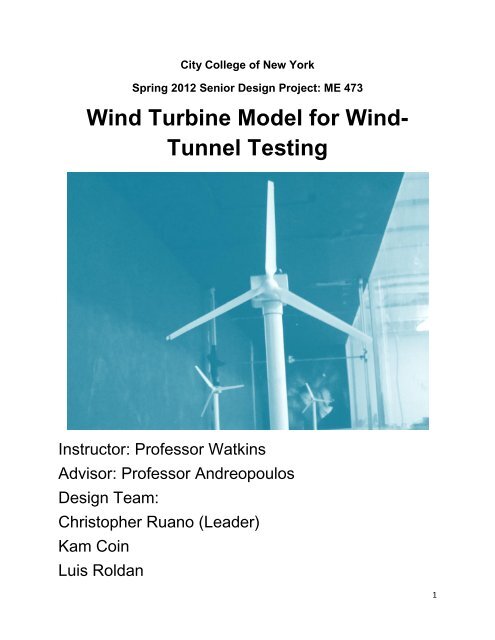
<strong>City</strong> <strong>College</strong> <strong>of</strong> New YorkSpring 2012 Senior Design Project: ME 473<strong>Wind</strong> <strong>Turbine</strong> <strong>Model</strong> <strong>for</strong> <strong>Wind</strong>-<strong>Tunnel</strong> <strong>Testing</strong>Instructor: Pr<strong>of</strong>essor WatkinsAdvisor: Pr<strong>of</strong>essor AndreopoulosDesign Team:Christopher Ruano (Leader)Kam CoinLuis Roldan1
Table <strong>of</strong> ContentsNomenclature3Introduction4Problem Statement 5Product Design Specifications 5Product Architecture 5Design Concept7<strong>Turbine</strong> Geometry 7Airfoil Selection 8BEM <strong>The</strong>ory 10Linearization 12Alignment 13Final Design 15Analysis 16Parametric Design19Motor Selection 19Nacelle Design 202
Tower Design 21Base/Support 22Final Assembly 23Design Embodiment24<strong>Wind</strong> <strong>Turbine</strong> 24Manufacturing and Fabrication 26Assembly 29Per<strong>for</strong>mance Evaluation31Mass Properties 31Experiment 1 <strong>Turbine</strong> Configuration 32Experiment 2 36Experiment 3 38Experiment 4 41Conclusion and43RecommendationsAcknowledgements463
NomenclatureAngle <strong>of</strong> AttackPitch AngleTwist AngleDensity <strong>of</strong> airTip speed ratio<strong>Turbine</strong> time constantRelative angleAngular VelocityNumber <strong>of</strong> BladesChord lengthPower CoefficientLift CoefficientDrag Coefficient<strong>Turbine</strong> diameterCurrent<strong>Turbine</strong> radiusEffective blade radiusMechanical PowerElectrical PowerVoltageCenter <strong>of</strong> gravityCenter <strong>of</strong> pressure4
Introduction<strong>Wind</strong> turbines are quickly becoming the world’s fastest growing renewableenergy technology. Over the years, wind turbines have become reliable, efficient andreduce cost <strong>of</strong> energy. <strong>Wind</strong> turbines have the ability to power homeowners, farms andeven business owners. <strong>Wind</strong> turbines are <strong>of</strong>ten used in arrays known was wind farms.<strong>The</strong>se wind farms can be seen throughout the world and are gaining popularity here inthe United States. <strong>Wind</strong> turbine farms placed on the land are called Inland <strong>Wind</strong> Farmsand turbine farms placed in the sea are called Offshore <strong>Wind</strong> Farms. This senior designproject will model both an Inland and Offshore wind farm. Be<strong>for</strong>e the wind farm can becreated, a single wind turbine must be designed.<strong>The</strong> wind turbine is assembled in four parts as shown in figure 1. <strong>The</strong> first part isthe three blade wind turbine design, which converts the kinetic energy <strong>of</strong> the wind intoMechanical energy. <strong>The</strong> wind turbine is then connected to a Nacelle, the housing, whichconceals all mechanical components like the motor, resistor and wires. <strong>The</strong> third partsupports the wind turbine and nacelle to a certain height above the surface. And lastly isthe support base. This will support the entire wind turbine assembly and connects it tothe foundation.Figure 1 <strong>Wind</strong> <strong>Turbine</strong> Assembly5
Problem Statement and Objective<strong>The</strong> purpose <strong>of</strong> this project is to design a scale down version <strong>of</strong> a wind turbine.Along with the wind turbine, a wind farm will be design in the process. <strong>The</strong> goal <strong>of</strong>designing the wind turbine is to be able to plot power as a function <strong>of</strong> wind velocity. Ourobjective is to collect data on the behavior <strong>of</strong> the wind turbine. Some <strong>of</strong> these datainvolve finding the rotation speed at a given wind velocity. <strong>The</strong> power that the windturbine generates will be calculated.Product Design Specification<strong>The</strong> wind turbine design has to be a scale model three-blade horizontal axis windturbine. <strong>The</strong> model needs to fit a 4x4x24 feet working section <strong>of</strong> the department windtunnel. <strong>The</strong> wind turbine needs to be rugged to withstand high wind speeds as well asversatile to allow interchangeability.Project Architecture<strong>The</strong> wind turbine with be tested from inside the department wind tunnel. Asshown below (Figure 2). From the schematic diagram the wind turbine will be stationedin inside the wind tunnel. <strong>The</strong> wind tunnel will provide different wind speed variation.<strong>The</strong> wind will cause the turbine to rotate by aerodynamic <strong>for</strong>ces. A high speed camerawill be used to calculate rotation speed, which in this case will act as a tachometer.Since the wind turbine is connected to a motor which outputs voltage, the powergenerated will be calculated from the voltage. This data will be collected through a dataacquisition system. For this project a data acquisition system was not available, sosimple multimeters were used to record the data.6
Figure 2: schematic diagram <strong>of</strong> wind turbine.7
Design Concept<strong>Turbine</strong> Geometry<strong>Wind</strong> turbines are characterized by their diameters. <strong>The</strong> diameter <strong>of</strong> a windturbine s defined by the diameter <strong>of</strong> the imaginary circle made around the turbine.Figure illustrates how the diameter <strong>of</strong> the wind turbine is measured. <strong>The</strong> radius <strong>of</strong> theturbine is then defined as the distance from the hub to one <strong>of</strong> the tips <strong>of</strong> the wind turbineblades. <strong>The</strong> blade itself can be broken into several subsections such as the shaft andeffective blade. <strong>The</strong> effective blade is the part that is responsible <strong>for</strong> creating theaerodynamic <strong>for</strong>ces that produce the torque. This section is <strong>for</strong>med several airfoils, andresembles that <strong>of</strong> a delta wing. Most <strong>of</strong> the design <strong>of</strong> the wind turbine will focus on thedesign <strong>of</strong> the effective blade.Figure 3: <strong>Wind</strong> <strong>Turbine</strong> Geometry<strong>The</strong> blade can be divided into small elements, dr, that consists <strong>of</strong> airfoils. Eachblade section has a relative angle, or the angle facing the relative velocity while rotating.<strong>The</strong> difference between the relative angle at the tip and the relative angle at the root isknown as the twist angle, or the amount <strong>of</strong> twist on the blade. Figure 4 shows the layout<strong>of</strong> a blade section as seen from the right. This figure illustrates how a portion <strong>of</strong> the8
we could compare different airfoils within the series. From analyzing the design <strong>of</strong>current wind turbines, and researching their construction, we noticed that the airfoils arefairly thin and significantly curved. We then looked at which NACA pr<strong>of</strong>iles matched thisparticular shape. Determining this compatibility was fairly easy because the NACApr<strong>of</strong>iles have a very particular classification. <strong>The</strong> four digit series consist <strong>of</strong> four digitnumbers that describe the curve, or camber, <strong>of</strong> the airfoil, the placement <strong>of</strong> maximumthickness from the leading edge, and the maximum thickness as a percentage <strong>of</strong> chordlength. For example, a NACA 2412 has a camber value <strong>of</strong> 2, has a maximum thicknesslocated 4/C, and a thickness <strong>of</strong> 12/C.<strong>The</strong> airfoil that was selected had to have a high camber, and overall thin shape,but also had to have more <strong>of</strong> a thickness towards the root <strong>of</strong> the blade. <strong>The</strong> initial designwas composed <strong>of</strong> a NACA 2412 airfoil at the root and NACA 6410 airfoil from mid to tip,but this blade was too thin at some points, and would not lend itself to 3D printing. Itwas also more difficult to align the airfoil sections since they had different center <strong>of</strong>pressures. One modification that had to be made was to choose an airfoil with a thickersection. For the final design the NACA 6412 was chosen, but it was also modifiedslightly so that it was slightly thicker than the NACA 6412. <strong>The</strong> figure below shows acomparison between the modified and unmodified NACA 6412 airfoils.0.4NACA 6412NACA 6412 Mod0.30.20.10-0.1-0.2-0.30 0.1 0.2 0.3 0.4 0.5 0.6 0.7 0.8 0.9 1Figure 5: NACA Pr<strong>of</strong>ile10
Blade Element and Momentum <strong>The</strong>oryAfter the airfoils that would constitute the blades <strong>of</strong> the wind turbine wereselected, determining the chord lengths and angles <strong>of</strong> the airfoils then had to bedetermined. <strong>The</strong>se parameters depended upon how fast the wind turbine was going torotate and how much power was going to be generated with respect to wind velocity.From the previous section these parameters were derived from the tip speed ratio andthe power coefficient <strong>of</strong> the turbine, respectively. <strong>The</strong>re are several methods commonlyoutlined by sources on wind turbines. Perhaps the most common is known as BladeElement and Momentum theory, or BEM. BEM theory divides the blade into severalsmall sections and determines the chord length and relative angle at these sections.This is done by applying the momentum equation and solving <strong>for</strong> the torque generatedat each section <strong>of</strong> the blade. <strong>The</strong>se equations are outlined below.<strong>The</strong> first step in defining the blade shape is to break up the blade into severalsmall sections. From the figure below, we see that the blade section, r, starts at the root,so r=0, and the at the blade tip r=R. <strong>The</strong> tip speed ratio is then defined <strong>for</strong> eachindividual section <strong>of</strong> the blade. Since we know the tip speed ratio, and the coefficient <strong>of</strong>lift <strong>for</strong> the individual sections <strong>of</strong> the blade, we can then solve <strong>for</strong> the relative angle ateach individual section. <strong>The</strong> tip speed ratio <strong>for</strong> each <strong>of</strong> the blade sections is thendefined. <strong>The</strong> chord length that is necessary to produce the lift <strong>for</strong>ce is calculated by thesecond equation.11
c/RPitch Angle<strong>The</strong> pitch and twist angles are then calculated by subtracting the angle <strong>of</strong> attackfrom the relative angle. We can then plot how the chord length and pitch angle changewith blade section r. In order to make this more applicable to any length <strong>of</strong> the blade,the parameters are normalized by the total length <strong>of</strong> the blade, R. <strong>The</strong> plots <strong>for</strong> theseparameters are provided below. <strong>The</strong> resulting chord lengths and pitch angles are tooexaggerated <strong>for</strong> implementation on modern wind turbine designs. This is because BEMtheory should only be used as a starting point <strong>for</strong> design, further refinement <strong>of</strong> the bladeshape is necessary <strong>for</strong> the final design. It is <strong>of</strong>ten recommended that a linearization <strong>of</strong>the chord length and pitch angle be made so that the blade becomes sleeker and easierto manufacture. If we were to construct the blade using specifications, the blade wouldalso look awkward and un-aesthetically pleasing. <strong>The</strong> only way <strong>of</strong> verifying whether ornot the final design <strong>of</strong> the wind turbine matches up with the design parameters is tophysically test them using wind tunnel tests, or to run computational fluid dynamicstudies using finite element s<strong>of</strong>tware.0.50.40.30.20.10-0.16050403020100-0.20.2 0.4 0.6 0.8 1r/R-100 0.2 0.4 0.6 0.8 1r/R12
LinearizationLinearization <strong>of</strong> the blade involves describing the chord length and pitch angle <strong>for</strong>the sections throughout the blade with linear equations. <strong>The</strong>se equations are <strong>for</strong>mulatedby picking two points relatively close to those found by BEM theory and drawing astraight line between them. This line can then be described by a linear equation usingthe points be<strong>for</strong>e. <strong>The</strong> reason <strong>for</strong> linearizing the chord and pitch distribution is becauseit makes the turbine more aesthetic. Most large scale wind turbines do not have theshape found from BEM theory. Another reason is that the linearized blade is easier tomodel and manufacture. <strong>The</strong> linearized chord distribution throughout the chord is shownin figure 6. <strong>The</strong> equation used <strong>for</strong> the chord distribution is shown under the figure. <strong>The</strong>points chosen are labeled a and b. <strong>The</strong> point a is at the start <strong>of</strong> the effective blade, andb is at the tip. It is evident that the chord length decreases throughout the blade so a isgreater than b. Similarly, angle e is at the effective blade and f is at the tip. We can seethe pitch angle decreases, so the blade twists up along the blade.Figure 6: Blade Linearization13
A MATLAB code was written to create a table <strong>of</strong> the blade sections, the chordlengths, pitch angles, center <strong>of</strong> pressure, and centers <strong>of</strong> gravity. This MATLAB code isentitled <strong>Turbine</strong> Design, and is available in the group project website or dropbox. <strong>The</strong>inputs <strong>for</strong> the code are the linearizations a, b, e, f, and the length <strong>of</strong> the blade. <strong>The</strong> tableis created by using the chord and pitch angle distribution equations above. <strong>The</strong> tablealso features the center <strong>of</strong> pressures and centers <strong>of</strong> gravity <strong>for</strong> each <strong>of</strong> the bladesections. <strong>The</strong> methods used to determine this are described in the next section, and areprimarily used <strong>for</strong> alignment <strong>of</strong> the blade sections. <strong>The</strong> output <strong>for</strong> the code is a text file<strong>of</strong> the table created. This text file can then be read by another code used to create andalign the sections.AlignmentDetermining this location along the airfoil is well documented since it is used asthe location <strong>for</strong> applying the aerodynamic <strong>for</strong>ces. <strong>The</strong> center <strong>of</strong> pressure is defined asone quarter <strong>of</strong> the chord length minus the pitching moment at one fourth <strong>of</strong> the leadingedge divided by the lift <strong>for</strong>ce. Since we don’t know the pitching moment or the lift <strong>for</strong>ce,we can determine the coefficient <strong>of</strong> moment and coefficient <strong>of</strong> lift <strong>for</strong> the airfoil used atthe angle <strong>of</strong> attack selected. <strong>The</strong> equation <strong>for</strong> the location <strong>of</strong> the center <strong>of</strong> pressure thenbecomes the second equation below.<strong>The</strong> center <strong>of</strong> gravity <strong>for</strong> each <strong>of</strong> the individual airfoil was also calculated by usingthe built in Evaluate feature in SolidWorks. This feature displaces the x, y, and z points<strong>for</strong> the center <strong>of</strong> gravity. We then tabulated the results <strong>for</strong> the center <strong>of</strong> pressure andcenter <strong>of</strong> gravity <strong>for</strong> each <strong>of</strong> the airfoils shapes. <strong>The</strong> airfoils were then aligned in their x-position by their center <strong>of</strong> pressure, and y-position by their center <strong>of</strong> gravity. <strong>The</strong> airfoilsare then rotated about the location <strong>of</strong> alignment. <strong>The</strong> amount that they are rotated isdefined by the pitch angle calculated in the previous section.14
A separate MATLAB code was written to create the airfoil shapes and align themaccording to the method described above. This MATLAB code is called airfoils becauseit creates the exact airfoils that will be used <strong>for</strong> the solid model <strong>of</strong> the turbine. <strong>The</strong> codeinputs the text file from the code used to design the blade. It begins by creating theairfoil shapes with the exact chord lengths determined by the design process. <strong>The</strong>airfoils are then aligned in the x-axis by their centers <strong>of</strong> pressure. This becomes theorigin <strong>of</strong> the blade. Each blade pr<strong>of</strong>ile is then tilted by the pitch angle and then all thepr<strong>of</strong>iles are shifted to the center <strong>of</strong> gravity <strong>of</strong> the first airfoil. This is where the effectiveblade will be connected to the rest <strong>of</strong> the turbine blade and hub. A separate text file iscreated <strong>for</strong> each airfoil. <strong>The</strong> text file has the x, y, and z coordinates <strong>of</strong> the airfoil. <strong>The</strong>setext files can then be directly imported into SolidWorks, where the actual blade iscreated.3210-1-2-3-4-5-5 -4 -3 -2 -1 0 1 2 3 4 5Final DesignFigure 7: MATLAB Pr<strong>of</strong>iles<strong>The</strong> solid model <strong>of</strong> the wind turbine begins by creating the blade sections inSolidWorks. This step was made simpler with the text files created by the MATLABcode used be<strong>for</strong>e. <strong>The</strong> text files are imported by the use <strong>of</strong> the insert curve through xyzoption. <strong>The</strong> shaft <strong>of</strong> the blade is made after all the sections are imported. <strong>The</strong> hub is15
AnalysisOnce the turbine has been designed using SolidWorks, the analysis <strong>of</strong> theturbine can begin. CFD simulations are per<strong>for</strong>med on the finished wind turbine design todetermine the per<strong>for</strong>mance <strong>of</strong> the turbine. <strong>The</strong> setup <strong>for</strong> the simulations is a singleturbine placed inside a control volume or enclosure, and inputting a wind velocity in thedirection <strong>of</strong> the turbine. After the geometry is created, a mesh is <strong>for</strong>med around theentire geometry. <strong>The</strong> boundary conditions <strong>for</strong> the simulations are the inlet velocities thatwere similar to those used in the wind tunnel. <strong>The</strong> simulations are done using a nonrotatingturbine. A user defined function, or UDF, was developed by graduate studentsthat rotated the turbine according to torque developed on the turbine and the moment <strong>of</strong>inertia. <strong>The</strong> code assumed a steady state angular velocity according to the last timestep <strong>of</strong> the simulation, and so the rotational speed was somewhat arbitrary. <strong>The</strong>equation that describes the angular velocity <strong>of</strong> the turbine with respect to time is morecomplicated, and so this is only determined by the use <strong>of</strong> actual experiments conductedon a physical model.Figure 10: Fluent Mesh<strong>The</strong> simulations only calculate the velocities and pressures throughout theturbine when it is not rotating. <strong>The</strong> <strong>for</strong>ces and moments can then be calculated by17
Fluent according the pressures developed on the turbine. <strong>The</strong>se types <strong>of</strong> reportscalculate the pressure per each face <strong>of</strong> the mesh, and so can used accurately todetermine the torque <strong>of</strong> the turbine. This is accomplished by telling Fluent in what originand what axis to calculate the moment developed, and since the turbine rotates about acertain axis, the torque is this moment calculated. An example report is shown in thefigure below. <strong>The</strong> highlighted section is the torque that was calculated. <strong>The</strong> torques arethen tabulated <strong>for</strong> each <strong>of</strong> the velocities used and plotted. A plot <strong>of</strong> the torques witheach <strong>of</strong> the velocities is shown in the figure below.Figure 11: Fluent ResultsFigure 12: Torque Report18
Torque (Nm)0.010.0090.0080.0070.0060.0050.0040.0030.0020.00102 3 4 5 6 7 8 9 10 11<strong>Wind</strong> Velocity (m/s)Figure 13: Fluent Calculations <strong>of</strong> Torque19
Parametric DesignMotor SelectionFor this project, the power generated by the turbine will be measured byelectrical means. This requires that the turbine be attached to some type <strong>of</strong> generator.Currently, there are no generators that are made to this scale, but small DC motors canbe used effectively as generators. <strong>The</strong> selection <strong>of</strong> the motor had to be critical becauseit must be around the same scale as the turbine, be efficient at the speeds <strong>of</strong> theturbine, and have a small starting torque. Of those requirements, the most importanthad to be the low starting torque. <strong>The</strong> starting torque is the torque necessary <strong>for</strong> themotor to start rotating. If this is too high, the turbine will not start to rotate at low windspeeds and so have a large cut in wind speed. <strong>The</strong> overall angular velocity will also beaffected because some <strong>of</strong> the torque produced will be consumed by the motor. Thismeans that the motor shaft had to spin easily when rotated.Figure 14: Pololu Brushed DC Motor<strong>The</strong> selection <strong>of</strong> the motor analyzed several different types <strong>of</strong> motors fromdifferent manufactures, but ultimately one motor was chosen that most closely fit all therequirements. This motor is brushed DC motor from a company called Polou. <strong>The</strong> selleralso provided the efficiency <strong>of</strong> the motor along with some operating parameters. <strong>The</strong>20
adapter will make a tight fit with the tower so that movement <strong>of</strong> the two components isdifficult, but still possible if adjustment is necessary.Tower Design<strong>The</strong> tower holds the turbine at a certain height so that the turbine blades arecapable <strong>of</strong> capturing the most wind. <strong>The</strong> height <strong>of</strong> the tower is dependent on the velocitypr<strong>of</strong>ile <strong>of</strong> the environment. If <strong>for</strong> example the turbine is placed in an area that is heavilycondensed with trees and other obstacles, the velocity will be low towards the ground,so the tower should be built higher above the ground. If the turbine is placed in an areathat is relatively isolated, like the plains or ocean, the tower does not have to be as tall.<strong>The</strong> expense <strong>of</strong> the tower increases the taller it is, but the power extracted alsodramatically increases, so there is <strong>of</strong>ten an optimization <strong>of</strong> this length. Since the modelturbines in this project are supposed to model both land and <strong>of</strong>fshore wind turbines, theheight is left to interpretation. On average, the tower height to turbine ratio is about oneto one <strong>for</strong> most turbines, most <strong>of</strong> the times it is a little over one. For this project thetower height to turbine diameter is 1.25, which would make the height 25 centimeters. Inthe solid model, the tower is design as a hollow tube. In this way, the wires can berouted from the motor to the base.Figure 16: Tower22
Base/Support<strong>The</strong> base is the part <strong>of</strong> the wind turbine assembly that supports the tower andprevents it from tipping over during high wind speeds. <strong>The</strong>re was some concern that theturbine assembly would behave like a cantilever beam when subjected to high winds,but this could be avoided if the tower was sturdy and if the base supported theassembly sufficiently. At first, the base was designed as something that resembled aplumbing flange, but this designed left the wires from the motor hanging out andoccupied too much space. <strong>The</strong> redesigned space is a lot more space friendly andincorporates a method <strong>for</strong> connection to a data acquisition system. It is still sturdyenough to support the wind turbine assembly under high wind speeds and has amethod <strong>of</strong> attachment to some sort <strong>of</strong> plat<strong>for</strong>m via small holes around the perimeter.Figure 17: Base DesignMost data acquisitions use BNC connections to transmit the analog signal fromsensors to the analog to digital converter inside. In this situation, the generator acts likea sensor that transmits the amount <strong>of</strong> voltage being produced. It could be said thatthese BNC connections are an industry standard method <strong>of</strong> connection. <strong>The</strong>re alsoplenty <strong>of</strong> BNC cables located in the departmental wind tunnel room. A male adaptor isconnected to the base so that a BNC cable with a female end can be attached. <strong>The</strong>seadaptors are available from most electronic parts retailers. A picture <strong>of</strong> BNC adaptorthat was used is shown below.23
Figure 18: BNC PlugFinal Assembly<strong>The</strong> final design <strong>of</strong> the wind turbine is the wind turbine assembly. <strong>The</strong> entire windturbine assembly consists <strong>of</strong> all the components mentioned above. <strong>The</strong> wind turbine isplaced onto the motor via a small hole in the center <strong>of</strong> the turbine. <strong>The</strong> turbine is held inplace by a tight fit made between the two components. <strong>The</strong> motor is placed into thenacelle, and is held in place by the plastic stand<strong>of</strong>fs. <strong>The</strong> nacelle is assembled withmachine screws. <strong>The</strong> nacelle and wind turbine are attached by an adaptor that is gluedonto the bottom piece <strong>of</strong> the nacelle. <strong>The</strong> tower connects to the base again by tight fit,and the wires that connected to the motor are routed from the tower to the base. <strong>The</strong>terminals are connected to a BNC connector, which is capable <strong>of</strong> attaching to most dataacquisition systems. <strong>The</strong> entire assembly can be bolted or screwed down to some sort<strong>of</strong> plat<strong>for</strong>m by the four holes around the base.Figure 19: Final <strong>Wind</strong> <strong>Turbine</strong> Assembly24
Design Embodiment<strong>Wind</strong> <strong>Turbine</strong><strong>The</strong>re was a great amount <strong>of</strong> consideration taken into the design <strong>of</strong> the turbine,especially to the turbine blades. That is why it is important the turbine be manufacturedas closely as possible to the solid model. Using inadequate methods <strong>of</strong> manufacturingwould jeopardize the entire project since any data collected from the physical modelwould not reflect theoretical values. <strong>The</strong> method that was chosen to be most suitable <strong>for</strong>the creation <strong>of</strong> the wind turbine was 3D printing. <strong>The</strong> first step to having a 3D printedmodel was to find a source <strong>for</strong> printing. <strong>The</strong> 3D printer in the school was deemedunsuitable as the resolution was fairly low, and the quality <strong>of</strong> the finished product wasrough. A company called Shapeways, which is located in Long Island <strong>City</strong>, printedmodels based on the stl file submitted. <strong>The</strong> solid model <strong>of</strong> the wind turbine wasconverted into an stl file, but be<strong>for</strong>e the file was uploaded it had to be refined so that thequality would be high.Figure 20: Shapeways <strong>Model</strong>Uploading a file that was acceptable by Shapeways and that was able to printwas somewhat <strong>of</strong> a challenge. This is because Shapeways has certain conditions <strong>for</strong>25
Figure 24: Tower ManufacturingAll <strong>of</strong> the nine bases were fabricated from two inch thick aluminum stocks thatmeasured eight by eight inches. <strong>The</strong> tool path was again made in HSM, but requiredmore complex operations since it would be 3D contouring. A picture <strong>of</strong> what the stocklooked like after it was milled is shown in figure . After the bases were milled out, theywere sanded to remove the tool marks and polished to give them a finished look. <strong>The</strong>holes around the perimeter and the hole <strong>for</strong> the BNC connector were drilled using anordinary hand drill. This completed the fabrication process, and the task <strong>of</strong> puttingtogether all the parts came next.29
Figure 25: Base ManufacturingAssemblyOnce all the components <strong>of</strong> the wind turbine were manufactured and ready, theassembly <strong>of</strong> the components could be begin. Since multiple turbines had to be puttogether, all the turbines were assembled using an assembly line method. That meantthat one stage <strong>of</strong> the assembly was done at the same time <strong>for</strong> all the turbines, and allthe turbines were finished at the same time. This process began by gluing all the partsthat made up the nacelle. <strong>The</strong>se included the plastic stand<strong>of</strong>fs and the adaptor. <strong>The</strong>adhesive <strong>of</strong> choice <strong>for</strong> this step was JB bond epoxy resin. <strong>The</strong> BNC connector was alsoglued onto the base because threads were not able to be made. <strong>The</strong> connections <strong>for</strong>the connector were soldered, and the tower was placed inside the base.Figure 26: Assembly Method30
<strong>The</strong> tower was connected to the nacelle by means <strong>of</strong> tight fit on to the adaptor.Be<strong>for</strong>e the motor was placed inside the nacelle, the wires and a resistor were solderedonto it. <strong>The</strong> resistor made it easy to measure the voltage and the current. Once <strong>The</strong>motor was fitted onto the nacelle, and all the wires were properly placed, the two nacellepieces were joined together. <strong>The</strong> circuit was then checked to see if there were anyshorts by checking the voltage when the motor was spun. <strong>The</strong> wind turbines were thenplaced onto the motor shafts. A very tight fit was necessary so that the turbines wouldnot slip during high wind speeds. <strong>The</strong> turbines were then ready to be used inside thewind tunnel.Figure 27: <strong>Wind</strong> <strong>Turbine</strong> Farm31
Per<strong>for</strong>mance EvaluationMass Properties<strong>The</strong> theoretical calculations <strong>of</strong> the wind turbine depended on several massproperties <strong>of</strong> the wind turbine. This included the total mass and the mass moment <strong>of</strong>inertia. SolidWorks has an accurate calculator <strong>for</strong> the mass properties, but this requiredthat the material type be chosen. <strong>The</strong> material <strong>for</strong> the wind turbine was nylon, but thedensity <strong>of</strong> nylon could not be used because the wind turbine was 3D printed, and so nota homogenous material. To determine the density <strong>of</strong> the turbine, we got the mass froma scale and divided by the volume determined by SolidWorks. <strong>The</strong> density came out tobe 920 kg/m^3. This was close to the density <strong>of</strong> nylon, which is about 1200 kg/m^3, butthe turbine is not completely solid. Once the density was determined, the density wasinputted into the solid model, and the mass properties were evaluated.Figure 28: Mass Determination32
Experiment 1<strong>The</strong> purpose <strong>of</strong> this project was to examine the behavior <strong>of</strong> wind turbines andmeasure the power <strong>of</strong> the turbines <strong>for</strong> given wind speeds. Be<strong>for</strong>e several wind turbinescould be placed inside the wind tunnel, each turbine that was to be used had to beplaced inside the wind tunnel alone. This way, the angular velocity <strong>of</strong> the turbine can bemeasured at each wind speed. This would also serve in calibrating each turbine. Eachturbine had to be calibrated because the motor <strong>of</strong> each could differ slightly. <strong>The</strong>experiment began by placing the wind turbines inside the wind tunnel and the windspeed is set according the frequency control. Once the wind enters the wind tunnel, theturbines begin to spin, and a voltage and current is measured by the multimeter. <strong>The</strong>electrical power generated is then calculated by the equation shown below. <strong>The</strong> angularvelocity is captured by the high speed camera. A small mark is made on one <strong>of</strong> theblades <strong>of</strong> the turbine, and the number <strong>of</strong> frames per rotation is counted. <strong>The</strong> power andthe angular velocity are plotted against the wind speed.Figure 29: <strong>Wind</strong> <strong>Turbine</strong> Calibration33
Angular Velocity (rad/s)Electrical Power (Watts)<strong>The</strong> plot <strong>of</strong> angular velocity versus wind speed <strong>for</strong> the first, second, and thirdturbines are shown in figures 30, 31, and 32, respectively. <strong>The</strong> angular velocity <strong>for</strong> theturbines are calibrated by the voltage produced. <strong>The</strong> mechanical power <strong>for</strong> the turbinesis then calculated by multiplying the torque times the angular velocity. <strong>The</strong> powercoefficient and tip speed ratio can then be derived <strong>for</strong> each <strong>of</strong> the turbines. <strong>The</strong>electrical power <strong>for</strong> the wind turbine is calculated by the product <strong>of</strong> the voltage and thefrequency measured. <strong>The</strong> electrical power <strong>for</strong> each <strong>of</strong> the turbines is then calibrated byeach <strong>of</strong> the voltages. We can see that all the turbines rotate at the same speeds, buthave some differences in the electrical power. This is because <strong>of</strong> the differences <strong>of</strong> themotor.200Motor Calibration <strong>for</strong> <strong>Turbine</strong> 10.010.009Motor Calibration <strong>for</strong> <strong>Turbine</strong> 1180160140120100800.0080.0070.0060.0050.004600.003400.002200.00100 0.1 0.2 0.3 0.4 0.5 0.6 0.7Voltage (V)00 0.1 0.2 0.3 0.4 0.5 0.6 0.7Voltage (V)Figure 30: Calibration <strong>for</strong> <strong>Turbine</strong> 134
Angular Velocity (rad/s)Angular Velocity (rad/s)Electrical Power (Watts)Electrical Power (Watts)200Motor Calibration <strong>for</strong> <strong>Turbine</strong> 20.01Motor Calibration <strong>for</strong> <strong>Turbine</strong> 21800.0091600.0081400.0071201008060402000 0.1 0.2 0.3 0.4 0.5 0.6 0.7 0.8 0.9Voltage (V)0.0060.0050.0040.0030.0020.00100 0.1 0.2 0.3 0.4 0.5 0.6 0.7 0.8 0.9Voltage (V)Figure 31: Calibration <strong>for</strong> <strong>Turbine</strong> 2200Motor Calibration <strong>for</strong> <strong>Turbine</strong> 30.01Motor Calibration <strong>for</strong> <strong>Turbine</strong> 31800.0091600.0081400.0071201008060402000 0.1 0.2 0.3 0.4 0.5 0.6 0.7 0.8 0.9Voltage (V)0.0060.0050.0040.0030.0020.00100 0.1 0.2 0.3 0.4 0.5 0.6 0.7 0.8 0.9Voltage (V)Figure 32: Calibration <strong>for</strong> <strong>Turbine</strong> 335
Figure 33: <strong>Turbine</strong> 1 Power CurveFigure 34: <strong>Turbine</strong> 2 Power Curve36
Figure 35: <strong>Turbine</strong> 3 Power CurveExperiment 2<strong>The</strong> second experiment consisted <strong>of</strong> 2 turbines positioned side by side. <strong>The</strong> twoturbines were placed equal distance <strong>of</strong>f the wind tunnel wall. <strong>The</strong> purpose <strong>of</strong> setting theturbines in this manner was to see the effect <strong>of</strong> the turbines when they are placed sideby side. <strong>The</strong> turbines are both calibrated. We were aware <strong>of</strong> the fact that these twoturbines were not exactly equal distance. <strong>The</strong>re was some inaccuracy. <strong>The</strong> two turbinesthat were calibrated were also <strong>of</strong>f by 2-4%. This is due to the manufacturinginconsistency <strong>of</strong> the motors. <strong>The</strong> distance between the two turbines was 3D. 3D is thestandard length <strong>of</strong> most <strong>of</strong>fshore wind farm. <strong>The</strong> diameters <strong>of</strong> the turbines are 20cm.<strong>The</strong> figure below shows the visual illustration <strong>of</strong> the setup. (figure 36)37
Figure 36: Two <strong>Wind</strong> <strong>Turbine</strong>s<strong>The</strong> experimental result did not show any change in the power <strong>of</strong> these twoturbines. As mention earlier, we have to take into account that the difference in thecalibration and the inaccuracy when setting up the turbine, equal distance from the wall.<strong>The</strong> both <strong>of</strong> the turbines were set to be 1 foot away from the wall, but we mounted theturbines on plywood. <strong>The</strong> plywood was not all the same size.Taking account <strong>of</strong> the discrepancies, the power output did not change. We hadsimilar results from both <strong>of</strong> the wind turbines. This is the last analysis we will be doingside by side. <strong>The</strong> change in power is insignificant. <strong>The</strong>y both remain the same We cancome to a conclusion wind turbines placed at 3D side to side will not have any drop inpressure. We can see the Results shown below.38
Electrical Power (W)0.0120.01Side by SideLeftRight0.0080.0060.0040.00201 2 3 4 5 6 7 8 9 10 11<strong>Wind</strong> Speed (m/s)Figure 37: Side by Side ResultExperiment 3For this following experiment, 3 turbines (which was calibrated) were placedstraight behind one another. <strong>The</strong> distance behind one another was 6D (the conventionaldistance <strong>for</strong> <strong>of</strong>fshore turbines). One <strong>of</strong> the major discrepancies in this experiment wasthe first turbine. <strong>The</strong> first calibration <strong>of</strong> the first turbine was 15% greater than the othertwo. We also have to consider the boundary layer effects. <strong>The</strong> first one was placedclose to the inlet. <strong>The</strong> experiment was continued to see the difference in angularvelocity. <strong>The</strong> figure below shows the setup <strong>of</strong> the experiment. (Figure 38)39
Experiment 4For the fourth experiment, we placed the turbines staggered to one another inrows. For this experiment, we moved the second turbine 1.5D to the left from where itwas positioned from experiment 3. From the 1 st experiment, we knew the first turbinehad some discrepancies, so we were expecting a similar result <strong>for</strong> this experiment aswell.Figure 40: Three <strong>Turbine</strong>s StaggeringFrom the fourth experiment, we saw another significant drop on the first turbine.What we saw this time was a greater increase in the third row in power. <strong>The</strong> staggeringhelp overcome the wake distribution. <strong>The</strong> angular velocity also increased compared tothe 3 rd experiment. <strong>The</strong> gap between the 2 nd and third turbine in the power graphdecreased.41
Electrical Power (W)0.0120.01Coloumns StaggeringFrontMiddleLast0.0080.0060.0040.00201 2 3 4 5 6 7 8 9 10 11<strong>Wind</strong> Speed (m/s)Figure 41: Columns Staggering ResultsExperiment 5For this experiment, we positioned the turbines in corresponding distance. Wepositioned the turbines back to back. <strong>The</strong>re was no staggering in this experiment. Wewant to see the effects the second turbine will have by placing the turbines in differentdistances. We placed them in a distance 1.5D, 3D, 4D and 5D from each other. Thistime the turbines were calibrated at the same amount. <strong>The</strong> difference was less than 2%.<strong>The</strong> turbines were also placed away from the inlet to avoid any boundary layer affects.We also saw the wake distribution with a smoke test. <strong>The</strong> setup is illustrated below.42
Electrical Power (W)Figure 42: Two <strong>Turbine</strong>s 1.5DThis time the results were as expected. As we increase the distance, the power<strong>of</strong> the second turbine increases. <strong>The</strong> slow motion video also shows the wakedistribution <strong>of</strong> the first turbine affecting the flow <strong>of</strong> the second turbine.0.010.0090.0080.007Back <strong>Turbine</strong>1.5D3D4D5D0.0060.0050.0040.0030.0020.00101 2 3 4 5 6 7 8 9 10 11<strong>Wind</strong> Speed (m/s)Figure 43: Results <strong>for</strong> the Back <strong>Turbine</strong> <strong>for</strong> Different Spacings43
Conclusion<strong>The</strong> objective <strong>of</strong> the project was to increase the efficiency <strong>of</strong> the wind turbines inevery row after the first row. We were aware <strong>of</strong> the wake distribution from the slowmotion video. With a number <strong>of</strong> conducted experiments in the wind tunnel, we were ableto find the affects the turbines encounter and how to overcome them. <strong>The</strong> turbine’s thatwere designed were structurally stable to withstand high velocity in the wind tunnel.With the addition <strong>of</strong> the BNC connector, it was possible to measure the voltage withoutinterfering the wind flow. One important parameter <strong>of</strong> this experiment is the tip speedratio and the power coefficient. <strong>The</strong> turbine used <strong>for</strong> the experiment had the same tipspeed ratio and power coefficient. <strong>The</strong> tip speed ratio is the ratio between the rpm andthe wind velocity. All <strong>of</strong> the turbines had similar results. <strong>The</strong> power coefficient is theoutput <strong>of</strong> the electrical power over the input over the input power.In the Experiments, we took account <strong>of</strong> the boundary layer affects and theturbines design. We calibrated each turbines used. <strong>The</strong> calibration gave us angularvelocity as a function <strong>of</strong> voltage and power as a function <strong>of</strong> voltage. <strong>The</strong> use if the highsped camera helped us measure the RPM. <strong>The</strong> high-speed camera also shows thewake distribution. Experiment one was important in determining which turbines to use.We calibrated all the turbines. Experiment one also showed the wake distribution.Experiment 2 was to see any possible affect we may have in the power output byplacing the turbines side by side. We saw that there was affect. We concentrated ourexperiments on the affects we will have by placing the turbines in columns. For the thirdexperiment, we placed 3 turbines back to back. <strong>The</strong> distance between the turbines is6D. This experiment helps us acknowledge the boundary layer affects in the windtunnel. We saw the first turbine began to decrease in voltage, the second and thirdturbine showed predictable results. <strong>The</strong> third turbine decreased in voltage compared tothe second turbine. Later on in Experiment 4, when we stagger the turbines, we can seethe second and third turbines power outputs are similar. Staggering help us increase the44
efficiency <strong>of</strong> the turbines. <strong>The</strong> greater the distance <strong>of</strong> the turbines in row, the moreefficient each turbine will be. This was the purpose <strong>of</strong> the fifth experiments. By changingthe distance between the turbines, we see the power output increasing with greaterdistance.Staggering and increasing the distance between the rows will increase theefficiency. All the turbines can have similar power output if we can avoid positioning theturbines directly behind each other. We see this affect in the staggering experiment andthe fifth experiment.45
RecommendationsFor future studies, in order to have a complete wind tunnel, we should consider abigger wind tunnel. With a bigger wind tunnel, we can place more turbines and have amore in depth study. We should also consider a bigger wind turbine. With a bigger windturbine we will be able to see a greater wake distribution with the high-speed camera. Abigger turbine is also easier to manufacture. <strong>The</strong> motor used in this experiment is a dcmotor. We can optimize the wind turbine design with a magnetic induction motor. <strong>The</strong>semotors are generally used in actual wind turbines.<strong>The</strong> voltages were measured with a multimeter. One multimeter was needed tomeasure each turbine. A proper DAQ system with voltage display would make the setup<strong>of</strong> the project less stressful. <strong>The</strong> current DAQ does not display the voltage output. <strong>The</strong>data need to be exported to such program like matlab to find the average voltage. Thiswas time consuming.46
AcknowledgementPr<strong>of</strong>essor WatkinsPr<strong>of</strong>essor AndreopoulosPr<strong>of</strong>essor GouschaMr. ChenLouis Hernandez47