Mechanisms of longitudinal cracks along pavement shoulder in ...
Mechanisms of longitudinal cracks along pavement shoulder in ...
Mechanisms of longitudinal cracks along pavement shoulder in ...
- No tags were found...

Create successful ePaper yourself
Turn your PDF publications into a flip-book with our unique Google optimized e-Paper software.
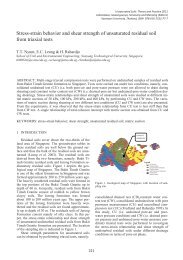
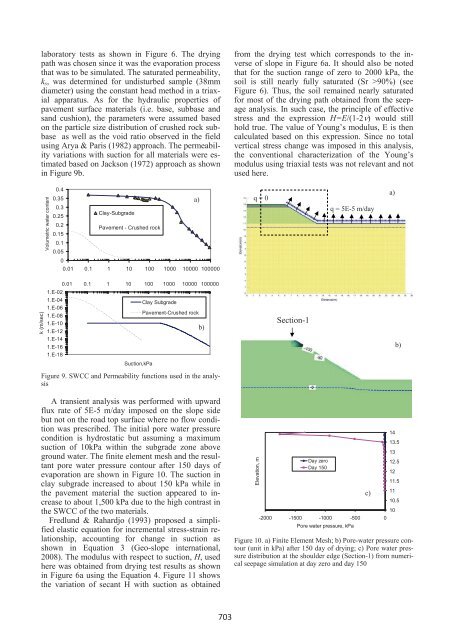
laboratory tests as shown <strong>in</strong> Figure 6. The dry<strong>in</strong>gpath was chosen s<strong>in</strong>ce it was the evaporation processthat was to be simulated. The saturated permeability,k s , was determ<strong>in</strong>ed for undisturbed sample (38mmdiameter) us<strong>in</strong>g the constant head method <strong>in</strong> a triaxialapparatus. As for the hydraulic properties <strong>of</strong><strong>pavement</strong> surface materials (i.e. base, subbase andsand cushion), the parameters were assumed basedon the particle size distribution <strong>of</strong> crushed rock subbaseas well as the void ratio observed <strong>in</strong> the fieldus<strong>in</strong>g Arya & Paris (1982) approach. The permeabilityvariations with suction for all materials were estimatedbased on Jackson (1972) approach as shown<strong>in</strong> Figure 9b.from the dry<strong>in</strong>g test which corresponds to the <strong>in</strong>verse<strong>of</strong> slope <strong>in</strong> Figure 6a. It should also be notedthat for the suction range <strong>of</strong> zero to 2000 kPa, thesoil is still nearly fully saturated (Sr >90%) (seeFigure 6). Thus, the soil rema<strong>in</strong>ed nearly saturatedfor most <strong>of</strong> the dry<strong>in</strong>g path obta<strong>in</strong>ed from the seepageanalysis. In such case, the pr<strong>in</strong>ciple <strong>of</strong> effectivestress and the expression H=E/(1-2ν) would stillhold true. The value <strong>of</strong> Young’s modulus, E is thencalculated based on this expression. S<strong>in</strong>ce no totalvertical stress change was imposed <strong>in</strong> this analysis,the conventional characterization <strong>of</strong> the Young’smodulus us<strong>in</strong>g triaxial tests was not relevant and notused here.Volumetric water contentq = 0q = 5E-5 m/daya)k (m/sec)0.40.35a)0.30.25Clay-Subgrade0.2Pavement - Crushed rock0.150.10.0500.01 0.1 1 10 100 1000 10000 100000Suction, kPa0.01 0.1 1 10 100 1000 10000 1000001.E-021.E-04Clay Subgrade1.E-061.E-08Pavement-Crushed rock1.E-101.E-12b)1.E-141.E-161.E-18Section-1b)Suction,kPaFigure 9. SWCC and Permeability functions used <strong>in</strong> the analysisA transient analysis was performed with upwardflux rate <strong>of</strong> 5E-5 m/day imposed on the slope sidebut not on the road top surface where no flow conditionwas prescribed. The <strong>in</strong>itial pore water pressurecondition is hydrostatic but assum<strong>in</strong>g a maximumsuction <strong>of</strong> 10kPa with<strong>in</strong> the subgrade zone aboveground water. The f<strong>in</strong>ite element mesh and the resultantpore water pressure contour after 150 days <strong>of</strong>evaporation are shown <strong>in</strong> Figure 10. The suction <strong>in</strong>clay subgrade <strong>in</strong>creased to about 150 kPa while <strong>in</strong>the <strong>pavement</strong> material the suction appeared to <strong>in</strong>creaseto about 1,500 kPa due to the high contrast <strong>in</strong>the SWCC <strong>of</strong> the two materials.Fredlund & Rahardjo (1993) proposed a simplifiedelastic equation for <strong>in</strong>cremental stress-stra<strong>in</strong> relationship,account<strong>in</strong>g for change <strong>in</strong> suction asshown <strong>in</strong> Equation 3 (Geo-slope <strong>in</strong>ternational,2008). The modulus with respect to suction, H, usedhere was obta<strong>in</strong>ed from dry<strong>in</strong>g test results as shown<strong>in</strong> Figure 6a us<strong>in</strong>g the Equation 4. Figure 11 showsthe variation <strong>of</strong> secant H with suction as obta<strong>in</strong>edElevation, mDay zeroDay 150-2000 -1500 -1000 -500 0Pore water pressure, kPa13.512.511.510.510Figure 10. a) F<strong>in</strong>ite Element Mesh; b) Pore-water pressure contour(unit <strong>in</strong> kPa) after 150 day <strong>of</strong> dry<strong>in</strong>g; c) Pore water pressuredistribution at the <strong>shoulder</strong> edge (Section-1) from numericalseepage simulation at day zero and day 150c)14131211703