Effectiveness of horizontal drains in improving slope stability: a case ...
Effectiveness of horizontal drains in improving slope stability: a case ...
Effectiveness of horizontal drains in improving slope stability: a case ...

Create successful ePaper yourself
Turn your PDF publications into a flip-book with our unique Google optimized e-Paper software.
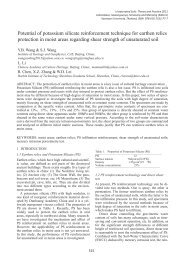
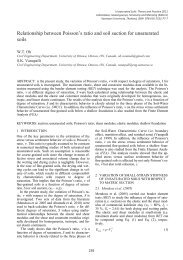
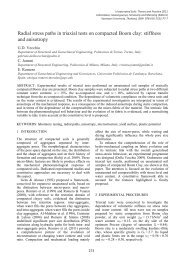
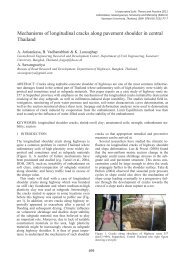
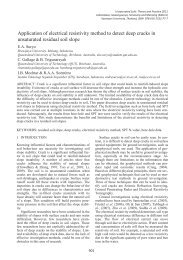
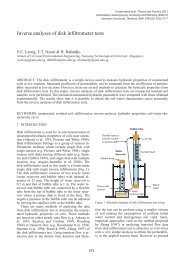
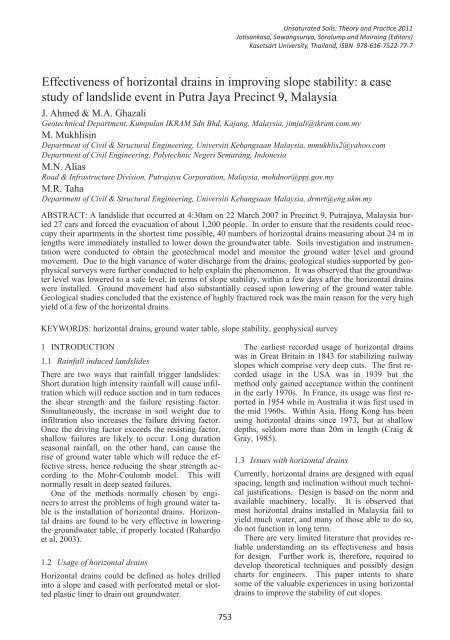
2 FIELD STUDY2.1 Background <strong>of</strong> PutrajayaPutrajaya is a planned city, located 25 km south <strong>of</strong>Kuala Lumpur and 20 km north <strong>of</strong> the KualaLumpur International Airport (KLIA) that serves asthe federal adm<strong>in</strong>istrative centre <strong>of</strong> Malaysia. Thecity sits on 4,931 hectares <strong>of</strong> land with<strong>in</strong> theMultimedia Super Corridor. Its development started<strong>in</strong> 1995 and is targeted to complete by 2015. Oncefully developed, it is estimated to have a population<strong>of</strong> around 320,000 with 64,000 hous<strong>in</strong>g units.2.2 The Putrajaya landslideA landslide occurred at a <strong>slope</strong> adjacent to 3 blocksconta<strong>in</strong><strong>in</strong>g 334 government quarters at Prec<strong>in</strong>ct 9,Putrajaya, at around 4:30am on the 22 nd March2007. The panaromic view <strong>of</strong> the landslide <strong>in</strong> Figure1, reproduced from the report that appeared <strong>in</strong>the New Straits Times on 23 rd March 2001, providesgraphic illustration <strong>of</strong> the landslide, the location <strong>of</strong>the site and an <strong>in</strong>dication <strong>of</strong> the distance from the<strong>slope</strong> to the adjacent apartment build<strong>in</strong>gs.Figure 1. Panaromic view <strong>of</strong> the <strong>slope</strong> failure, (New StraitsTimes, 23 rd March 2007).There was no <strong>in</strong>jury or fatality, but 27 cars were totallyor partially buried by the debris material. Allresidents <strong>of</strong> the 3 blocks, i.e. about 1,200 people,were immediately evacuated. It was therefore crucialto stabilize the affected <strong>slope</strong> prior to allow<strong>in</strong>gthe residents to reoccupy the build<strong>in</strong>gFigure 2. Digital Terra<strong>in</strong> Model (DTM) <strong>of</strong> the landslide area.2.4 Geology <strong>of</strong> the siteFrom the field surface mapp<strong>in</strong>g, the study area isunderla<strong>in</strong> by graphitic quartz mica schist from KajangFormation (see Figure 3). The outcrops whichcould be noted along the cut <strong>slope</strong>s <strong>in</strong> the study areahave experienced <strong>in</strong>tense weather<strong>in</strong>g processes withweather<strong>in</strong>g grade range from Grade III to VI. HoweverGrade II material could still be noted at certa<strong>in</strong>areas. Foliation planes were clearly formed andcould be seen on the cut <strong>slope</strong>s. The orientation isquite consistent, i.e. strik<strong>in</strong>g approximately N-S anddipp<strong>in</strong>g towards W-EW with average dips <strong>of</strong> 35 o to40 o .Study Area2.3 Site description <strong>of</strong> landslide areaThe site is best described by the Digital Terra<strong>in</strong>Model <strong>in</strong> Figure 2. The landslide is located on thewestern face <strong>of</strong> a ridge that has its crest close to theupper edge <strong>of</strong> the slide scarp. A road lead<strong>in</strong>g to a 36million litre water tank lies on this crest. The watertank is partially buried on a part <strong>of</strong> the hill that hasbeen cut to prepare a flat site for it. The distance <strong>of</strong>the tank to the edge <strong>of</strong> the ridge where the slide occurredis about 25m.Kenny HillFormationKajangFormationFigure 3. Geology map <strong>of</strong> study area754
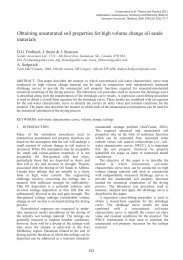
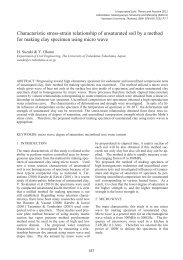
The outcrops (Grade II to IV) are dark grey toblack <strong>in</strong> color with clear foliation planes. For GradeV-VI outcrops, the color is reddish brown to brownishred due to existence <strong>of</strong> laterite which is rich <strong>in</strong>ferrous oxides.The results from petrography <strong>of</strong> the core samplesat depths <strong>of</strong> 9 - 20 m, reveal that the rocks <strong>in</strong> thisarea consists <strong>of</strong> <strong>in</strong>terbeded sandstone, shale and act<strong>in</strong>oliteschist.2.5 Soils <strong>in</strong>vestigation and <strong>in</strong>strumentationThe first soils <strong>in</strong>vestigation and <strong>in</strong>strumentationmonitor<strong>in</strong>g package commenced <strong>in</strong> March and wascompleted <strong>in</strong> April 2007. 17 boreholes were sunkby rotary drill<strong>in</strong>g with foam and water as flush<strong>in</strong>gmedium (see BH1-BH17 <strong>in</strong> Fig. 4). When rock wasencountered, rotary drill<strong>in</strong>g was carried out with diamond-studdedbit to obta<strong>in</strong> rock core.Seven standpipe piezometers were <strong>in</strong>stalled (seeSP1-SP7 <strong>in</strong> Fig. 4) to obta<strong>in</strong> the piezometric waterlevel read<strong>in</strong>gs, so that the performance <strong>of</strong> the dewater<strong>in</strong>gscheme us<strong>in</strong>g <strong>horizontal</strong> <strong>dra<strong>in</strong>s</strong> could bemonitored. The standpipe piezometer, or sometimescalled a Casagrande piezometer, consists <strong>of</strong> a filtertip jo<strong>in</strong>ed to a PVC riser pipe. After the filter tipand riser pipe were <strong>in</strong>stalled <strong>in</strong> the borehole, a sandfilter zone was tremied <strong>in</strong>to place around the filtertip. The top <strong>of</strong> the filter zone is sealed with bentoniteto isolate the pore water pressure at the tip.The riser pipe was term<strong>in</strong>ated above ground levelwith a vented cap. Read<strong>in</strong>gs were manually takenonce to three times a day us<strong>in</strong>g a water level <strong>in</strong>dicator.Five vertical <strong>in</strong>cl<strong>in</strong>ometers were also <strong>in</strong>stalled(see IC1-IC5 <strong>in</strong> Fig. 4) to detect zones <strong>of</strong> movementand determ<strong>in</strong>e whether the <strong>slope</strong> is respond<strong>in</strong>g to theimmediate remedial measures. Incl<strong>in</strong>ometer cas<strong>in</strong>gswere <strong>in</strong>stalled permanently <strong>in</strong> boreholes. A portabletravers<strong>in</strong>g probe and a readout unit were used tomeasure and record the movement at 0.5 m depth <strong>in</strong>terval.2.6 Horizontal <strong>dra<strong>in</strong>s</strong> <strong>in</strong>stallationBased on field data, prelim<strong>in</strong>ary <strong>slope</strong> <strong>stability</strong>analysis were carried out which <strong>in</strong>dicated that theprobable cause <strong>of</strong> failure was a rise <strong>in</strong> ground watertable with<strong>in</strong> the <strong>slope</strong>. As a result, deep <strong>horizontal</strong><strong>dra<strong>in</strong>s</strong> up to 24 m, <strong>in</strong>stead <strong>of</strong> the normal 6-12 mlength <strong>dra<strong>in</strong>s</strong>, were immediately <strong>in</strong>stalled at or nearthe toes <strong>of</strong> the <strong>in</strong>tact <strong>slope</strong>s.A total <strong>of</strong> 40 <strong>horizontal</strong> <strong>dra<strong>in</strong>s</strong> rang<strong>in</strong>g from 8 to24 m <strong>in</strong> lengths were <strong>in</strong>stalled from 28 th March to 1 stApril 2007 (Fig. 5). They were constructed by drill<strong>in</strong>g100 mm diameter holes at an upward <strong>in</strong>cl<strong>in</strong>e <strong>of</strong>about 5 degrees from the base <strong>of</strong> the <strong>slope</strong> and then<strong>in</strong>sert<strong>in</strong>g a 75 mm nom<strong>in</strong>al diameter class D perforatedPVC pipe wrapped <strong>in</strong> geotextile <strong>in</strong>to the drilledholes. The total drill<strong>in</strong>g length was 842 m while thelength <strong>of</strong> pipe <strong>in</strong>stalled was 784 m.Thirty-seven <strong>dra<strong>in</strong>s</strong> were <strong>in</strong>stalled at the toe belowthe lowest berm, while another three were <strong>in</strong>stalledjust above the first berm. Figure 5 shows thelayout <strong>of</strong> the <strong>horizontal</strong> <strong>dra<strong>in</strong>s</strong> <strong>in</strong>stalled. It was, surpris<strong>in</strong>gly,observed that the yield <strong>of</strong> the <strong>dra<strong>in</strong>s</strong>,measured <strong>in</strong> ml/s, greatly varies from one to another.Figure 4. Locations <strong>of</strong> boreholes and <strong>in</strong>strumentationFigure 5. Horizontal <strong>dra<strong>in</strong>s</strong> locations, and resistivity and seismicsurvey l<strong>in</strong>es755
Soon after <strong>in</strong>stallation <strong>in</strong> 2007, all 40 <strong>horizontal</strong><strong>dra<strong>in</strong>s</strong>, except for 2, were able to discharge water.The total discharge rate measured from all <strong>dra<strong>in</strong>s</strong>, atthat time, was 652.19 ml/s. However, 71% <strong>of</strong> theyield comes from 5 <strong>dra<strong>in</strong>s</strong> (listed <strong>in</strong> the Table 1)close to the northern side <strong>of</strong> the failure area. Flowrates measured from the other 35 <strong>dra<strong>in</strong>s</strong> range from0-18.02 ml/s, with 31 <strong>of</strong> the <strong>dra<strong>in</strong>s</strong> yield<strong>in</strong>g less than10 ml/s.These observations concurs with Fernandez-Rubio and S<strong>in</strong>gh (1983) which discovered yield <strong>of</strong><strong>horizontal</strong> <strong>dra<strong>in</strong>s</strong> from dry to very high flow rates,with the maximum discharge located <strong>in</strong> the areas <strong>of</strong>fault zones or <strong>slope</strong> failures.The flow rates measured after 3 years were muchless than immediately after <strong>in</strong>stallation. Only theflow rates from 4 <strong>horizontal</strong> <strong>dra<strong>in</strong>s</strong> were able to bemeasured. The total yield was only 114.56 ml/s,17.5% <strong>of</strong> the yield immediately after <strong>in</strong>stallation.Although the flow rates from <strong>horizontal</strong> <strong>dra<strong>in</strong>s</strong>has much reduced after 3 years, the peizometric waterlevel measured on 8 th March 2011 at BH5/SP2, 4years after the <strong>dra<strong>in</strong>s</strong> were <strong>in</strong>stalled, was 5.25 m,about the same level it used to be, immediately afterthe <strong>in</strong>stallation <strong>of</strong> the <strong>dra<strong>in</strong>s</strong>, <strong>in</strong> April 2007.Five <strong>in</strong>cl<strong>in</strong>ometers were <strong>in</strong>stalled to monitor lateralmovement <strong>of</strong> the <strong>slope</strong>. Except for BH2/IC2which is located at mid height next to the landslide,there is very little movement <strong>of</strong> the rest <strong>of</strong> the <strong>slope</strong>s<strong>in</strong>ce the <strong>in</strong>cl<strong>in</strong>ometers were <strong>in</strong>stalled soon after collapse.Figure 6 plots the maximum movement detectedat 2.5m below the ground surface at this <strong>in</strong>cl<strong>in</strong>ometer.It can be seen that there’s about 8mmmovement dur<strong>in</strong>g the <strong>horizontal</strong> <strong>dra<strong>in</strong>s</strong> <strong>in</strong>stallationworks, after which the <strong>in</strong>cl<strong>in</strong>ometer cease to showany.The above observations suggested that <strong>horizontal</strong><strong>dra<strong>in</strong>s</strong> is an effective method to lower down groundwater table and improv<strong>in</strong>g <strong>slope</strong> <strong>stability</strong> <strong>in</strong> the shortand medium term. Further studies are, however, requiredto determ<strong>in</strong>e its effectiveness <strong>in</strong> the longterm.3.2 Results from geophysical surveysThe topography model for the seismic l<strong>in</strong>e S1 issimplified <strong>in</strong> Figure 7. Three seismic boundarieswere detected. The first topmost layer is characterizedby the lowest p-wave velocity with values rang<strong>in</strong>gfrom 260 m/s to a maximum value <strong>of</strong> about 500m/s. These values represent the range <strong>of</strong> seismic velocities<strong>of</strong> the <strong>in</strong>homogeneous near surface soil materials.The second layer is particularly exhibit<strong>in</strong>g lowervelocities <strong>of</strong> 650 to 1300 m/s. On the basis <strong>of</strong> theirreflection configurations, this layer could beassociated with highly weathered rock materials orstiff/hard sediment.The third layer is <strong>in</strong>terpreted as the less weatheredrock mass. The computed seismic velocities rangefrom 1926 to 4350 m/s. Theoretically, the low value<strong>of</strong> seismic velocity is associated with highlyweathered bedrock, whereas the higher valuerepresents relatively less weathered bedrock. Hence,the third seismic unit could be <strong>in</strong>terpreted as highlyand less weathered fresh Schist.Figure 7. Seismic survey result for l<strong>in</strong>e S1Figure 8 shows the 200 m resistivity measurementswith 5 m electrode spac<strong>in</strong>g <strong>of</strong> survey l<strong>in</strong>e R1 (Fig.5). The top layer <strong>of</strong> the pseudo section is <strong>in</strong>terpretedas a dry layer <strong>of</strong> silt and clay with low resistivity <strong>in</strong>the range <strong>of</strong> 10 to 1,000 Ωm. The relatively high resistivity<strong>in</strong> the range <strong>of</strong> 5,000-30,000 Ωm observed<strong>in</strong> second layer comprises <strong>of</strong> slightly weathered t<strong>of</strong>resh schist. Rock Quality Designation (RQD) <strong>of</strong>70%-90% at a depth <strong>of</strong> 11.5m from BH1 substantiatesthis.Figure 8. Resistivity survey result for l<strong>in</strong>e R1757