Obtaining unsaturated soil properties for high volume change oil ...
Obtaining unsaturated soil properties for high volume change oil ...
Obtaining unsaturated soil properties for high volume change oil ...
- No tags were found...

Create successful ePaper yourself
Turn your PDF publications into a flip-book with our unique Google optimized e-Paper software.
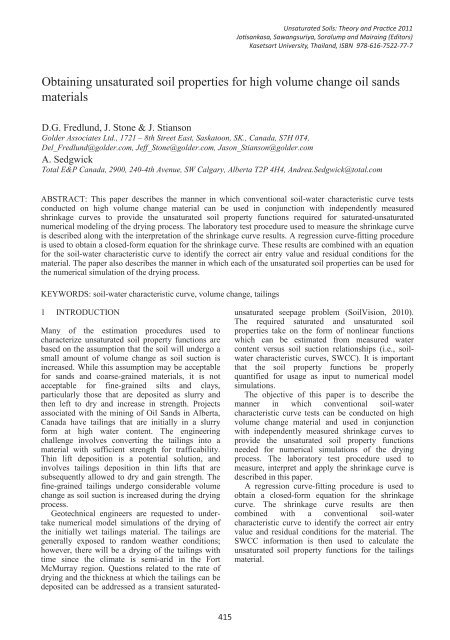
Unsaturated S<strong>oil</strong>s: Theory and Practice 2011Jotisankasa, Sawangsuriya, Soralump and Mairaing (Editors)Kasetsart University, Thailand, ISBN 978-616-7522-77-7<strong>Obtaining</strong> Unsaturated S<strong>oil</strong> Properties <strong>for</strong> High Volume Change OilSands Materials<strong>Obtaining</strong> <strong>unsaturated</strong> <strong>s<strong>oil</strong></strong> <strong>properties</strong> <strong>for</strong> <strong>high</strong> <strong>volume</strong> <strong>change</strong> <strong>oil</strong> sandsDelwyn materials G. Fredlund, Jeff Stone and Jason StiansonGolder Associates Ltd., 1721 – 8th Street East, Saskatoon, SK., Canada, S7H 0T4,Del_Fredlund@golder.com, Jeff_Stone@golder.com, Jason_Stianson@golder.comAndrea D.G. Fredlund, Sedgwick J. Stone & J. StiansonTotal Golder E&P Associates Canada, Ltd., 2900, 1721 240-4th – 8th Street Avenue, East, SW Saskatoon, Calgary, SK., Alberta Canada, T2P 4H4, S7H 0T4, Andrea.Sedgwick@total.comDel_Fredlund@golder.com, Jeff_Stone@golder.com, Jason_Stianson@golder.comA. SedgwickTotal E&P Canada, 2900, 240-4th Avenue, SW Calgary, Alberta T2P 4H4, Andrea.Sedgwick@total.comABSTRACT: This paper describes the manner in which conventional <strong>s<strong>oil</strong></strong>-water characteristic curve testsconducted on <strong>high</strong> <strong>volume</strong> <strong>change</strong> material can be used in conjunction with independently measuredshrinkage curves to provide the <strong>unsaturated</strong> <strong>s<strong>oil</strong></strong> property functions required <strong>for</strong> saturated-<strong>unsaturated</strong>numerical modeling of the drying process. The laboratory test procedure used to measure the shrinkage curveis described along with the interpretation of the shrinkage curve results. A regression curve-fitting procedureis used to obtain a closed-<strong>for</strong>m equation <strong>for</strong> the shrinkage curve. These results are combined with an equation<strong>for</strong> the <strong>s<strong>oil</strong></strong>-water characteristic curve to identify the correct air entry value and residual conditions <strong>for</strong> thematerial. The paper also describes the manner in which each of the <strong>unsaturated</strong> <strong>s<strong>oil</strong></strong> <strong>properties</strong> can be used <strong>for</strong>the numerical simulation of the drying process.KEYWORDS: <strong>s<strong>oil</strong></strong>-water characteristic curve, <strong>volume</strong> <strong>change</strong>, tailings1 INTRODUCTIONMany of the estimation procedures used tocharacterize <strong>unsaturated</strong> <strong>s<strong>oil</strong></strong> property functions arebased on the assumption that the <strong>s<strong>oil</strong></strong> will undergo asmall amount of <strong>volume</strong> <strong>change</strong> as <strong>s<strong>oil</strong></strong> suction isincreased. While this assumption may be acceptable<strong>for</strong> sands and coarse-grained materials, it is notacceptable <strong>for</strong> fine-grained silts and clays,particularly those that are deposited as slurry andthen left to dry and increase in strength. Projectsassociated with the mining of Oil Sands in Alberta,Canada have tailings that are initially in a slurry<strong>for</strong>m at <strong>high</strong> water content. The engineeringchallenge involves converting the tailings into amaterial with sufficient strength <strong>for</strong> trafficability.Thin lift deposition is a potential solution, andinvolves tailings deposition in thin lifts that aresubsequently allowed to dry and gain strength. Thefine-grained tailings undergo considerable <strong>volume</strong><strong>change</strong> as <strong>s<strong>oil</strong></strong> suction is increased during the dryingprocess.Geotechnical engineers are requested to undertakenumerical model simulations of the drying ofthe initially wet tailings material. The tailings aregenerally exposed to random weather conditions;however, there will be a drying of the tailings withtime since the climate is semi-arid in the FortMcMurray region. Questions related to the rate ofdrying and the thickness at which the tailings can bedeposited can be addressed as a transient saturated<strong>unsaturated</strong>seepage problem (S<strong>oil</strong>Vision, 2010).The required saturated and <strong>unsaturated</strong> <strong>s<strong>oil</strong></strong><strong>properties</strong> take on the <strong>for</strong>m of nonlinear functionswhich can be estimated from measured watercontent versus <strong>s<strong>oil</strong></strong> suction relationships (i.e., <strong>s<strong>oil</strong></strong>watercharacteristic curves, SWCC). It is importantthat the <strong>s<strong>oil</strong></strong> property functions be properlyquantified <strong>for</strong> usage as input to numerical modelsimulations.The objective of this paper is to describe themanner in which conventional <strong>s<strong>oil</strong></strong>-watercharacteristic curve tests can be conducted on <strong>high</strong><strong>volume</strong> <strong>change</strong> material and used in conjunctionwith independently measured shrinkage curves toprovide the <strong>unsaturated</strong> <strong>s<strong>oil</strong></strong> property functionsneeded <strong>for</strong> numerical simulations of the dryingprocess. The laboratory test procedure used tomeasure, interpret and apply the shrinkage curve isdescribed in this paper.A regression curve-fitting procedure is used toobtain a closed-<strong>for</strong>m equation <strong>for</strong> the shrinkagecurve. The shrinkage curve results are thencombined with a conventional <strong>s<strong>oil</strong></strong>-watercharacteristic curve to identify the correct air entryvalue and residual conditions <strong>for</strong> the material. TheSWCC in<strong>for</strong>mation is then used to calculate the<strong>unsaturated</strong> <strong>s<strong>oil</strong></strong> property functions <strong>for</strong> the tailingsmaterial.415
2 ROLE OF THE SOIL-WATERCHARACTERISTIC CURVE, SWCCThe SWCC shows the relationship between theamount of water in a <strong>s<strong>oil</strong></strong> and various applied <strong>s<strong>oil</strong></strong>suctions (Fredlund and Rahardjo, 1993). There aretwo primary reference points on the SWCC; namely,the air-entry value and the residual suction. Theapparent air-entry value <strong>for</strong> a <strong>s<strong>oil</strong></strong> is dependent onhow the amount of water in the <strong>s<strong>oil</strong></strong> is quantified.When a <strong>s<strong>oil</strong></strong> undergoes <strong>volume</strong> <strong>change</strong> as <strong>s<strong>oil</strong></strong>suction is increased, the air-entry value appears tooccur at different values. The differing air-entryvalues are related to how the amount of water in the<strong>s<strong>oil</strong></strong> is defined. Each variable to designate theamount of water in the <strong>s<strong>oil</strong></strong> has significance but it isimportant that the correct interpretations be appliedat various stages of the analysis (Fredlund, 2002).The variables used to quantify the amount ofwater in the <strong>s<strong>oil</strong></strong> are:i) gravimetric water content, w;ii) <strong>volume</strong>tric water content, θ; with theinstantaneous total <strong>volume</strong> used in calculating<strong>volume</strong>tric water content;iii) <strong>volume</strong>tric water content, θ, with the <strong>volume</strong> ofwater, V w , referenced to original total <strong>volume</strong> ofthe specimen, V o , (i.e., V w / V o ); andiv) degree of saturation, S.Each of the above designation <strong>for</strong> the amount ofwater in the <strong>s<strong>oil</strong></strong> can be used to plot a <strong>s<strong>oil</strong></strong>-watercharacteristic curve. Each of the SWCCs wouldprovide similar in<strong>for</strong>mation to the geotechnicalengineer provided the <strong>s<strong>oil</strong></strong> does not undergo <strong>volume</strong><strong>change</strong> as <strong>s<strong>oil</strong></strong> suction is increased. However, whenthe <strong>s<strong>oil</strong></strong> undergoes <strong>volume</strong> <strong>change</strong>, as is the caseunder consideration, then the geotechnical engineermust be able to plot each of the SWCCs and use theappropriate curves in the proper manner <strong>for</strong>evaluating <strong>unsaturated</strong> <strong>s<strong>oil</strong></strong> property functions to beused in per<strong>for</strong>ming numerical simulations ofphysical processes.Gravimetric water content is the most basicmeasurement of the amount of water in a <strong>s<strong>oil</strong></strong>because it requires only the measurement of mass.Volumetric water content, θ, has commonly beenused in agriculture-related disciplines and is definedas the amount of water in the <strong>s<strong>oil</strong></strong> referenced to theinstantaneous total <strong>volume</strong> of the <strong>s<strong>oil</strong></strong> specimen. Thetotal <strong>volume</strong> of the <strong>s<strong>oil</strong></strong> specimen must be knownwhen computing the <strong>volume</strong>tric water content in thismanner. There<strong>for</strong>e, it is necessary to know the total<strong>volume</strong> of the <strong>s<strong>oil</strong></strong> specimen corresponding toequilibrium <strong>s<strong>oil</strong></strong> suction conditions. When modelingwater seepage through a <strong>s<strong>oil</strong></strong>, it is the <strong>change</strong> in<strong>volume</strong>tric water content that defines the <strong>change</strong> inwater storage in the <strong>s<strong>oil</strong></strong> as suction <strong>change</strong>s.However, there are two possible ways to compute<strong>volume</strong>tric water content. If the overall <strong>volume</strong> ofthe <strong>s<strong>oil</strong></strong> <strong>change</strong>s by a small amount during theincrease in <strong>s<strong>oil</strong></strong> suction, then either designation of<strong>volume</strong>tric water content can be used. However, ifthe <strong>volume</strong> <strong>change</strong>s are substantial, then theinstantaneous total <strong>volume</strong> should be used <strong>for</strong> thecalculation of the water storage function.The degree of saturation, S, references the<strong>volume</strong> of water in the <strong>s<strong>oil</strong></strong> to the instantaneous<strong>volume</strong> of voids and there<strong>for</strong>e also requires the total<strong>volume</strong> of the specimen. When a <strong>s<strong>oil</strong></strong> undergoes<strong>volume</strong> <strong>change</strong> as <strong>s<strong>oil</strong></strong> suction increases, then the airentryvalue and residual conditions need to beevaluated from the plot of degree of saturationversus <strong>s<strong>oil</strong></strong> suction. In addition, it is the degree ofsaturation versus <strong>s<strong>oil</strong></strong> suction plot that must be usedduring the integration process to calculate thepermeability function. The permeability functionmay also need to be computed in a different mannerto accommodate <strong>change</strong>s in void ratio prior toreaching the air-entry value of the <strong>s<strong>oil</strong></strong>.It is important to note that the <strong>unsaturated</strong> <strong>s<strong>oil</strong></strong>property functions need to be computed in distinctlydifferent manners when the <strong>s<strong>oil</strong></strong> undergoessubstantial <strong>volume</strong> <strong>change</strong> as <strong>s<strong>oil</strong></strong> suction increases.It is the instantaneous <strong>volume</strong>tric water contentdesignation that must be used to compute waterstorage and the degree of saturation designation thatmust be used to define the air-entry value of the <strong>s<strong>oil</strong></strong>.The degree of saturation designation plays the majorrole involved in estimating the <strong>unsaturated</strong> hydraulicconductivity function of the <strong>s<strong>oil</strong></strong>.The <strong>s<strong>oil</strong></strong>s of primary concern in this paper are the<strong>high</strong> water content tailings that are a by-productfrom Oil Sands extraction. These materials may startwith a natural water content that is well above theliquid limit of the material and undergo a large<strong>volume</strong> <strong>change</strong> upon drying.The difficulties associated with the testing of<strong>s<strong>oil</strong></strong>s that undergo large <strong>volume</strong> <strong>change</strong>s withincreasing <strong>s<strong>oil</strong></strong> suctions are not a recent discovery.Fredlund (1964) showed that shrinkage curvemeasurements needed to be used in conjunction witha conventional measurement of the SWCC in orderto properly interpret the <strong>unsaturated</strong> <strong>s<strong>oil</strong></strong> behaviourof <strong>high</strong> <strong>volume</strong> <strong>change</strong> <strong>s<strong>oil</strong></strong>s. Fredlund (loc. cit.)per<strong>for</strong>med a series of tests on <strong>high</strong>ly plastic Reginaclay that had a liquid limit of 75, a plastic limit of25, and had 50% clay size particles.3 SHRINKAGE LIMIT AND THE SHRINKAGECURVEThe shrinkage limit of a <strong>s<strong>oil</strong></strong> has been one of theclassification <strong>properties</strong> since the inception of <strong>s<strong>oil</strong></strong>mechanics (ASTM D427). Mercury immersion wasoriginally used <strong>for</strong> the measurement of the <strong>volume</strong>416
of the <strong>s<strong>oil</strong></strong> specimen. This technique is no longerconsidered acceptable in most countries.The shrinkage limit is defined as the watercontent corresponding to the minimum <strong>volume</strong> that a<strong>s<strong>oil</strong></strong> can attain upon drying to zero water content. Itis a fictitious water content that generally fallsslightly below the plastic limit of the <strong>s<strong>oil</strong></strong>.It is the entire shrinkage curve from an initiallysaturated <strong>s<strong>oil</strong></strong> condition to completely dry conditionsthat is called the shrinkage curve and is significant<strong>for</strong> the interpretation of SWCC data. Figure 1 showsthe drying curve <strong>for</strong> an initially saturated <strong>s<strong>oil</strong></strong>. As aclay <strong>s<strong>oil</strong></strong> dries, a point is reached where the <strong>s<strong>oil</strong></strong>starts to desaturate. This point is generally quiteclose to the plastic limit of the <strong>s<strong>oil</strong></strong>. Consequently,there is an approximate correlation between theplastic limit of a <strong>s<strong>oil</strong></strong> and its air-entry value. Uponfurther drying, another point is reached where the<strong>s<strong>oil</strong></strong> dries without any further <strong>change</strong> in overall<strong>volume</strong>. This can be referred to as the true“shrinkage limit” of the <strong>s<strong>oil</strong></strong> and the gravimetricwater content appears to approximately correlatewith the residual <strong>s<strong>oil</strong></strong> conditions.Void Ratio3.02.52.01.51.00.50.0ResidualWater ContentPlasticLimitShrinkage LimitLiquid LimitSaturation Line0% 20% 40% 60% 80% 100%Gravimetric Water ContentFigure 1. Shrinkage curve with its relationship to the AtterbergLimit classification <strong>properties</strong>.3.1 Measurement of the shrinkage curveAn experimental procedure was developed <strong>for</strong> themeasurement of the entire shrinkage curve frominitial <strong>high</strong> water content conditions to completelydry conditions. A digital micrometer was used <strong>for</strong>the measurement of the <strong>volume</strong> at various stages ofdrying as shown in Figure 2. Brass rings weremachined to contain the <strong>s<strong>oil</strong></strong> specimens (i.e., therings have no bottom). The rings with the <strong>s<strong>oil</strong></strong> wereplaced onto wax paper and drying was allowed. Thedimensions of the <strong>s<strong>oil</strong></strong> specimens were selected suchthat cracking of the <strong>s<strong>oil</strong></strong> was unlikely to occur duringthe drying process. The initial dimensions selected<strong>for</strong> the shrinkage curve specimens were a diameterof 3.7 cm and a thickness of 1.2 cm.Figure 2. Digital micrometer <strong>for</strong> the measurement of thediameter and thickness of shrinkage specimens.The mass and <strong>volume</strong> of each <strong>s<strong>oil</strong></strong> specimen weremeasured on a daily basis. Four to six measurementsof the diameter and thickness of the specimen weremade at differing locations on the specimens. Figure3 shows typical measurements of water content andvoid ratio as the <strong>s<strong>oil</strong></strong> dried. It was observed that asthe specimen diameter began to decrease, with thespecimen pulling away from the brass ring, the rateof evaporation increased significantly (i.e., abouttwice as fast).The increase in the evaporation rate was relatedto the increased surface area from which evaporationwas occurring. Consequently, it is recommendedthat the measurements of mass and <strong>volume</strong> shouldbe increased to once every two to three hours oncethe <strong>s<strong>oil</strong></strong> shows signs of pulling away from the sidesof the ring.Void Ratio2.52.01.51.00.50.0Plastic LimitLiquid Limit0% 10% 20% 30% 40% 50% 60% 70% 80% 90% 100%Gravimetric Water ContentBox #11 - S1Box #11 - S2Box #6 - S1Box #6 - S2Aged TT - S1Aged TT - S2Aged TT - S3100% SaturationBest FitFigure 3. Typical shrinkage curve <strong>for</strong> an <strong>oil</strong> sand clay <strong>s<strong>oil</strong></strong>.3.2 Equation <strong>for</strong> the Shrinkage CurveThe shrinkage curve has the <strong>for</strong>m of a hyperboliccurve. Fredlund et al. (1997, 2002) proposed anequation to best-fit data <strong>for</strong> the shrinkage curve. Theequation has parameters with physical meaning andis of the following <strong>for</strong>m:417
⎛ 1 ⎞⎜ ⎟⎝ csh⎠c⎡ shw ⎤e( w)= ash⎢ + 1c ⎥(1)sh⎣bsh⎦where: a sh = the minimum void ratio (e min ), b sh =slope of the line of tangency, (e.g., drying fromsaturated conditions), c sh = curvature of the shrinkagecurve, and w = gravimetric water content. Theratio,ash Gs= (2)b Sshis a constant <strong>for</strong> a specific <strong>s<strong>oil</strong></strong>; G s is the specificgravity and S is the degree of saturation.Once the minimum void ratio of the <strong>s<strong>oil</strong></strong> isknown, it is possible to estimate the remainingparameters required <strong>for</strong> the designation of theshrinkage curve. The minimum void ratio the <strong>s<strong>oil</strong></strong>can attain is defined by the variable, a sh . The c shparameter provides the remaining shape of theshrinkage curve. The curvature of the shrinkagecurve is controlled by varying the c sh parameter.3.3 Integration of the Shrinkage Curve and thelaboratory measured SWCCA laboratory measured SWCC describes therelationship between gravimetric water content and<strong>s<strong>oil</strong></strong> suction. The Fredlund and Xing (1994) equation(Equation 3) can be used to best-fit the SWCCwhich can then be combined with the shrinkagecurve.⎡⎤⎡ ⎛ ψ ⎞ ⎤ ⎢ ⎥⎢ ln ⎜1+⎟ ⎥ ⎢⎥hr⎢ 1 ⎥w( ψ ) = w ⎢s1− ⎝ ⎠ ⎥6m⎢f⎛ 10 ⎞ ⎥ ⎢ ⎥n fln 1⎡ ⎡ψ⎤⎤⎢ ⎜ + ⎟ ⎥ ⎢⎛ ⎞ ⎥⎢ h ⎢ln ⎢exp(1)⎥⎥⎣ ⎝+r ⎠ ⎥⎦ ⎢⎜ ⎥a ⎟⎢ ⎢ ⎢⎥f ⎥⎣ ⎣ ⎝ ⎠ ⎦⎦⎥⎣⎦(3)where: w(ψ) = gravimetric water content at anyspecified suction, ψ; w s = saturated gravimetricwater content; h r = residual <strong>s<strong>oil</strong></strong> suction; a f , n f , and m f= the fitting parameters <strong>for</strong> the Fredlund and Xing(1994) SWCC equation. Equation 3 is written <strong>for</strong> thegravimetric water content designation; however, itshould be noted that it can be best-fit to any of thedesignations of water content versus <strong>s<strong>oil</strong></strong> suctionbecause of the flexibility of the equation with threefitting <strong>s<strong>oil</strong></strong> parameters.It is possible to compute the degree of saturationversus <strong>s<strong>oil</strong></strong> suction as well as any other designation<strong>for</strong> the amount of water in the <strong>s<strong>oil</strong></strong> by combiningEquations 1 and 3.4 MEASUREMENT AND INTERPRETATIONOF OIL SANDS TAILINGS RESULTSS<strong>oil</strong>-water characteristic curves were measured onsamples of Oil Sands tailings that were thickenedusing a pilot deep cone thickener. The tailings werecomprised of fines (< 44 microns) and 10% and 45%greater than 44 microns sand (i.e., 0.1 and 0.8 sandto fines ratios, SFR, respectively). The tailings werefrom development studies on Oil Sands tailings fromnorthern Alberta, Canada. The shrinkage curveresults were presented in Figure 3. The 0.1 SFRtailings have plastic and liquid limits of 30 and 55,respectively. The 0.8 SFR tailings have plastic andliquid limits of 15 and 38, respectively.Approximately 60% of the material classifies as claysize particles. The slurry material has a gravimetricwater content of about 100%. The intent is to depositthe thickened tailings material in lifts of varyingthicknesses that are allowed to dry.As water is removed from the thickened finetailings, the <strong>volume</strong> of the material decreases andthere is a slow increase in shear strength. As thematerial begins to desaturate near the plastic limitthere is a substantial increase in shear strength.Figure 4 shows the gravimetric water content, w,plotted versus <strong>s<strong>oil</strong></strong> suction <strong>for</strong> two samples testedwith each of the sand to fines ratios (SFR). Box #11had a SFR of 0.8 and a starting gravimetric watercontent of about 70%. Box #6 was the samematerial; however, it was dried to about 25% be<strong>for</strong>ethe SWCC test was per<strong>for</strong>med. Box #2 had a SFR of0.1 and the initial gravimetric water content wasnear 70%. Box #5 was the same material; however,it was dried to about 47% be<strong>for</strong>e the SWCC wasper<strong>for</strong>med.The initially wet samples show a break in thecurvature in the region around 1 kPa. The driedsamples show a break in the curvature around10 kPa. However, the curvature is not distinct and itshould not be taken to represent an air-entry value<strong>for</strong> the material.It is necessary to use the shrinkage curve resultswhen interpreting the meaning of the SWCC results.A best-fit shrinkage curve equation can be combinedwith the Fredlund and Xing (1994) equation <strong>for</strong> theSWCC. It is then possible to plot the degree ofsaturation, S, versus <strong>s<strong>oil</strong></strong> suction as shown in Figure5.The results show that there is a distinct air-entryvalue <strong>for</strong> the 0.8 SFR material at about 100 kPa. Theair-entry value <strong>for</strong> the 0.1 SFR material is about1,000 kPa. These are the true air-entry values <strong>for</strong>these two materials and the degree of saturationSWCCs are the curves that must be used <strong>for</strong> theestimation of the <strong>unsaturated</strong> hydraulic conductivityfunction. The residual condition can also be clearlyidentified as having a residual suction of about3,000 kPa and a residual degree of saturation of 20%<strong>for</strong> the 0.8 SFR tailings. The 0.1 SFR tailings have aresidual suction of about 15,000 kPa and a residualdegree of saturation of about 20%.418
Water Content100%90%80%70%60%50%40%30%20%10%0%GravimetricVolumetric (instantaneous)Volumetric (based on Vo)Degree of SaturationFitted curves0.01 0.1 1 10 100 1000 10000 100000 1000000Suction (kPa)Figure 8. Gravimetric water content, <strong>volume</strong>tric water content(based on both instantaneous and initial <strong>volume</strong>s) and degree ofsaturation versus <strong>s<strong>oil</strong></strong> suction <strong>for</strong> Box #5 tailings.100%90%80%70%60%50%40%30%20%10%0%Degree of Saturation5 CONCLUSIONSThe results clearly show that it is imperative tomeasure the shrinkage curve when testing <strong>high</strong><strong>volume</strong> <strong>change</strong> <strong>s<strong>oil</strong></strong>s <strong>for</strong> their <strong>unsaturated</strong> <strong>s<strong>oil</strong></strong>property functions. It is also necessary to combinethe shrinkage curve and the gravimetric watercontent SWCCs in order to calculate all of the<strong>volume</strong>-mass <strong>properties</strong> versus <strong>s<strong>oil</strong></strong> suction. The(instantaneous) <strong>volume</strong>tric water content SWCC isnecessary <strong>for</strong> computing the water storagecharacteristics of the thickened Oil Sands tailings.The degree of saturation SWCC is necessary <strong>for</strong>obtaining the correct physical features of the SWCC(i.e., air-entry value and residual conditions), and thesubsequent <strong>unsaturated</strong> permeability function <strong>for</strong> thethickened Oil Sands tailings.Water Content100%90%80%70%60%50%40%30%20%10%0%0.01 0.1 1 10 100 1000 10000 100000 1000000Suction (kPa)GravimetricVolumetric (instantaneous)Volumetric (based on Vo)Degree of SaturationFitted curvesFigure 9. Gravimetric water content, <strong>volume</strong>tric water content(based on both instantaneous and initial <strong>volume</strong>s) and degree ofsaturation versus <strong>s<strong>oil</strong></strong> suction <strong>for</strong> Box #11 tailings.Void Ratio2.01.81.61.41.21.00.80.60.40.20.0100%0.01 0.1 1 10 100 1000 10000 100000 1000000Suction (kPa)Box #11Box #6Box #2Box #5Box #11 fitBox #6 fitBox #2 fitBox #5 fit90%80%70%60%50%40%30%20%10%0%Degree of SaturationREFERENCESASTM – D427, 1988 Annual Book of ASTM Standards, Vol.4.08, S<strong>oil</strong> and Rock, Building Stones; Geotextiles.Fredlund, D. G., 1964. Comparison of <strong>s<strong>oil</strong></strong> suction and onedimensionalconsolidation characteristics of a <strong>high</strong>ly plasticclay. National Research Council of Canada, Division ofBuilding Research, Technical Report No. 245, Ottawa,Ontario, Canada.Fredlund, D.G. 2002. Use of <strong>s<strong>oil</strong></strong>-water characteristic curve inthe implementation of <strong>unsaturated</strong> <strong>s<strong>oil</strong></strong> mechanics. UNSAT2002, Proceedings of the Third International Conferenceon Unsaturated S<strong>oil</strong>s, Recife, Brazil, March 10-13, pp. 887-904.Fredlund, M.D., Wilson, G.W., and Fredlund, D.G. 2002.Representation and estimation of the shrinkage curve.UNSAT 2002, Proceedings of the Third InternationalConference on Unsaturated S<strong>oil</strong>s, Recife, Brazil, March 10-13, pp. 145-149.Fredlund, D. G., and Rahardjo, H. 1993. S<strong>oil</strong> mechanics <strong>for</strong><strong>unsaturated</strong> <strong>s<strong>oil</strong></strong>s. New York: John Wiley & Sons.Fredlund, M. D., Fredlund, D. G. and Wilson, G. W., 1997.Prediction of the <strong>s<strong>oil</strong></strong>-water characteristic curve from grainsize distribution and <strong>volume</strong>-mass <strong>properties</strong>. InProceedings of the Third Brazilian Symposium onUnsaturated S<strong>oil</strong>s, NONSAT ’97, Rio de Janeiro, Brazil,April 22-25, 1: 13-23.Fredlund, D. G. and Xing, A. 1994. Equations <strong>for</strong> the <strong>s<strong>oil</strong></strong>watercharacteristic curve. Canadian Geotechnical Journal,31(3): 521-532.Lambe, T. W. 1951. S<strong>oil</strong> Testing <strong>for</strong> Engineers. New York:John Wiley and Sons.S<strong>oil</strong>Vision Systems (2010), User’s Manual <strong>for</strong> SVFlux,Saturated-Unsaturated Numerical Modeling. Saskatoon,Canada.Figure 10. Void ratio versus <strong>s<strong>oil</strong></strong> suction plot <strong>for</strong> the Oil Sandstailings.420