Obtaining unsaturated soil properties for high volume change oil ...
Obtaining unsaturated soil properties for high volume change oil ...
Obtaining unsaturated soil properties for high volume change oil ...
- No tags were found...

Create successful ePaper yourself
Turn your PDF publications into a flip-book with our unique Google optimized e-Paper software.
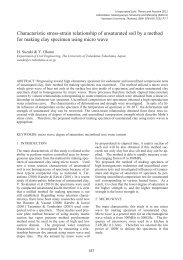
⎛ 1 ⎞⎜ ⎟⎝ csh⎠c⎡ shw ⎤e( w)= ash⎢ + 1c ⎥(1)sh⎣bsh⎦where: a sh = the minimum void ratio (e min ), b sh =slope of the line of tangency, (e.g., drying fromsaturated conditions), c sh = curvature of the shrinkagecurve, and w = gravimetric water content. Theratio,ash Gs= (2)b Sshis a constant <strong>for</strong> a specific <strong>s<strong>oil</strong></strong>; G s is the specificgravity and S is the degree of saturation.Once the minimum void ratio of the <strong>s<strong>oil</strong></strong> isknown, it is possible to estimate the remainingparameters required <strong>for</strong> the designation of theshrinkage curve. The minimum void ratio the <strong>s<strong>oil</strong></strong>can attain is defined by the variable, a sh . The c shparameter provides the remaining shape of theshrinkage curve. The curvature of the shrinkagecurve is controlled by varying the c sh parameter.3.3 Integration of the Shrinkage Curve and thelaboratory measured SWCCA laboratory measured SWCC describes therelationship between gravimetric water content and<strong>s<strong>oil</strong></strong> suction. The Fredlund and Xing (1994) equation(Equation 3) can be used to best-fit the SWCCwhich can then be combined with the shrinkagecurve.⎡⎤⎡ ⎛ ψ ⎞ ⎤ ⎢ ⎥⎢ ln ⎜1+⎟ ⎥ ⎢⎥hr⎢ 1 ⎥w( ψ ) = w ⎢s1− ⎝ ⎠ ⎥6m⎢f⎛ 10 ⎞ ⎥ ⎢ ⎥n fln 1⎡ ⎡ψ⎤⎤⎢ ⎜ + ⎟ ⎥ ⎢⎛ ⎞ ⎥⎢ h ⎢ln ⎢exp(1)⎥⎥⎣ ⎝+r ⎠ ⎥⎦ ⎢⎜ ⎥a ⎟⎢ ⎢ ⎢⎥f ⎥⎣ ⎣ ⎝ ⎠ ⎦⎦⎥⎣⎦(3)where: w(ψ) = gravimetric water content at anyspecified suction, ψ; w s = saturated gravimetricwater content; h r = residual <strong>s<strong>oil</strong></strong> suction; a f , n f , and m f= the fitting parameters <strong>for</strong> the Fredlund and Xing(1994) SWCC equation. Equation 3 is written <strong>for</strong> thegravimetric water content designation; however, itshould be noted that it can be best-fit to any of thedesignations of water content versus <strong>s<strong>oil</strong></strong> suctionbecause of the flexibility of the equation with threefitting <strong>s<strong>oil</strong></strong> parameters.It is possible to compute the degree of saturationversus <strong>s<strong>oil</strong></strong> suction as well as any other designation<strong>for</strong> the amount of water in the <strong>s<strong>oil</strong></strong> by combiningEquations 1 and 3.4 MEASUREMENT AND INTERPRETATIONOF OIL SANDS TAILINGS RESULTSS<strong>oil</strong>-water characteristic curves were measured onsamples of Oil Sands tailings that were thickenedusing a pilot deep cone thickener. The tailings werecomprised of fines (< 44 microns) and 10% and 45%greater than 44 microns sand (i.e., 0.1 and 0.8 sandto fines ratios, SFR, respectively). The tailings werefrom development studies on Oil Sands tailings fromnorthern Alberta, Canada. The shrinkage curveresults were presented in Figure 3. The 0.1 SFRtailings have plastic and liquid limits of 30 and 55,respectively. The 0.8 SFR tailings have plastic andliquid limits of 15 and 38, respectively.Approximately 60% of the material classifies as claysize particles. The slurry material has a gravimetricwater content of about 100%. The intent is to depositthe thickened tailings material in lifts of varyingthicknesses that are allowed to dry.As water is removed from the thickened finetailings, the <strong>volume</strong> of the material decreases andthere is a slow increase in shear strength. As thematerial begins to desaturate near the plastic limitthere is a substantial increase in shear strength.Figure 4 shows the gravimetric water content, w,plotted versus <strong>s<strong>oil</strong></strong> suction <strong>for</strong> two samples testedwith each of the sand to fines ratios (SFR). Box #11had a SFR of 0.8 and a starting gravimetric watercontent of about 70%. Box #6 was the samematerial; however, it was dried to about 25% be<strong>for</strong>ethe SWCC test was per<strong>for</strong>med. Box #2 had a SFR of0.1 and the initial gravimetric water content wasnear 70%. Box #5 was the same material; however,it was dried to about 47% be<strong>for</strong>e the SWCC wasper<strong>for</strong>med.The initially wet samples show a break in thecurvature in the region around 1 kPa. The driedsamples show a break in the curvature around10 kPa. However, the curvature is not distinct and itshould not be taken to represent an air-entry value<strong>for</strong> the material.It is necessary to use the shrinkage curve resultswhen interpreting the meaning of the SWCC results.A best-fit shrinkage curve equation can be combinedwith the Fredlund and Xing (1994) equation <strong>for</strong> theSWCC. It is then possible to plot the degree ofsaturation, S, versus <strong>s<strong>oil</strong></strong> suction as shown in Figure5.The results show that there is a distinct air-entryvalue <strong>for</strong> the 0.8 SFR material at about 100 kPa. Theair-entry value <strong>for</strong> the 0.1 SFR material is about1,000 kPa. These are the true air-entry values <strong>for</strong>these two materials and the degree of saturationSWCCs are the curves that must be used <strong>for</strong> theestimation of the <strong>unsaturated</strong> hydraulic conductivityfunction. The residual condition can also be clearlyidentified as having a residual suction of about3,000 kPa and a residual degree of saturation of 20%<strong>for</strong> the 0.8 SFR tailings. The 0.1 SFR tailings have aresidual suction of about 15,000 kPa and a residualdegree of saturation of about 20%.418