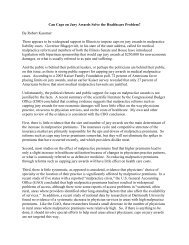
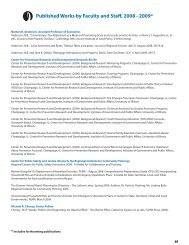
The Illinois Report 20112 Lutz, Byron F., “TheConnectionBetween HousePrice Appreciation<strong>and</strong> <strong>Property</strong> TaxRevenues,” NationalTax Journal 61(2008), 555-572.2Illinois fared over the last decade? Figure 2compares annual average house pricechanges for the first quarter <strong>of</strong> 2003 to thefirst quarter <strong>of</strong> 2007 <strong>and</strong> from 2007:1 to2010:2 across all <strong>of</strong> Illinois’ metropolitanareas, along with non-metro Illinois <strong>and</strong>the nation. Chicago <strong>and</strong> Lake County hadvery high growth followed by sharpdeclines. Danville, Kankakee, <strong>and</strong>Rockford had more moderate declinesafter periods <strong>of</strong> growth. The price indiceshave not declined since 2007 inBloomington-Normal, Champaign-Urbana, Decatur, Peoria, <strong>and</strong> Springfield.Figure 3<strong>Property</strong> Tax as a Percentage <strong>of</strong> Total State <strong>and</strong> Local TaxRevenuePercent4035302520151002000200120022003200420052006Source: U.S. Census Bureau, Quarterly Summary <strong>of</strong> State <strong>and</strong> Local Tax RevenueFigure 4<strong>Property</strong> Tax as a Percentage <strong>of</strong> State Tax Revenue in IllinoisPercent32102000200120022003200420052006Source: U.S. Census Bureau, Quarterly Summary <strong>of</strong> State <strong>and</strong> Local Tax Revenue200720072008200820092009Trends in <strong>Property</strong> <strong>Taxes</strong>The path <strong>of</strong> house prices over the lastdecade might lead one to expect that propertytax revenue would have increaseddramatically up to 2007 <strong>and</strong> then fallensignificantly since then. The relationshipbetween house prices <strong>and</strong> property taxpayments is far from mechanical, however.For example, if property taxes increased inproportion to house prices when terms like“bubble” are used to describe the state <strong>of</strong>the housing market, it is reasonable toexpect that property taxes would accountfor a larger share <strong>of</strong> total state <strong>and</strong> local taxrevenue. Figure 3 shows the trend for theentire U.S. for property tax revenue as apercentage <strong>of</strong> total state <strong>and</strong> local tax revenuefor 1998-2008. The percentage hardlychanged between 2003 <strong>and</strong> 2007, <strong>and</strong> onlybegan to rise significantly as house pricesfell sharply in 2009.Similar trends were evident in Illinois.Figure 4 shows the trend for the statebudget for 2000-2009. Despite the hugegrowth in house prices, the property taxaccounted for a lower share <strong>of</strong> total taxrevenue for the state in 2007 than it hadearlier in the decade. However, the propertytax accounts for only a trivial percentage<strong>of</strong> the state government’sbudget—well under one-half percentagepoint in each year over the past decade.In contrast to the state, Illinois’ local governmentsrely heavily on the property tax.As can be seen in Figure 5, the property taxaccounted for more than 71 percent <strong>of</strong> localgovernments’ general own-source revenuein 1997 in Illinois. This figure fell over thecourse <strong>of</strong> the last decade to just over 68percent in 2007—even as property valueswere increasing significantly.Empirical StudiesA study by Byron Lutz was the first to usenational data to estimate the elasticity <strong>of</strong>property tax revenue with respect to house
Figure 5<strong>Property</strong> Tax as a Percentage <strong>of</strong>General Own-Source Revenue, LocalGovernmentsPercent727170696867661997 2002 2007Source: U.S. Census Bureau, Census <strong>of</strong> Governmentsprices. 2 Lutz conducts the analysis usingtwo data sets—aggregate national data for1976-2007 on property tax revenue <strong>and</strong>house prices, <strong>and</strong> a comparable data setcovering all local governments in the U.S.for 1985-2005. Both <strong>of</strong> these periods aretimes when house prices were risingthroughout most <strong>of</strong> the nation. In contrastto the evidence presented in Figures 3-5,he concludes that:“The evidence suggests property tax revenuesare quite responsive to changes inhouse prices. Although it takes several yearsfor house price appreciation to feed throughto property tax revenues, the long-run elasticityis on the order <strong>of</strong> 0.4. On average,policymakers are estimated to respond toincreasing home prices by 60 percent <strong>of</strong> theincrease in tax revenue that would haveoccurred in the absence <strong>of</strong> a change in theeffective tax rate.” (Lutz, 2008, p. 566)In a subsequent paper, Lutz, Molloy, <strong>and</strong>Shan analyze the channels by which thehousing market affects state <strong>and</strong> local taxrevenue. 3 At its most basic level, a jurisdiction’sproperty tax revenue (T) is simplythe product <strong>of</strong> its effective tax rate (t) <strong>and</strong>the market value <strong>of</strong> its taxable property(V): T = tV. The first channel by whichchanges in house prices affect revenue isentirely mechanical: if the tax rate is constant<strong>and</strong> the market value <strong>of</strong> taxable propertychanges from V 1 to V 2 , then revenuerises by t(V 2 -V 1 ). However, tax rates maychange when property values increase. Ifboth V <strong>and</strong> t change, then the full changein revenue is T 2 -T 1 = t(V 2 -V 1 ) + (t 2 -t 1 )V 1 .Other channels by which changes in houseprices affect tax revenue are less direct.<strong>Declining</strong> house prices may reduce construction,which reduces sales tax revenuefrom construction materials <strong>and</strong> perhapsincome taxes from construction workers. Agrowing recent literature suggests that risinghouse prices increase consumptionexpenditures by making consumers feelwealthier. 4 Thus, declines in house pricesmay lead to lower sales tax collections.Similarly, voters will be less inclined tosupport expenditure bills when their propertyvalues fall.The study by Lutz, Molloy, <strong>and</strong> Shan suggeststhat the direct channels are muchstronger than the indirect ones. However,both this study <strong>and</strong> the earlier one byByron Lutz suggest that there are long lagsbetween house price changes <strong>and</strong> theireffects on tax revenue. Recent declines inhouse prices may affect revenue sometimein the future, but it could easily take 5-10years until their effect becomes pronounced.These long lags may help explainwhy Figures 3-5 show little response <strong>of</strong>property taxes to rising house prices. Thelags may also explain why recent studiesshow little response in property tax revenueto the recent declines in house prices. 5Several factors account for these long lags.Assessments may take quite some time torespond to price changes, in part becauseassessors may not respond immediately tothe price changes <strong>and</strong> in part becausemany jurisdictions assess property relativelyinfrequently. In Illinois, CookCounty assesses properties every threeyears while other counties in the state havea four-year assessment cycle. Thus, it caneasily take five years or more for assessmentsto catch up to market trends. Inaddition, nearly all states have adoptedsome form <strong>of</strong> property tax limitation measurewhich restricts jurisdictions’ ability to3 Lutz, Byron, RavenMolloy, <strong>and</strong> HuiShan, “The <strong>Housing</strong>Crisis <strong>and</strong> LocalGovernment TaxRevenues: FiveChannels,” workingpaper, FederalReserve Board <strong>of</strong>Governors (2010).4 Recent studiesinclude Attanasio,Orazio, Laura Blow,Robert Hamilton,<strong>and</strong> AndrewLeicester, “Booms<strong>and</strong> Busts: Consumption,House<strong>Prices</strong> <strong>and</strong> Expectations,”Economica76 (2009), 20-50;Bostic, Raphael,<strong>and</strong> Gary Painter,“<strong>Housing</strong> Wealth,Financial Wealth,<strong>and</strong> Consumption:New Evidence fromMicro Data,”Regional Science<strong>and</strong> Urban Economics39 (2009),79-89; Campbell,John Y. <strong>and</strong> João F.Cocco, “How DoHouse <strong>Prices</strong> AffectConsumption?Evidence fromMicro Data,” Journal<strong>of</strong> MonetaryEconomics 54(2007), 591-621;<strong>and</strong> Case, Karl E.,John M. Quigley,<strong>and</strong> Robert J.Shiller, “ComparingWealth Effects: TheStock Market versusthe <strong>Housing</strong>Market,” Advancesin Macroeconomics5 (2005).5 Alm, James, RobertD. Buschman, <strong>and</strong>David L. Sjoquist,“Rethinking LocalGovernmentReliance on the<strong>Property</strong> Tax,” workingpaper, GeorgiaState University(2010), <strong>and</strong>Doerner, William M.<strong>and</strong> Keith R.Ihlanfeldt, “House<strong>Prices</strong> <strong>and</strong> CityRevenues,” workingpaper, Florida StateUniversity (2010).