Declining Housing Prices and Property Taxes - Institute of ...
Declining Housing Prices and Property Taxes - Institute of ...
Declining Housing Prices and Property Taxes - Institute of ...
- No tags were found...

Create successful ePaper yourself
Turn your PDF publications into a flip-book with our unique Google optimized e-Paper software.
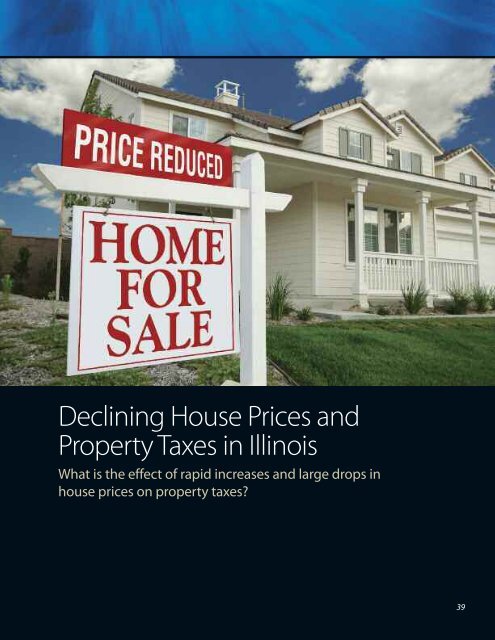
<strong>Declining</strong> House <strong>Prices</strong> <strong>and</strong><strong>Property</strong> <strong>Taxes</strong> in IllinoisWhat is the effect <strong>of</strong> rapid increases <strong>and</strong> large drops inhouse prices on property taxes?
<strong>Declining</strong> House <strong>Prices</strong> <strong>and</strong> <strong>Property</strong> <strong>Taxes</strong>in IllinoisBy Daniel P. McMillen1 The data on houseprices are drawnfrom the Federal<strong>Housing</strong> FinanceAgency’s web site,http://www.fhfa.gov/Default.aspx?Page=87. The priceindices are basedon a combination<strong>of</strong> sales <strong>and</strong>appraisal data. TheFHFA data areunique in thebreadth <strong>of</strong>geography <strong>and</strong>time covered bythe price indices.The past decade has been an extraordinarytime for the housing market inthe United States. According to data fromthe Federal <strong>Housing</strong> Finance Agency(FHFA), from the first quarter <strong>of</strong> 2000 tothe peak <strong>of</strong> the housing market in the firstquarter <strong>of</strong> 2007 the average Americanhome increased in value by 67 percent, oran average annual rate <strong>of</strong> approximately7.6 percent. The price declines since thenhave also been dramatic. From the firstquarter <strong>of</strong> 2007 to the second quarter <strong>of</strong>2010, the price <strong>of</strong> an average Americanhome fell by 11.2 percent, which translatesinto an average annual rate <strong>of</strong> about 3.6percent. Although the rate <strong>of</strong> decline hasslowed, it is not yet clear whether thehousing market has truly reached bottom,<strong>and</strong> it may be some time before pricesreturn to the heights reached in 2007. 1What is the effect <strong>of</strong> rapid increases <strong>and</strong>large drops in house prices on propertytaxes? To a first approximation, it might beexpected that there is a simple proportionalrelationship between house prices<strong>and</strong> property taxes—taxes rise when houseprices increase <strong>and</strong> taxes fall when pricesdecline. This simple relationship wouldhold if taxes were a constant percentage <strong>of</strong>property value, assessments were accurate<strong>and</strong> timely, <strong>and</strong> all property valuesincreased at the same rate. Because theactual tax system is much more complicatedthan this, it turns out to be very hardto predict how taxes will react to changesin property values. In fact, a much betterfirst approximation to the effect <strong>of</strong> houseprice changes on property taxes is thatthere simply is no relationship: taxes aredetermined independently <strong>of</strong> property values,with the tax rate adjusting to keep revenueconstant even in times when pricesare changing dramatically.Even if total tax revenue did, in fact, remainconstant as house prices change, there stillmay be significant changes in individual taxbills. <strong>Taxes</strong> go up in places where houseprices increase unusually rapidly, <strong>and</strong> allresidential tax payments may increase if therate <strong>of</strong> appreciation <strong>of</strong> commercial <strong>and</strong>industrial properties does not keep pacewith residential appreciation rates. Moreover,changes in property values directlyaffect homeowners’ wealth, <strong>and</strong> significantdeclines in property values may force localjurisdictions to reduce their expenditures.Other changes are even more indirect—ifconsumers feel less wealthy when propertyvalues decline, then revenue from the salestax may decline when consumers spend lessthan before, <strong>and</strong> income tax revenue may beaffected if lower property values lead to lessbuilding <strong>and</strong> thus to lower employment inthe construction industry. But the sum <strong>of</strong> allsuch indirect changes is likely to be far lessthan the direct change that would result ifproperty taxes were, in fact, proportional toproperty values.In this chapter, I review some <strong>of</strong> the evidenceabout the relationship between propertyvalues <strong>and</strong> taxes with an emphasis onIllinois generally <strong>and</strong> the Cook County proportion<strong>of</strong> the Chicago metropolitan area inparticular. The main conclusion is simple:falling property values do not necessarilylead to declines in property taxes becausetax rates increase when assessments decline.However, the distribution <strong>of</strong> tax paymentsacross households can vary greatly. Householdsin places with relatively small declinesin house values may see their tax paymentincrease even if their assessments have beenreduced. The main effect <strong>of</strong> house pricedeclines on property taxes is much lessdirect: if homeowners feel less wealthy, theyare less inclined to support tax increases.
House Price VolatilityFigure 1 shows the path <strong>of</strong> house prices forthe United States, the Chicago-Joliet-Naperville metropolitan area (not includingLake County), the full state <strong>of</strong> Illinois,<strong>and</strong> the parts <strong>of</strong> Illinois that are not in metropolitanareas. After a period <strong>of</strong> moderategrowth in the late 1990s, prices began torise rapidly in the U.S. beginning about2001, <strong>and</strong> a period <strong>of</strong> extraordinary appreciationbegan around 2003. Price began t<strong>of</strong>all sharply in 2007. The Chicago metroarea’s experience is nearly identical to thenational average through 2007, but the rate<strong>of</strong> decline since then has been greater. Thefull state <strong>of</strong> Illinois has had more moderateprice growth <strong>and</strong> more moderate declines.Non-metro Illinois neither shared in therapid price appreciation <strong>of</strong> the early part <strong>of</strong>the decade nor suffered any significantprice declines.Figure 2Average Annual Changes in House <strong>Prices</strong>105Figure 1House Price IndicesIndex, 1995:1 = 1002502001501005001995199619971998199920002001200220032004200520062007200820092010USIllinoisSource: Federal <strong>Housing</strong> Finance AgencyIt is clear from Figure 1 that 2003-2007 wasa unique period <strong>of</strong> extraordinary appreciationin house prices for Chicago, Illinois,<strong>and</strong> the U.S. How has the rest <strong>of</strong> metro-Chicago-Joliet-NapervilleIllinois, Non-MetroThe Chicagometro area’sexperience isnearly identicalto the nationalaveragethrough 27,but the rate <strong>of</strong>decline sincethen has beengreater.Percent0-5-10Bloomington-NormalChampaign-UrbanaChicago-Joliet-NapervilleDanvilleDecaturKankakeeLake CountyPeoriaRockfordSpringfieldIllinois, Non-MetroUSA2003:1 - 2007:1 2007:1 - 2010:1Source: Federal <strong>Housing</strong> Finance Agency
The Illinois Report 20112 Lutz, Byron F., “TheConnectionBetween HousePrice Appreciation<strong>and</strong> <strong>Property</strong> TaxRevenues,” NationalTax Journal 61(2008), 555-572.2Illinois fared over the last decade? Figure 2compares annual average house pricechanges for the first quarter <strong>of</strong> 2003 to thefirst quarter <strong>of</strong> 2007 <strong>and</strong> from 2007:1 to2010:2 across all <strong>of</strong> Illinois’ metropolitanareas, along with non-metro Illinois <strong>and</strong>the nation. Chicago <strong>and</strong> Lake County hadvery high growth followed by sharpdeclines. Danville, Kankakee, <strong>and</strong>Rockford had more moderate declinesafter periods <strong>of</strong> growth. The price indiceshave not declined since 2007 inBloomington-Normal, Champaign-Urbana, Decatur, Peoria, <strong>and</strong> Springfield.Figure 3<strong>Property</strong> Tax as a Percentage <strong>of</strong> Total State <strong>and</strong> Local TaxRevenuePercent4035302520151002000200120022003200420052006Source: U.S. Census Bureau, Quarterly Summary <strong>of</strong> State <strong>and</strong> Local Tax RevenueFigure 4<strong>Property</strong> Tax as a Percentage <strong>of</strong> State Tax Revenue in IllinoisPercent32102000200120022003200420052006Source: U.S. Census Bureau, Quarterly Summary <strong>of</strong> State <strong>and</strong> Local Tax Revenue200720072008200820092009Trends in <strong>Property</strong> <strong>Taxes</strong>The path <strong>of</strong> house prices over the lastdecade might lead one to expect that propertytax revenue would have increaseddramatically up to 2007 <strong>and</strong> then fallensignificantly since then. The relationshipbetween house prices <strong>and</strong> property taxpayments is far from mechanical, however.For example, if property taxes increased inproportion to house prices when terms like“bubble” are used to describe the state <strong>of</strong>the housing market, it is reasonable toexpect that property taxes would accountfor a larger share <strong>of</strong> total state <strong>and</strong> local taxrevenue. Figure 3 shows the trend for theentire U.S. for property tax revenue as apercentage <strong>of</strong> total state <strong>and</strong> local tax revenuefor 1998-2008. The percentage hardlychanged between 2003 <strong>and</strong> 2007, <strong>and</strong> onlybegan to rise significantly as house pricesfell sharply in 2009.Similar trends were evident in Illinois.Figure 4 shows the trend for the statebudget for 2000-2009. Despite the hugegrowth in house prices, the property taxaccounted for a lower share <strong>of</strong> total taxrevenue for the state in 2007 than it hadearlier in the decade. However, the propertytax accounts for only a trivial percentage<strong>of</strong> the state government’sbudget—well under one-half percentagepoint in each year over the past decade.In contrast to the state, Illinois’ local governmentsrely heavily on the property tax.As can be seen in Figure 5, the property taxaccounted for more than 71 percent <strong>of</strong> localgovernments’ general own-source revenuein 1997 in Illinois. This figure fell over thecourse <strong>of</strong> the last decade to just over 68percent in 2007—even as property valueswere increasing significantly.Empirical StudiesA study by Byron Lutz was the first to usenational data to estimate the elasticity <strong>of</strong>property tax revenue with respect to house
Figure 5<strong>Property</strong> Tax as a Percentage <strong>of</strong>General Own-Source Revenue, LocalGovernmentsPercent727170696867661997 2002 2007Source: U.S. Census Bureau, Census <strong>of</strong> Governmentsprices. 2 Lutz conducts the analysis usingtwo data sets—aggregate national data for1976-2007 on property tax revenue <strong>and</strong>house prices, <strong>and</strong> a comparable data setcovering all local governments in the U.S.for 1985-2005. Both <strong>of</strong> these periods aretimes when house prices were risingthroughout most <strong>of</strong> the nation. In contrastto the evidence presented in Figures 3-5,he concludes that:“The evidence suggests property tax revenuesare quite responsive to changes inhouse prices. Although it takes several yearsfor house price appreciation to feed throughto property tax revenues, the long-run elasticityis on the order <strong>of</strong> 0.4. On average,policymakers are estimated to respond toincreasing home prices by 60 percent <strong>of</strong> theincrease in tax revenue that would haveoccurred in the absence <strong>of</strong> a change in theeffective tax rate.” (Lutz, 2008, p. 566)In a subsequent paper, Lutz, Molloy, <strong>and</strong>Shan analyze the channels by which thehousing market affects state <strong>and</strong> local taxrevenue. 3 At its most basic level, a jurisdiction’sproperty tax revenue (T) is simplythe product <strong>of</strong> its effective tax rate (t) <strong>and</strong>the market value <strong>of</strong> its taxable property(V): T = tV. The first channel by whichchanges in house prices affect revenue isentirely mechanical: if the tax rate is constant<strong>and</strong> the market value <strong>of</strong> taxable propertychanges from V 1 to V 2 , then revenuerises by t(V 2 -V 1 ). However, tax rates maychange when property values increase. Ifboth V <strong>and</strong> t change, then the full changein revenue is T 2 -T 1 = t(V 2 -V 1 ) + (t 2 -t 1 )V 1 .Other channels by which changes in houseprices affect tax revenue are less direct.<strong>Declining</strong> house prices may reduce construction,which reduces sales tax revenuefrom construction materials <strong>and</strong> perhapsincome taxes from construction workers. Agrowing recent literature suggests that risinghouse prices increase consumptionexpenditures by making consumers feelwealthier. 4 Thus, declines in house pricesmay lead to lower sales tax collections.Similarly, voters will be less inclined tosupport expenditure bills when their propertyvalues fall.The study by Lutz, Molloy, <strong>and</strong> Shan suggeststhat the direct channels are muchstronger than the indirect ones. However,both this study <strong>and</strong> the earlier one byByron Lutz suggest that there are long lagsbetween house price changes <strong>and</strong> theireffects on tax revenue. Recent declines inhouse prices may affect revenue sometimein the future, but it could easily take 5-10years until their effect becomes pronounced.These long lags may help explainwhy Figures 3-5 show little response <strong>of</strong>property taxes to rising house prices. Thelags may also explain why recent studiesshow little response in property tax revenueto the recent declines in house prices. 5Several factors account for these long lags.Assessments may take quite some time torespond to price changes, in part becauseassessors may not respond immediately tothe price changes <strong>and</strong> in part becausemany jurisdictions assess property relativelyinfrequently. In Illinois, CookCounty assesses properties every threeyears while other counties in the state havea four-year assessment cycle. Thus, it caneasily take five years or more for assessmentsto catch up to market trends. Inaddition, nearly all states have adoptedsome form <strong>of</strong> property tax limitation measurewhich restricts jurisdictions’ ability to3 Lutz, Byron, RavenMolloy, <strong>and</strong> HuiShan, “The <strong>Housing</strong>Crisis <strong>and</strong> LocalGovernment TaxRevenues: FiveChannels,” workingpaper, FederalReserve Board <strong>of</strong>Governors (2010).4 Recent studiesinclude Attanasio,Orazio, Laura Blow,Robert Hamilton,<strong>and</strong> AndrewLeicester, “Booms<strong>and</strong> Busts: Consumption,House<strong>Prices</strong> <strong>and</strong> Expectations,”Economica76 (2009), 20-50;Bostic, Raphael,<strong>and</strong> Gary Painter,“<strong>Housing</strong> Wealth,Financial Wealth,<strong>and</strong> Consumption:New Evidence fromMicro Data,”Regional Science<strong>and</strong> Urban Economics39 (2009),79-89; Campbell,John Y. <strong>and</strong> João F.Cocco, “How DoHouse <strong>Prices</strong> AffectConsumption?Evidence fromMicro Data,” Journal<strong>of</strong> MonetaryEconomics 54(2007), 591-621;<strong>and</strong> Case, Karl E.,John M. Quigley,<strong>and</strong> Robert J.Shiller, “ComparingWealth Effects: TheStock Market versusthe <strong>Housing</strong>Market,” Advancesin Macroeconomics5 (2005).5 Alm, James, RobertD. Buschman, <strong>and</strong>David L. Sjoquist,“Rethinking LocalGovernmentReliance on the<strong>Property</strong> Tax,” workingpaper, GeorgiaState University(2010), <strong>and</strong>Doerner, William M.<strong>and</strong> Keith R.Ihlanfeldt, “House<strong>Prices</strong> <strong>and</strong> CityRevenues,” workingpaper, Florida StateUniversity (2010).
The Illinois Report 20116 Anderson, NathanB., “<strong>Property</strong> TaxLimitations: AnInterpretiveReview,” NationalTax Journal 59(2006), 685-694.7 According to datafrom the IllinoisDepartment <strong>of</strong>Revenue, all but 19<strong>of</strong> the 101 othercounties in thestate had multipliers<strong>of</strong> 1 in 2007(http://www.revenue.state.il.us/LocalGovernment/2007-table-3-multipliers.pdf),meaning that theirassessments wereaccurate on average.The averagemultiplier for these19 states was 1.026,with a range <strong>of</strong> .960to 1.131.8 A full list <strong>of</strong> exemptionsis available onthe IllinoisDepartment <strong>of</strong>Revenue’s web site:http://www.revenue.state.il.us/localgovernment/propertytax/taxrelief.htm.raise revenue when prices increase. 6 Inmany cases, these limits on the response <strong>of</strong>property tax revenue when prices rise alsolead to some catch-up when prices fall,which has an ameliorative effect on revenueresponses to price declines.The most important source <strong>of</strong> lags is <strong>of</strong>tenoverlooked: in many jurisdictions, tax ratesrespond more mechanically than tax paymentsto changes in house prices. If T = tV<strong>and</strong> V is an accurate <strong>and</strong> timely measure <strong>of</strong>house prices, then either T or t can respondto maintain the equality when V changes.In many—perhaps most—jurisdictions, Tis determined in local elections, while V isdetermined by local assessment practices.The tax rate then responds mechanically toensure that the equality holds. It shouldhardly be surprising, then, to find thatproperty tax revenue bears little or no relationshipto house prices; it is t thatresponds, not T.<strong>Property</strong> Tax Administration in IllinoisIllinois is part <strong>of</strong> a group <strong>of</strong> states in whichproperty tax rates bear a more mechanicalrelationship to property values than is thecase for revenue. Consider the followingtable that the Cook County Assessor’sOffice website uses to illustrate how to calculatean estimated tax bill (http://cookcountyassessor.com/estimatedtaxbill.aspx).Table 1How to Calculate an EstimatedResidential Tax Bill in Cook County$ 100,000 Estimated Market Value× .10 Assessment Level (10 percent)$ 10,000 Proposed Assessed Valuation× 2.8439 2007 State Equalizer$ 28,439 Equalized Assessed Value (EAV)– 5,500 Homeowner Exemption$ 22,939 Adjusted Equalized Value (AEAV)× .10 Sample Tax Rate (your tax ratecould vary)$ 2,293 Estimated Tax Bill in DollarsSource: http://cookcountyassessor.com/estimatedtaxbill.aspxThe Assessor’s Office is in charge <strong>of</strong> estimatingmarket values every three years inCook County. By statute, residential assessmentsare supposed to be set at 16 percent<strong>of</strong> market value in Cook County, but in2009 the Assessor’s Office recentlyannounced a “recalibration” <strong>of</strong> the assessmentprocess <strong>and</strong> now announces a target<strong>of</strong> 10 percent for the assessment ratio ratherthan 16 percent. Similarly, commercial <strong>and</strong>industrial assessment levels have been recalibratedto 25 percent rather than theirstatutory 38 percent <strong>and</strong> 36 percent rates.Assessment levels are 1/3 <strong>of</strong> all propertyclasses in the other counties in state.Although Cook County is allowed to havedifferent assessment levels for differentproperty classes, the total <strong>of</strong> all assessmentsmust end up being 1/3 <strong>of</strong> propertyvalue for all counties in the state, includingCook. In Cook County, each property’sproposed assessed valuation in 2007 wasmultiplied by the state equalizer—the“multiplier”—<strong>of</strong> 2.8439 to ensure that totalassessment averaged 1/3 <strong>of</strong> propertyvalue, i.e., the average assessment acrossall property classes was .33/2.8439 = 11.6percent <strong>of</strong> market value in 2007. Multipliershover near 1 in all other counties in thestate, which implies that assessment levelsare close to their statutory 1/3 rate. 7The final step in the transition from marketvalue to the property tax base is the homeownerexemption. 8 The basic homesteadexemption was increased to $6,000 in 2009.Other special exemptions are available forfavored groups such as senior citizens, veterans,<strong>and</strong> people with disabilities. CookCounty has some additional exemptionsfor people who have lived in their homefor 10 years <strong>and</strong> have household incomes<strong>of</strong> less than $100,000, as well as an alternativegeneral homestead exemption forhomes with assessed values that haveincreased by more than 7 percent.The Illinois Department <strong>of</strong> Revenue calculatesequalization factors by comparing
<strong>Institute</strong> <strong>of</strong> Government & Public Affairseach county’s assessments to actual salesprices. Equalization factors are calculatedwith some lag because the Department <strong>of</strong>Revenue compares a year’s assessments tosales prices from the previous year, <strong>and</strong>assessments themselves take place on arotating three-year cycle within CookCounty <strong>and</strong> on a four-year cycle elsewhere.These lags mean that equalized assessmentscan easily take four to five years t<strong>of</strong>ully react to changes in market values.Apart from these lags <strong>and</strong> the panoply <strong>of</strong>exemptions, the assessment process isdesigned to produce assessments thatclosely track market values. A jurisdiction’sproperty tax base is the sum <strong>of</strong> theadjusted assessed values, i.e.,B = ∑ n t = AEAV iwhere B is the tax base <strong>and</strong> AEAVi is theadjusted equalized assessed valuation forthe ith property in the jurisdiction. Oncethis base is determined, all properties inthe jurisdictions are taxed at the same rate,t. The total tax revenue for the jurisdictionsis thus T = tB.Given this reasonably straightforward relationshipbetween assessed values <strong>and</strong> taxrevenue, changes in actual property valueswould lead in time to proportionatechanges in tax revenue if the tax rate wereconstant. In Illinois, as in most states, it isthe tax rate that adjusts when the tax basechanges, not revenue. In other words, thesimple identity should be re-written as t =B/T to reflect the actual direction <strong>of</strong> causation:each jurisdiction’s tax base <strong>and</strong> totaltax extension interact to determine its taxrate. The tax rate falls when assessed valuesrise in response to rising property values,<strong>and</strong> it rises when assessed values fallin response to declining property values.However, the change does not comeovernight. <strong>Property</strong> values began todecline in 2007 <strong>and</strong> many properties areonly now being re-assessed to reflect thechanging market conditions. Once theproperties are re-assessed, tax rates willrise unless voters agree to reduce expenditurelevels.The Distribution <strong>of</strong> <strong>Taxes</strong>The way tax rates are calculated in Illinoismeans that an individual’s property taxbill will be unchanged if all prices rise orfall by the same percentage <strong>and</strong> the number<strong>of</strong> properties does not change overtime. This unrealistic scenario does nottake into account the fact that new propertiesare added over time <strong>and</strong> others aredemolished or are converted to alternativeuses. It also involves an unrealisticassumption that all properties appreciateor decline in value at the same rate.These issues are particularly relevant inCook County. Unlike the other counties inthe state, Cook County’s classified tax systemmakes residential properties a favoredclass with lower effective rates than otherproperty classes. Non-residential propertiesare not the beneficiaries <strong>of</strong> exemptions<strong>and</strong> are subject to higher property assessmentlevels. Table 2 shows the calculation<strong>of</strong> the tax bill for a representative commercialor industrial property in Cook Countyif the recent recalibration for non-residentialassessments to 25 percent <strong>of</strong> propertyvalue had been applied in 2007.Table 2How to Calculate an Estimated Tax Billfor a Commercial or Industrial<strong>Property</strong> in Cook County$ 100,000 Estimated Market Value× .25 Assessment Level (25 percent)$ 25,000 Proposed Assessed Valuation× 2.8439 2007 State Equalizer$ 71,098 Equalized Assessed Value (EAV)– 0 (No Exemption)$ 71,098 Adjusted Equalized Value (AEAV)× .10 Sample Tax Rate (your tax ratecould vary)$ 7,110 Estimated Tax Bill in DollarsSource: http://cookcountyassessor.com/estimatedtaxbill.aspxUnlike theother countiesin the state,Cook County’sclassified taxsystem makesresidentialproperties afavored classwith lowereffective ratesthan otherpropertyclasses.
The Illinois Report 20119 Note that these calculationsuse thesame $5,500 homesteadexemptionthat was used inthe table from theCook CountyAssessor’s Office.When the figure israised to $6,000 tobe consistent withthe current exemption,the value <strong>of</strong>$116,667 rises to$118,000 for countiesother thanCook <strong>and</strong> the valuerises from $269,340to $271,107 in CookCounty.10 The exact calculationsare 2.69 ×1,040,964 × (73,002– 69,262) =104,772,722,420 forcommercial <strong>and</strong>2.69 × 685,920 ×(27,879 – 25,100) =5,127,601,819 forindustrial.The total tax bill for a commercial orindustrial property with a market value <strong>of</strong>$100,000 in this example is 7,110; it wouldbe $2,293 for a residential property withthe identical market value. The effectivetax rate is 7,110/100,000 = 7.11 percent,compared with 2.29 percent for the residentialproperty. The tax bill is more thanthree times higher for commercial propertythan for a residential property that has thevery same market value.In any county in the state, a loss <strong>of</strong> commercialor industrial property will necessarilylead to higher taxes on residentialproperty owners unless the tax extensionchanges. In other counties, each $100,000<strong>of</strong> market value that is lost in commercialor industrial property value only needs tobe replaced with $116,667 in residentialproperty to keep taxes the same as before.The additional $16,667 is needed to compensatefor the exemption that is providedto residential property owners. These calculationsare shown in the first twocolumns <strong>of</strong> the tables below, which showthat representative $100,000 commercialindustrial properties produce the same taxrevenue as a $116,667 residential propertyin 101 <strong>of</strong> the state’s 102 counties. 9 Similarcalculations in columns 3 <strong>and</strong> 4 show thatthe $100,000 non-residential property hasto be replaced with a $269,340 home tokeep taxes the same in Cook County. Thissituation provides a huge disincentive forcommercial property owners to locate inCook County, <strong>and</strong> also means that any loss<strong>of</strong> non-residential property is likely to produceincreases in residential tax bills evenas homes drop in value.Unfortunately for Cook County, the number<strong>of</strong> commercial <strong>and</strong> industrial propertieshas been falling over time. Datapresented in the Cook County Assessor’sOffice Final Assessment Abstracts show thatthe total number <strong>of</strong> commercial propertiesin the county fell from 73,002 to 69,263 in2008, <strong>and</strong> the total number <strong>of</strong> industrialproperties declined from 27,879 to 25,110.The average commercial assessment was$262,491 in 2008 <strong>and</strong> the average industrialassessment was $171,480; these figurestranslate into market values <strong>of</strong> $1,049,964<strong>and</strong> $685,920 at the re-calibrated 25 percentassessment level. Because each propertyneeds to be replaced by a residential propertywith a value that is 2.69 times asexpensive to keep property valueunchanged, the commercial propertieswould need to be replaced by more than$100 billion in residential homes to keepthe property tax bill constant, <strong>and</strong> another$5 billion would be needed to compensatefor the loss <strong>of</strong> commercial property. 10Table 3Comparison <strong>of</strong> Residential <strong>and</strong> Commercial <strong>Property</strong> TaxRates <strong>and</strong> Their Influence on Each OtherOther CountiesCook CountyRes. Com. or Res. Com. orInd.Ind.$116,667 $100,000 $269,340 $100,000 Estimated Market Value× .33 × .33 × .10 × .25 Assessment Level (33 percent)$ 38,500 $ 33,000 $ 26,934 $ 25,000 Proposed Assessed Valuation× 1 × 1 × 2.8439 × 2.8439 2007 State Equalizer$ 38,500 $ 33,000 $ 76,598 $ 71,098 Equalized Assessed Value (EAV)– $5,500 – 0 – $5,500 – 0 (Exemption)$ 33,000 $ 33,000 $ 71,098 $ 71,098 Adjusted Equalized Value (AEAV)× .10 × .10 × .10 × .10 Sample Tax Rate$ 3,300 $ 3,300 $ 7,110 $ 7,110 Estimated Tax Bill in DollarsSource: http://cookcountyassessor.com/estimatedtaxbill.aspxThese calculations show that a loss <strong>of</strong> nonresidentialproperty in a jurisdiction canlead to increases in homeowners’ propertytax bills even if all residential assessmentsremain constant over time. Tax bills willalso change when property values changeat different rates in different area within ajurisdiction. For example, suppose a jurisdiction’sentire tax base is residential, with1,000 properties that initially all haveadjusted equalized assessed values <strong>of</strong>$50,000. The tax base is $50 million. If votersin the jurisdiction have authorizedproperty tax extensions <strong>of</strong> $10 million,then the tax rate is .20, <strong>and</strong> each homeownerpays $10,000 in property tax. Now
The Illinois Report 201111Dye, Richard F.,Daniel P. McMillen,<strong>and</strong> David F.Merriman, “TheEffect <strong>of</strong> <strong>Declining</strong>House <strong>Prices</strong> onSchool <strong>Property</strong><strong>Taxes</strong> <strong>and</strong> SchoolAid in Illinois,”University <strong>of</strong> Illinois<strong>Institute</strong> <strong>of</strong>Government <strong>and</strong>Public Affairs(2010).side <strong>of</strong> the city. If tax extensions remainedconstant during time <strong>and</strong> there were nochange in the number <strong>of</strong> properties or themix <strong>of</strong> residential <strong>and</strong> non-residentialproperties <strong>and</strong> assessments accuratelyreflect changes in market value, then taxpayments would increase in the areas <strong>of</strong>the city that are in red relative to the areasshaded in blue. If the red areas also experiencedgreater declines in property valuesafter prices began to decline in 2007, thenthese areas will eventually come to be thebeneficiaries <strong>of</strong> lower tax payments whilethe blue areas may make higher tax paymentseven as their homes drop in value.The Illinois <strong>Property</strong> Tax ExtensionLimitation Law (PTELL)PTELL was first adopted in 1991 by thefive collar counties <strong>of</strong> suburban Chicago. Itwas extended to Cook County in 1994, <strong>and</strong>has since been adopted by another 33counties in the state. PTELL limits thegrowth rate in total property tax to thelesser <strong>of</strong> the rate <strong>of</strong> inflation <strong>and</strong> 5 percent.The limits are implemented by imposing amaximum tax rate for jurisdictions inPTELL areas. Because declining assessmentsmust be accompanied by higher taxrates to keep extensions at their target levels<strong>and</strong> PTELL imposes maximum tax rateson jurisdictions, do falling house pricesnecessarily lead to lower property taxextensions in PTELL jurisdictions?This question is addressed in a recent studyby Dye, McMillen, <strong>and</strong> Merriman. 11 Theanswer to the question is no; althoughPTELL imposes limits on increases in propertytax extensions, the interaction betweenfalling assessments <strong>and</strong> the maximum taxrate imposes no additional constraints ontax extensions. The reason for this somewhatcounter-intuitive result is that themaximum tax rate is not set by law;instead, it varies to allow extensions toreach the same level that would have beenreached if assessments had not changed.An example from the Dye, McMillen, <strong>and</strong>Merriman study captures the essence <strong>of</strong>the rate setting process. The maximum taxrate imposed by PTELL can be written asfollows:Maximum tax rate = {(prior extensions)× (1 + inflation factor)}/(new total taxbase), ortptell =( T last year) * (1+p)B this yearwhere, as before, T represents total taxextensions, B represents the total assessmentbase, <strong>and</strong> t represents the tax rate.The new variable is p, which representsthe inflation factor—the less <strong>of</strong> the rate<strong>of</strong> inflation or 5 percent.In times when assessments are rising,PTELL is implemented by imposing alimit on the tax rate. An example based onone presented in the Dye, McMillen, <strong>and</strong>Merriman study illustrates how PTELLaffects total tax extensions for arepresentative school district in a timewhen assessments are falling. Therepresentative district starts with totalEAV (B) <strong>of</strong> $100 million <strong>and</strong> a tax rate (t)<strong>of</strong> 2.5 percent, a combination that provides$2.5 million in total tax extensions (T).Suppose that assessments fall by 10percent so that the new tax base is $90million instead <strong>of</strong> $100 million. Also,suppose that the overall inflation rate iszero, <strong>and</strong> the district therefore decides toleave tax extensions unchanged from theprevious period. The tax rate then mustrise by exactly the amount that assuresthat the $90 million tax base produces $2.5million in taxes. Thus, the new tax rate inthis non-PTELL district is simply 2.5/90 =2.78 percent, or an increase <strong>of</strong> 0.28percentage points.Suppose that an identical district that issubject to PTELL also began with a $100million tax base, a tax rate <strong>of</strong> 2.5 percent,<strong>and</strong> total tax extensions <strong>of</strong> $2.5 million. Ifthe district’s maximum rate remained at2.5 percent, then tax revenue would fall to
<strong>Institute</strong> <strong>of</strong> Government & Public Affairs.025 × 90 = $2.25 million. But themaximum tax rate adjusts to allow thedistrict’s expenditures to keep up with theless <strong>of</strong> 5 percent or the inflation rate,which in this case is simply zero. So thenew maximum tax rate is 2.5/90 = 2.78percent, which is exactly the same as inthe otherwise identical non-PTELL district.The general point is quite simple: propertytax rates are not constant over time inIllinois. Rather, the tax rate changes tokeep ensure that the tax base provides theamount <strong>of</strong> revenue agreed upon by voters.Though PTELL places limits on totalincreases in tax extensions, it places nolimits on how much tax rates can changein response to changing assessments.ConclusionFalling property values do notautomatically impose fiscal stress on state<strong>and</strong> local governments. In the short run,assessments do not change <strong>and</strong> tax ratesstay the same unless tax extensionschange. Although assessments eventuallywill fall to reflect changing marketconditions, homeowners’ tax paymentsmay stay the same as before. In Illinois, asin most <strong>of</strong> the country, tax extensions donot adjust passively to changes inassessments: increases in assessments donot automatically produce increases inproperty taxes, <strong>and</strong> declines inassessments do not automatically producedecreases in property taxes. Instead, it istax rates that adjust to changingassessments.The distribution <strong>of</strong> assessment changescan have a significant effect on ahomeowner’s tax bill, however. Areaswith smaller declines in assessments mayend up having higher tax bills eventhough their homes have decreased invalue. Declines in the non-residential taxbase can lead to large increases inresidential tax bills irrespective <strong>of</strong> thedirection <strong>of</strong> change in home prices. But theDaniel P. McMillen has a jointappointment in the Department<strong>of</strong> Economics <strong>and</strong> the <strong>Institute</strong> <strong>of</strong>Government <strong>and</strong> Public Affairs. Healso is a visiting fellow at theLincoln <strong>Institute</strong> <strong>of</strong> L<strong>and</strong> Policy<strong>and</strong> a consultant at the FederalReserve Bank <strong>of</strong> Chicago. Heserved as the Director <strong>of</strong> theCenter for Urban Real Estate at theUniversity <strong>of</strong> Illinois at Chicag<strong>of</strong>rom 1999-2005, <strong>and</strong> has been amember <strong>of</strong> the economicsdepartments at the University <strong>of</strong>Oregon, Santa Clara University,Tulane University, <strong>and</strong> theUniversity <strong>of</strong> Illinois at Chicago.McMillen received his Ph.D. inEconomics from NorthwesternUniversity in 1987. Hispublications have appeared insuch academic journals as theJournal <strong>of</strong> Urban Economics,Regional Science <strong>and</strong> UrbanEconomics, the Review <strong>of</strong>Economics <strong>and</strong> Statistics, RealEstate Economics, <strong>and</strong> the Journal<strong>of</strong> Business <strong>and</strong> Economic Statistics.He has been co-editor <strong>of</strong> RegionalScience <strong>and</strong> Urban Economics since2007.most fundamental effect <strong>of</strong> declininghouse prices on property taxes is muchless direct: if voters turn down taxrequests when property values fall, thentaxes will eventually fall. In the end, it isvoters who determine the overall size <strong>of</strong>property tax extensions, not house prices.Fallingpropertyvalues do notautomaticallyimpose fiscalstress on state<strong>and</strong> localgovernments.In the shortrun, assessmentsdo notchange <strong>and</strong>tax rates staythe sameunless taxextensionschange.