Suggested Formulae for Calculating Auditory-filter Bandwidths and ...
Suggested Formulae for Calculating Auditory-filter Bandwidths and ...
Suggested Formulae for Calculating Auditory-filter Bandwidths and ...

Create successful ePaper yourself
Turn your PDF publications into a flip-book with our unique Google optimized e-Paper software.
<strong>Suggested</strong> <strong>for</strong>mulae <strong>for</strong> calculating auditory-<strong>filter</strong> b<strong>and</strong>widths<strong>and</strong> excitation patternsBrian C. J. Moore <strong>and</strong> Brian R. GlasbergDepartment of Experimental Psychology, Unioersitj• of Cambridge, Downing Street, Cambridge CB2 3EB,Engl<strong>and</strong>{Received 3 December 1982; accepted <strong>for</strong> publication 22 April 1983)Recent estimates of auditory-<strong>filter</strong> shape are used to derive a simple <strong>for</strong>mula relating theequivalent rectangular b<strong>and</strong>width (ERB) of the auditory <strong>filter</strong> to center frequency. The value ofthe auditory-<strong>filter</strong> b<strong>and</strong>width continues to decreasecenter frequency decreases below 500 Hz.A <strong>for</strong>mula is also given relating ERB-rate to frequency. Finally, a method is described <strong>for</strong>calculating excitation patterns from <strong>filter</strong> shapes.PACS numbers: 43.66.Ba, 43.66.Dc [JH]INTRODUCTIONThe peripheral auditory system has often been modeledas a bank of overlapping b<strong>and</strong>pass <strong>filter</strong>s (Fletcher, 1940; seePlomp, 1976 <strong>and</strong> Moore, 1982 <strong>for</strong> reviews). This concept isclosely related to the concept of the critical b<strong>and</strong> {Zwicker etal., 1957}, <strong>and</strong> many workers would consider that the criticalb<strong>and</strong>width as measured in a variety of experiments {Scharf,1970}, is related to the b<strong>and</strong>width of the auditory <strong>filter</strong> at agiven center frequency (e.g., Plomp, 1976, p. 10; Moore,1982}. However, the critical b<strong>and</strong>width may also be consideredas a purely empirical phenomenon, <strong>for</strong> example as "thatb<strong>and</strong>width at which subjective responses rather abruptlychange" (Scharf, 1970, p. 159}. Classical estimates of the valueof the critical b<strong>and</strong>width as a function of frequency (thecritical-b<strong>and</strong> function} indicate that its value is approximatelyconstant below 500 I-Iz, but increases above that frequencyroughly in proportion with center frequency {Zwicker et aL,1957; Scharf, 1970; Zwicker <strong>and</strong> Terhardt, 1980}. However,there have been comparatively few direct estimates of criticalb<strong>and</strong>width below 500 Hz, <strong>and</strong> indirect estimates based onthe critical ratio may be in error, since the efficiency of thedetector mechanism following the auditory <strong>filter</strong> appears tochange with center frequency {Patterson et aL, 1982; Fidellet al., 1983}.Recently several groups of workers have estimated theshape of the auditory <strong>filter</strong>, using the notch-noise methoddescribed by Patterson { 1976) or the rippled-noise method ofHoutgast {1977). The <strong>filter</strong> shape has been estimated using alinear model of masking in which it is assumed that thethreshold corresponds to a constant signal-to-masker ratioat the output of the auditory <strong>filter</strong>. In this paper we present asummary of these results which shows that.the equivalentrectangular b<strong>and</strong>width {ERB) of the auditory <strong>filter</strong> continuesto decrease below 500 Hz. If the critical b<strong>and</strong>width isrelated to the ERB of the auditory <strong>filter</strong>, this may indicate aneed to revise the classical critical-b<strong>and</strong> function.I. ESTIMATES OF AUDITORY FILTER SHAPE AND ERBA. The notch-noise methodIn this method the threshold of a sinusoidal signal ismeasured as a function of the width of a spectral notch in anoise masker; the notch is arithmetically centered at the signalfrequency (Patterson, 1976). This method has been usedby Patterson {1976), Weber (1977), Moore <strong>and</strong> Olasberg(1981}, Patterson et al. (1982), Fidell et al. (1983), Glasberg etal. (1983}, <strong>and</strong> Shailer <strong>and</strong> Moore (1983). Patterson et al.(1982) suggested a method of deriving the <strong>filter</strong> shape whichassumed that the <strong>filter</strong> had the <strong>for</strong>mW(g) = {1 -- r)(1 +pg•e -• + r, (1)where g is the deviation in frequency from the <strong>filter</strong> centerfrequency divided by the center frequency, <strong>and</strong> p <strong>and</strong> r areadjustable parameters. The parameter p determines theshape of the passb<strong>and</strong> of the <strong>filter</strong>, while ß determines thepoint at which the passb<strong>and</strong> gives way to the shallower"tails" of the <strong>filter</strong>. The <strong>filter</strong> shape is derived by fitting theintegral of Eq. (1) to the data relating threshold to notchwidth. For full details see Patterson et al. {1982}. For this<strong>filter</strong> shape the ERB expressed as a proportion of center frequencyis approximately equal to 4/p.We have derived values ofp <strong>and</strong> r, <strong>and</strong> hence estimatesof ERB, <strong>for</strong> all studies where more than one frequency wasused, <strong>and</strong> more than one subject was tested. Results areshown in Fig. 1. All the data presented in the figure wereobtained at a noise spectrum level of 40 dB excepthose ofFidell et al. { 1983) which were obtained at a spectrum level of60 dB. At middle to high frequencies the ERB tends to increasewhen the spectrum level is increased above a certainlevel (about 40 dB; see Weber, 1977), but we do not knowwhether this happens at low frequencies, or at what noisespectrum level it occurs; the level would probably be higherthan at high frequencies, owing to the transmission characteristicsof the middle ear. The continuing decrease in theERB as frequency decreases below 500 Hz would, if anything,be more marked if data at low spectrum levels wereavailable. The data shown in Fig. 1 cover a range of frequefi-cies from 0.124 to 6.5 kHz.B. The Hppled-noise methodThis method is fully described by Houtgast (1977).Glasberg et al. (1983), in a direct comparison of the notchnoisemethod <strong>and</strong> the rippled-noise method, found thatERBs estimated from the latter (using Houtgast's method of750 J. Acoust. Soc. Am. 74 (3), September 1983 0001-4966/83/090750-04500.80 (D 1983 Acoustical Society of America 750nloaded 10 May 2010 to 200.39.9.109. Redistribution subject to ASA license or copyright; see http://asadl.org/journals/doc/ASALIB-home/info/terms.j
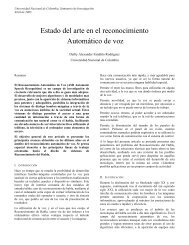
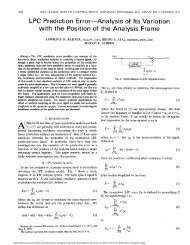
1000500ERB =6.23f +93.39f +28.52 Hz ..."'""'•""/20010050.........•..-"'".• - ß FIDELL et al (198:3)..................................................J 0 HOUTGAST (1977)• 0 PATTERSON (1976)OO PATTERSON et al (1982)ß • WEBER (1977)FIG. I. The symbols indicate estimates ofthe equivalent rectangular b<strong>and</strong>width(ERB) of the auditory <strong>filter</strong> at various centerfrequencies, taken from the results of theworkers indicated. The curve fitted to thedata is specified by the equation in the figure.The dotted line is the classical critical-b<strong>and</strong> function.2O0.1 0.2 o5 1.0 2'o 5'.0 100Center Frequency,kHzanalysis, or using the method described by Pick, 1980) wereabout 35% greater than those estimated from the <strong>for</strong>mer.The discrepancy appears to arise largely from the differentmethods used to derive <strong>filter</strong> shapes from the data. Themethods used by Houtgast <strong>and</strong> Pick can lead to overestimatesof the <strong>filter</strong> b<strong>and</strong>width <strong>for</strong> certain <strong>filter</strong> shapes, includingthe rounded-exponential <strong>filter</strong> shape described by Eq. (1).The discrepancymuch reduced if the data are fitted assuminga <strong>filter</strong> shape such as the rounded exponential; seeOlasberg et al. (1983} <strong>for</strong> details. For the purpose of comparison,Houtgast's estimates of ERBs have been divided by1.35. His data were obtained at moderate noise levels (below35 dB). The results are also shown in Fig. I. After the "adjustment"Houtgast's results closely matched those derivedusing notch noise, in terms of their variation with centerfrequency. This adjustment should not be taken to implythat Houtgast's results are wrong; indeed we feel that the<strong>filter</strong> shape in Eq. (1) may be slightly too sharp around the tipof the <strong>filter</strong>, <strong>and</strong> may lead to underestimates of the ERB (seeGlasberg et ai., 1983). However, our main interest here is inthe variation of ERB with center frequency.C. A simple expression relating ERB to centerfrequencyThe data shown in Fig. 1 have been fitted with an equationof the <strong>for</strong>mERB = Af 2 + Bf + C, (2)where/is center frequency in kHz <strong>and</strong>,4, B, <strong>and</strong> Care adjustableparameters. The fit was obtained by expressing deviationsfrom the fitted function as a proportion of center frequency,<strong>and</strong> minimizing the mean-squaredeviation of thedata from the fit. The resulting function, shown as the solidline in Fig. 1, isERB = 6.23ff 4- 93.39f+ 28.52. (3)For comparison, the dotted line shows the classical criticalb<strong>and</strong>function according to a <strong>for</strong>mula given by Zwicker <strong>and</strong>Terhardt { 1980).II. ERB RATEZwicker <strong>and</strong> his co-workers (Zwicker <strong>and</strong> Feldtkeller,1957; Zwieker <strong>and</strong> Scharf, 1965; Zwicker <strong>and</strong> Terhardt,1980) have argued that it is often instructive <strong>and</strong> convenientto plot psychoacoustical data not as a function of frequency,but rather in terms of units of the critical b<strong>and</strong>width, orBarks. Zwicker called the scale relating frequency to Barksthe critical-b<strong>and</strong>-rate scale, or z scale. This scale can be obtainedby integrating the reciprocal of the critical-b<strong>and</strong> function(Zwicker <strong>and</strong> Fcldtkeller, 1967). A comparable func-01 02 OS 10 20 •0 11Frequency.FIG. 2. The function relating ERB-Tate to center frequency. The functionis specified by the equation in the figure. The dotted line is the classicalcritical-b<strong>and</strong>-rate scale.kHz751 J. Acoust. Sec. Am., Vol. 74, No. 3, September 1983 B.C.J. Moore <strong>and</strong> B. R. Glasberg: <strong>Auditory</strong>-<strong>filter</strong> b<strong>and</strong>widths 751wnloaded 10 May 2010 to 200.39.9.109. Redistribution subject to ASA license or copyright; see http://asadl.org/journals/doc/ASALIB-home/info/terms.js
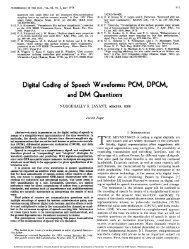
tion, ERB-rate, can be derived from Eq.ERB-rate = 2,+ Bf+ CI log• f+ (B- R )/Z4= R I/za + cont, (4)where R = (B 2 _ 4AC)]/:, <strong>and</strong> B • > 4AC. Substituting thevalues of A, B, <strong>and</strong> C from Eq. (3}, we getI/+0.32 IERB-rate = 11.17 1og• I•-'• 14-•-51 + 43.0. (5)This ERB-rate function is plotted in Fig. 2. The constantof integration, 43.0, has been chosen to make the ERBrate= 0 when f = 0. However, the expression should onlybe considered valid <strong>for</strong> values off between 0.1 <strong>and</strong> 6.5 kHz.For comparison, the critical-b<strong>and</strong>-rate scale suggested byZwicker <strong>and</strong> Terhardt (1980) is shown as the dotted line.III. DERIVATION OF EXCITATION PATTERNS FROMFILTER SHAPESThe excitation pattern evoked by a given sound is thedistribution of internal excitation as a function of some internalvariable related to frequency. In terms of the <strong>filter</strong> bankanalogy, the excitation pattern may be conceived as the outputof each <strong>filter</strong> as a function of <strong>filter</strong> center frequency. Forcalculating excitation patterns from <strong>filter</strong> shapes, it is convenientouse a simple one-parameter approximation to theauditory <strong>filter</strong> shape, by dropping the parameter from Eq.ß ; - 30-500.5Qc1.01.5 20(1). The <strong>filter</strong> shape then becomesWig} = (l + pg}e- Pg. (6)This approximation appears reasonable <strong>for</strong> the mainpassb<strong>and</strong> of the <strong>filter</strong> (within about 25-30 dB of the tip), butit does not adequately characterize the shallower tails of the<strong>filter</strong> (Patterson et al., 1982}. For this simplified <strong>filter</strong> shape,the value of ERB/f is exactly 4/p. Hence Eqs. (3) <strong>and</strong> (6)together give a method of estimating the <strong>filter</strong> shape at anycenter frequency between 0.1 <strong>and</strong> 6.5 kHz. It is then a simplematter to calculate the <strong>filter</strong> output as a function of centerfrequency <strong>for</strong> any given input stimulus. Figure 3 illustratesthis graphically <strong>for</strong> a 1-kHz sinusoid. At the top are shownsimplified <strong>filter</strong> shapes at several center frequencies, with the<strong>for</strong>m given by Eq. (6), <strong>and</strong> with ERBs given by Eq. (3). Forthe <strong>filter</strong> with the lowest center frequency shown, the relativeoutput of the <strong>filter</strong> in response to the l-kHz tone is about-- 40 riB, indicated by the point a. In the lower half of thefigure this gives rise to the point a on the excitation pattern;the point has an ordinate of -- 40 dB, <strong>and</strong> it is positioned onthe abscissat a frequency corresponding to the center of thelowest <strong>filter</strong> illustrated. The relative outputs of the other<strong>filter</strong>s shown are indicated, in order of increasing center frequency,by the points be. These each give correspondingpoints on the excitation pattern. The entire excitation patternwas derived by calculating the <strong>filter</strong> output <strong>for</strong> <strong>filter</strong>center frequenciespaced at 10-Hz intervals. Note that althoughthe <strong>filter</strong> shape is symmetric on a linear frequencyscale, the derived excitation pattern is asymmetric.If desired, the excitation patterns can be plotted as afunction of ERB-rate, using Eq. (5}. When plotted in this waythe shapes of the excitation patterns are independent ofstimulus frequency. They resemble the excitation patternsderived from the masked audiograms of narrow-b<strong>and</strong> noise<strong>for</strong> moderate masker levels (Zwicker <strong>and</strong> Feldtkeller, 1967}.In particular, the low-frequency slope is close to the valuesuggested by Maiwald (1967}.The method is easily extended to derive the excitationpatterns <strong>for</strong> complex stimuli. The patterns <strong>for</strong> the individualsinusoidal components are calculated, <strong>and</strong> are then0 (• -303 -20-s0 s •.0 1.s 2'.0Frequency. kHzFIG. 3. Illustration of the derivation of an excitation pattern from <strong>filter</strong>shapes. At the top are shown simplified <strong>filter</strong> shapes at several center frequencies,with the <strong>for</strong>m given by Eq. (6}. The <strong>filter</strong> shape is assumed symmetrical,but the ERB increases with frequency in accord with Eq. (3}. Theexcitation pattern <strong>for</strong> a I-kHz tone {dashed line) is obtained by calculatingthe output of each <strong>filter</strong> as a function of <strong>filter</strong> center frequency.n--302 & 6 8 10 12 l& 16 18 20 22 2& •6 28ERR - RateFIG. 4. An excitation pattern calculated <strong>for</strong> a complex tone containini; thefirst 12 harmonics of a 200-Hz fundamental, all harmonics havini; equalamplitude. The pattern w•s calculated by summini; the responses to individualcomponents, the summation I:•ni; done in linear power terms.abscissa is an ERB-rate scale.752 J. Acoust. Soc. Am., VoL 74, No. 3, September 1983 B.C.J. Moore <strong>and</strong> B. R. Glasberg: <strong>Auditory</strong>-<strong>filter</strong> b<strong>and</strong>widths 752nloaded 10 May 2010 to 200.39.9.109. Redistribution subject to ASA license or copyright; see http://asadl.org/journals/doc/ASALIB-home/info/terms.j
summed. Notice that the summation must be done in linearpower, not in dB. An example is given in Fig. 4 <strong>for</strong> a complextone consisting of the first 12 harmonics ofa 200-Hz fundamental,all components having equal amplitude. The derivationcould be made more accurate by taking into accounthetransmission characteristics of the outer <strong>and</strong> middle ear.IV. LIMITATIONSThe ERB values estimated here apply to young listenersat moderate sound levels. The ERB tends to increase withage (Patterson et al., 1982) <strong>and</strong> with increasing sound level(Weber, 1977; Pick, 1980}. The values will also vary some-what from one listener to another. The assumption of <strong>filter</strong>symmetry is probably only va/id at moderate sound levels(Patterson <strong>and</strong> Nimmo-Smith, 1980}. With increasing soundlevel the low-frequency slope of the <strong>filter</strong> becomeshallower<strong>and</strong> the high-frequency slope become somewhat steeper.Note that these changes are the opposite way round fromthose in excitation patterns. [The reason <strong>for</strong> this can be illustratedby Fig. 3; the high-frequency side of the excitationpattern (points d <strong>and</strong> e in the lower half) is determined by thelow-frequency slopes of <strong>filter</strong>s with center frequencies abovethat of the stimulus.] Further work is needed to quantifythese changes be<strong>for</strong>e excitation patterns can be derived overa wide range of levels. The method of deriving excitationpatterns from <strong>filter</strong> shapes, unlike the more "direct" methodsusing masked audiograms, is not affected by combinationtone detection (Greenwood, 1971} or by off-frequencylistening {Patterson, 1976; Verschuure, 1978).All of the estimates of <strong>filter</strong> shape <strong>and</strong> ERB described inthis paper were derived <strong>for</strong> simultaneous masking. Thus theresults do not reflect the influence of suppression (Houtgast,1974). Suppression will have the effect of sharpening the <strong>filter</strong>shape derived in nonsimultaneous masking (H0utgast,1977; Moore <strong>and</strong> Glasberg, 1981), <strong>and</strong> correspondinglyof sharpening excitation patterns (Moore <strong>and</strong> Glasberg,1982). The degree of sharpening may vary with stimulustype, <strong>and</strong> is not predictable on the basis of linear <strong>filter</strong>ingIGlasberg et al., 1983).ACKNOWLEDGMENTSWe are grateful to Roy Patterson <strong>and</strong> Ian Nimmo-Smith <strong>for</strong> many helpful discussions, <strong>and</strong> <strong>for</strong> the use of theircomputer programs. Roy Patterson provided constructivecriticism of an earlier version of this paper. We thank LorraineEvans <strong>for</strong> typing the manuscript <strong>and</strong> Roy Hammans<strong>for</strong> help with the figures. This work was supported by theMedical Research Council.Fidell, S., Horonjeff, R., Teffeteller, S., <strong>and</strong> Green, D. M. (1983)."Effectivemasking b<strong>and</strong>widths at low frequencies," J. Acoust. Soc. Am. 73, 628-638 0983}.Fletcher, H. (1940)."<strong>Auditory</strong> patterns," Rev. Mod. Phys. 12, 47-65.Glasberg, B. R., Moore, B.C. J., <strong>and</strong> Nimmo-Smith, I. 11983}. "Comparisonof auditory <strong>filter</strong> shapes derived with three different maskers,"J.Acoust. Soc. Am. {submitted}.Greenwood, D. D. (1971)."Aural combination tones <strong>and</strong> auditory masking,"J. Acoust. Soc. Am. $0, 502-543.Houtgast, T. (1974}."Lateral suppression in hearing," thesis, Free Universityof Amsterdam {Academische Pers, B. V., Amsterdam).Houtgast, T. (1977)."<strong>Auditory</strong>-<strong>filter</strong> characteristics derived from directmaskingdata <strong>and</strong> pulsation-threshold data with a rippled-noise masker,"J. Acoust. Soc. Am. 62, 409-415.Maiwaid, D. {1967}. "Die Berechnung yon Modulationsschwellen mit Hilfeeines Funktionsschemas," Acustica 18, 193-207.Moore, B.C. J (1982)..4 n Introduction to the Psychology of Hearing, 2rid. ed.{Academic, London}.Moore, B.C. J., <strong>and</strong> G!asberg, B. R. 11981}. "<strong>Auditory</strong> <strong>filter</strong> shapes derivedin simultaneous <strong>and</strong> <strong>for</strong>ward masking," J. Acoust. Soc. Am. 70, 1003-1014.Moore, B.C. J., <strong>and</strong> Glasberg, B. R. (1982}."Interpretingthe role of suppressionin psychophysical tuning curves," J. Acoust. Soc. Am. 72, 1375-1379.Patterson, R. D. (1976)."<strong>Auditory</strong> <strong>filter</strong> shapes derived with noise stimuli,"J. Acoust. Soc. Am. 59, 640-654.Patterson, R. D., <strong>and</strong> Nimmo-Smith, I. (1980)."Off-frequencylistening <strong>and</strong>auditory-<strong>filter</strong> asymmetry," J. Acoust. Soc. Am. 67, 229-245.Patterson, R. D., Nimmo-Smith, I., Weber, D. L., <strong>and</strong> Milroy, R: (1982)."The deterioration of hearing with age: Frequency selectivity, the criticalratio, the audiogram <strong>and</strong> speech threshold," J. Acoust. Soc. Am. 72,1788-1803.Pick, G. F. (1980}."Level dependence of psychophysical frequency resolution<strong>and</strong> auditory <strong>filter</strong> shape," J. Acoust. Soc. Am. 68, 1085-1095.Plomp, R. (1976)..4spects of Tone Sensation (Academic, London}.Scharf, B. {1970)."Critical b<strong>and</strong>s," in Foundations of Modern •quditory Theory,Vol. I, edited by J. V. Tobias {Academic, New York}.Shailer, M. J., <strong>and</strong> Moore, B.C. J. (1983}."Gap detection as a function offrequency, b<strong>and</strong>width, <strong>and</strong> level," J. Acoust. Soc. Am. 74, 467-473(1983).Verschuure, J. (1978)."<strong>Auditory</strong> excitation patterns," thesis, Erasmus University,Rotterdam (W. D. Meinema, B. ¾., Delft).Weber, D. L. {1977)."Growth of masking <strong>and</strong> the auditory <strong>filter</strong>," J.Acoust. Soc. Am. 62, 424-429.Zwicker, E., <strong>and</strong> Feidtkeller, R. (1967). Das Ohrals Nachrichtenempfanger(Hirzel, Stuttgart}.Zwicker, E., Fiottorp, G., <strong>and</strong> Stevens, S.S. (1957)."Critical b<strong>and</strong>width inloudness summation," J. Acoust. Soc. Am. •9, 548-557.Zwicker, E., <strong>and</strong> Scharf, B. {1965)."A model of loudnes summation,"Psych. Rev. 72, 3-26.Zwicker, E., <strong>and</strong> Terbardt, E. •1980)."Analytical expressions <strong>for</strong> criticalb<strong>and</strong>rate <strong>and</strong> critical b<strong>and</strong>width as a function of frequency," J. Acoust.Soc. Am. 68, 1523-1525.753 J. Acoust. Sec. Am.. VoL 74, No. 3, September 1983 B.C.J. Moore <strong>and</strong> B. R. Glasberg: <strong>Auditory</strong>-<strong>filter</strong> b<strong>and</strong>widths 753wnloaded 10 May 2010 to 200.39.9.109. Redistribution subject to ASA license or copyright; see http://asadl.org/journals/doc/ASALIB-home/info/terms.js