linear Prediction: A Tutorial Review
linear Prediction: A Tutorial Review
linear Prediction: A Tutorial Review

You also want an ePaper? Increase the reach of your titles
YUMPU automatically turns print PDFs into web optimized ePapers that Google loves.
5 64whereis the autocorrelation function of the signal s,. Note thatR(i) is an even function of i, i.e.,R(- i) = R(i). (15)Since the coefficients R(i - k) form what often is known asan autocorrelation matrix, we shall call this method theautocorrelation method. An autocorrelation matrix is a symmetricToeplitz matrix. (A Toeplitz matrix is one where allthe elements along each diagonal are equal [42].)In practice, the signal s, is known over only a finite interval,or we are interested in ,the signal over only a finite interval.One popular method is to multiply the signal s, by a windowfunction w, to obtain another signal s; that is zero outsidesomeinterval O
566 PROCEEDINGS OF THE IEEE, APRIL 1975ficiently by the squareqoot or Cholesky decompositionmethod [311, 1391, (591, [1101. This method requiresabout half the computation p3/6 + O(p2) and about half thestorage p2/2 of the general methods. The numerical stabilityproperties of this method are well understood [ 1091, [ 11 11 ;the method is considered to be quite stable.Further reduction in storage and computation time is possiblein solving the autocorrelation normal equations (12) becauseof their special form. Equation (12) can be expandedin matrix form as(37)Note that the p X p autocorrelation matrix is symmetric andthe elements along any diagonal are identical (i.e., a Toeplitzmatrix). Levinson [61] derived an elegant recursive procedurefor solving this type of equation. The procedure was later reformulatedby Robinson [85]. Levinson’s method assumesthe column vector on the right hand side of (37) to be a generalcolumn vector. By making use of the fact that this columnvector comprises the same elements found in the autocorrelationmatrix, another method attributed to Durbin [25]emerges which is twice as fast as Levinson’s. The methodrequires only 2p storage locations and p2 + O(p) operations:a big saving from the more general methods. Durbin’s recursiveprocedure can be specified as follows:as the normalized autocorrelation coefficients r(i):(39)which have the property that I r(i)l< 1. This can be useful inthe proper application af scaling to a fixed point solution to(37).A byproduct of the solution in (38) is the computation ofthe minimum total error Ei at every step. It can easily beshown that the minimum error Ei decreases (or remains thesame) as the order of the predictor increases [ 61 ] . Ei is nevernegative, of course, since it is a squared error. Therefore, wemust have0 < Ei Q Ei-1, Eo = R(0). (40)If the autocorrelation coefficients are normalized as in (39),then the minimum error Ei is also divided by R(0). We shallcall the resulting quantity the normalized error Vi:From (40) it is clear thatOGViG1, i>O. (42)Also, from (38d) and (41), the final normalized error Vp isPVp = n (1 - k;). (43)i= 1The intermediate quantities kt, 1 < i < p , are known as thereflection coefficients. In the statistical literature, they areknown as partial correlation coefficients [ 61, [ 171. ki can beinterpreted as the (negative) partial correlation between s, andS,+i h~ldings,,~, * * * ,s,+im1 fixed. The use of the term “reflectioncoefficient” comes from transmission line theory,where ki can be considered as the reflection coefficient at theboundary between two sections with impedances Zi and Zi+ 1 .ki is then given byEquations (38b)-(38d) are solved recursively for i = 1, 2,* - , p . The final solution is given byThe transfer function H(z) can then be considered as that of asequence of these sections with impedance ratios given from(44) byai = ai(P), 1 G ~GP. We)Note that in obtaining the solution for a predictor of order p ,one actually computes the solutions for all predictors of orderless than p. It has been reported [78] that this solution isnumerically relatively unstable. However, most researchershave not found this to be a problem in practice.It should be emphasized that, for many applications, thesolution of the normal equations (12) or (18) does not formthe major computational load. The computation of the autocorrelationor covariance coefficients require pN operations,which can dominate the computation time if N >> p, as isoften the case.The solution to (37) is unaffected if all the autocorrelationcoefficients are scaled by a constant. In particular, if all R(i)are normalized by dividing by R(O), we have what are knownThe same explanation can be given for any type of situationwhere there is plane wave transmission with normal incidencein a medium consisting of a sequence of sections or slabs withdifferent impedances. In the case of an acoustic tube with psections of equal thickness, the impedance ratios reduce to theinverse ratio of the consecutive cross-sectional areas. Thisfact has been used recently in speech analysis [ 101 , [521,[97]. Because of the more familiar “engineering interpretation’’for ki, we shall refer to them in this paper as reflectioncoefficients.2) Iterative Methods: Beside the direct methods for thesolution of simultaneous <strong>linear</strong> equations, there exist a numberof iterative methods. In these methods, one begins by aninitial guess for the solution. The solution is then updated byAuthorized licensed use limited to: Escuela Superior de Ingeneria Mecanica. Downloaded on November 26, 2009 at 20:06 from IEEE Xplore. Restrictions apply.
MAKHOUL: LINEAR PREDICTION 567adding a correction term that is usually based on the gradientof some error criterion. In general, iterative methods requiremore computation to achieve a desired degree of convergencethan the direct methods. However, in some applications[ 1001 one often has a good initial guess, which might leadto the solution in only a few iterations. This can be a bigsaving over direct methods if the number of equations is large.Some of the iterative methods are the gradient method, thesteepest descent method, Newton’s method, conjugate gradientmethod and the stochastic approximation method [ 811 ,[1081.Up till now we have assumed that the whole signal is givenall at once. For certain real time applications it is useful tobe able to perform the computations as the signal is coming in.Adaptive schemes exist which update the solution based onevery new observation of the signal [ 1061. The update isusually proportional to the difference between the new observationand the predicted value given the present solution.Another application for adaptive procedures is in the processingof very long data records, where the solution might convergelong before all the data is analyzed. It is worth notingthat Kalman filtering notions [ 561 are very useful in obtainingadaptive solutions [ 601 .3) Filter Stability: After the predictor parameters are computed,the question of the stability of the resulting filterH(z) arises. Filter stability is important for many applications.A causal all-pole filter is stable if all its poles lie inside the unitcircle (in which case it is also a filter with minimum phase).The poles of H(z) are simply the roots of the denominatorpolynomial A(z), whereDas follows:Ai(z) = Ai- (z) + ki z-’Ai- (z-’ ) (49)which is the same as the recursion in (38c).The positive definiteness of R(i) can often be lost if one usesa small word length to represent R(i) in a computer. Also,roundoff errors can cause the autocorrelation matrix to becomeillconditioned. Therefore, it is often necessary to checkfor the stability of H(z). Checking if the roots of A(z) areinside the unit circle is a costly procedure that is best avoidedOne method is to check if all the successive errors are positive.In fact, the condition Ei > 0, 1 Q i Q p , is a necessary andsufficient condition for the stability of H(z). From (38d)and(40) it is clear that an equivalent condition for the stabilityof H(z) is thatIki(
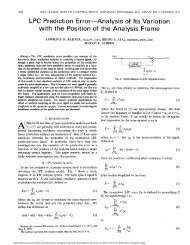
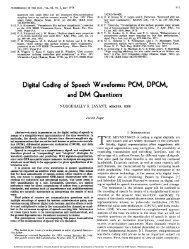
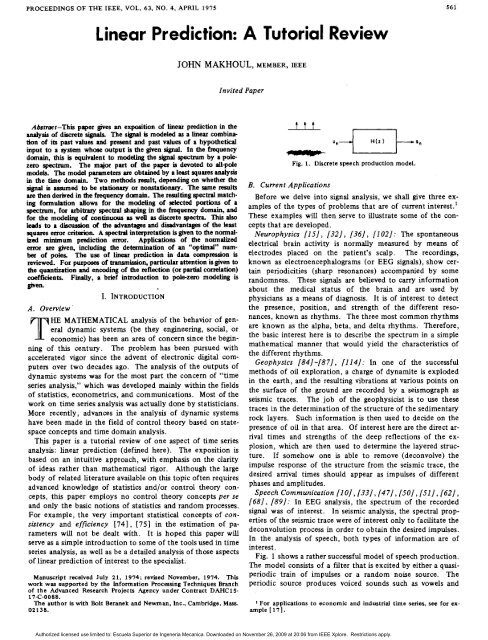
Authorized licensed use limited to: Escuela Superior de Ingeneria Mecanica. Downloaded on November 26, 2009 at 20:06 from IEEE Xplore. Restrictions apply.MAKHOUL: LINEAR PREDICTION 569FREQUENCY (kHz1Fig. 3. A 28-pole fit to an FFT-computed signal spectrum. Thewas sampled at 20 kHz.spectra, i.e., i (0) =R(O), wheresignal1,A I nR(i) = - 25r ?(a) cos (iw) dw. (63)Note that Rh(i) is the autocorrelation of the impulse responseof H(z), which is given by (31) and (32). As then, the gain iscomputed from (35).The manner in which the model spectrum p(w) approximatesP(w) is largely reflected in the relation between the yrrespondingautocorrelation functio%s. From (34), we have R(i) = R(i),0 < i < p . Since P(w) and P(w) are Fourier transforms of R(i)and Rh(i), respectively, it follows that increasing the value ofthe trder of the model p increases the rangeAover which R(i)and R(i) are equal, rEsulting in a better fit of P(w) to P(w). Inthe limit, asp -+ 00, R(i) becomes identical to R(i) for all i, andhence the two spectra become identical:?(a) = ~ (w), as p +. 00. (64)This statement says that we can approximate any spectrumarbitrarily closely by an all-pole model.Another important conclusion is that since <strong>linear</strong> predictiveanalysis can be viewed as a process of spectrum or autocorrelationmatching, one must be careful how to estimate the spectrumP(w) or the corresponding autocorrelation that is to bemodeled. Since the signal is often weighted or windowed' beforeeither the autocorrelation or the spectrum is computed, itcan be quite important to properly choose the type and widthof the data window to be used. The choice of window dependsvery much on the type of signal to be analyzed. If thesignal can be considered to be stationary for a long period oftime (relative to the effective length of the system impulseresponse), then a rectangular window suffices. However, forsignals that result from systems that are varying relativelyquickly, the time of analysis must necessarily be limited. Forexample, in many transient speech sounds, the signal can beconsidered stationary for a duration of only one or two pitchperiods. In that case a window such as Hamming or Hanning[ 141 is more appropriate. See [ 131, [ 141, [ 261, [ 541, [ 641,[ 991, [ 1011 for more on the issue of windowing and spectralestimation in general.An example of <strong>linear</strong> predictive (LP) spectral estimation isshown in Fig. 3, where the original spectrum P(o) was obtainedby computing the fast Fourier transform (FFT) of a20-ms, Hamming windowed, 20-kHz sampled speech signal.'Note that here we are discussing datu windows whichdirectly to the signal, as opposed to log windows, whichhave traditionally applied to the autocorrelation.are appliedstatisticiansThe speech sound was the vowel [z] as in the word "bat."The harmonics due to the periodicity of the sound are evidentin the FFT spectrum. Fig. 3 also shows a 28-pole fit ( p = 28)to the signal spectrum. In this case the autocorrelation coefficientsneeded to solve the normal equations (12) were compeddirectly from the time signal. The all-pole spectrumP(o) was computed from (60) by dividing GZ by the magnitudesquared of the FFT of the sequence: lkal, uz , * * , ap.Arbitrary frequency resolution in computing P(w) can be obtainedby simply appending an appropriate number of zeros tothis sequence before taking the FFT. An alternate method ofcomputing p(w) is obtained by rewriting (60) aswhereP(w) =p-ik =Op(O) + 2Pi=1GZp(i) cos (iw)p(i) = akok+i, uo = 1, O< i< pis the autocorrelation of- the impulse response offilter A(z). From (65), p(w) can be computed by dividing G2by the real part of the FFT of the sequznce: p(O), 2p(l),2p(2), .. , 2p(p). Note that the slope of P(w) is always zeroato=Oandw=n.Another property of P(w) is obtained by noting that theminimum error E, = GZ, and, therefore, from (62) we have(This relation is a special case of a more general result (48) relatingthe fact that the polynomials Ao(z), A 1 (z), * * * ,Ap(z), . . * , form a complete set of orthogonal polynomialswith weight P(w).) Equation (67) is true for all values of p. Inparticular, it is true as p -+ 00, in which case from (64) we seethat (67) becomes an identity. Another important case where(67) becomes an identity is when P(w) is an all-pole spectrumwith po poles, then P(w) will be identical to P(w) for allp > po. Relation (67) will be useful in discussing the propertiesof the error measure in Section IV.Thz transfer functions S(z) and H(z) corresponding to P(w)and P(wj are also related. It can be shown [ 621 that as p +. 00,H(z) is given byk=lN-1where h,(n), 0 < n < N - 1, is the minimum phase sequencecorresponding to s,, 0 < n < N - 1. Note that the minimumphase sequence is of the same length as the original signal.Fig. 4 shows a signal (N = 256) and its approximate minimumphase counterpart, obtained by first performing a LP analysisfor p = 250, and then computing the sequence h(n) by longdivision.C. Selective Linear <strong>Prediction</strong>The major point of the previous section was that LP analysiscan be regarded as a method of spectral modeling. We hadtacitly assumed that the model spectrum spans the same frequencyrange as the signal spectrum. We now generalize the
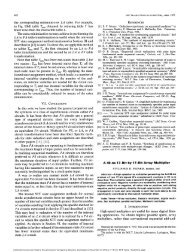
570 PROCEEDINGS OF THE IEEE. APRIL 1975Jt(b)Fig. 4. (a) A 256Bample windowed speech signal. (b) The correspondingapproximate minimum phase sequence obtained using a <strong>linear</strong>predictor of order p = 250.FREQUENCY (kHz1Fig. 5. Application of selective <strong>linear</strong> prediction to the same signalspectrum as in Fig. 3, with a 14-pole fit to the 0-5 kHz region and a5-pole fit to the 5-10 kHz region.LP spectral modeling method to the case where we wish to fitonly a selected portion of a given spectrum.Suppose we wish to model the spectrum P(w) only in theregion* w, < w < wp by an all-pole spectrum given by (60).Call the signal spectrum in that region P’(w), In order to computethe parameters of the model spectrum P(w), we first performa <strong>linear</strong> mapping of the given region onto the upper halfof the unit circle in the z plane. This can be accomplished bythe mapping w’ = n(w - oa)/(op - ma), so that the given regionis mapped onto 0 < o’ < A. In addition, let f”(-~’) =F(w’) define the spectrum over the lower half of the unitcircle. The model parameters are then computed from thenormal equations (12), where the autocorrelation coefficientsare obtained by a Fourier transform with P’(w’) replacingP(w) and w’ replacing w in (56).Selective <strong>linear</strong> prediction has had applications in speechrecognition and speech compression [63]. An example of itsusage is shown in Fig. 5. For speech recognition applications,the 0-5 kHz region is more important than the 5-10 kHz.Even when the 5-10 kHz region is important, only a roughidea of the shape of the spectrum is sufficient. In Fig. 5, thesignal spectrum is the same as in Fig. 3. The 0-5 kHz region ismodeled by a 14-pole spectrum, while the 5-10 kHz region ismodeled independently by only a 5-pole model.An important point, which should be clear by now, is thatsince we assume the availability of the signal spectrum P(w),any desired frequency shaping or scaling can be performed directlyon the signal spectrum before <strong>linear</strong> predictive modelingit3 applied.D. Modeling Discrete SpectraThus far we have assumed that the spectrum P(o) is a continuousfunction of frequency. More often, however, thespectrum is known at only a finite number of frequencies. Forexample, FFTderived spectra and those obtained from manycommercially available spectrum analyzers have values atequally spaced frequency points. On the other hand, filterbank spectra, and, for example, third-octave band spectrumanalyzers have values at frequencies that are not necessarilyequally spaced. In order to be able to model these discretespectra, only one change in our analysis need be made. Theerror measure E in (62) is defined as a summation instead ofan integral. The rest of the analysis remains the same exceptthat the autocorrelation coefficients R(i) are now computedfrom1 M-1R(i) = - P(w,) cos (iw,) (69)Mm=0where M is the total number of spectral points on the unitcircle. The frequencies w, are those for which a spectralvalue exists, and they need not be equally spaced. Below wedemonstrate the application of LP modeling for filter bankand harmonic spectra.Fig. 6(a) shows a typical 14-pole fit to a spectrum of thefricative [SI that was FFT computed from the time signal.Fig. 6(b) shows a similar fit to a line spectrum that is typical offilter bank spectra. What we have actually done here is tosimulate a filter bank where the filters are <strong>linear</strong>ly spaced upto 1.6 kHz and logarithmically spaced thereafter. Note thatthe all-pole spectrum for the simulated filter bank is remarkablysimilar to the one in the top figure, even though the number ofspectral points is much smaller.The dashed curve in Fig. 7(a) is a 14-pole spectrum. If oneapplied LP analysis to this spectrum, the all-pole model forp = 14 would be identical to the dashed spectrum. The situationis not so favorable for discrete spectra. Let us assume thatthe dashed spectrum corresponds to the transfer function of a14-pole filter. If this filter is excited by a periodic train of impulseswith fundamental frequency Fo, the spectrum of theoutput signal will be a discrete line spectrum with spectralvalues only at the harmonics (multiples of Fo). The line spectrumfor Fo = 312 Hz is shown in Fig. 7(a). Note that thedashed spectrum is an envelope of the harmonic spectrum.The result of applying a 14-pole LP analysis to the harmonicspectrum is shown as the solid curve in Fig. 7(a). The discrepancybetween the two all-pole spectra is obvious. In general,the types of discrepancies that can occur between themodel and original spectra include merging or splitting of polepeaks, and increasing or decreasing of pole frequencies andbandwidths. Pole movements are generally in the direction ofthe nearest harmonic. As the fundamental frequency decreases,these discrepancies decrease, as shown in Fig. 7(b) forFo = 156 HZ.It is important to note in Fig. 7 that the dashed curve is theonly possible 14-pole spectrum that coincides with the linespectrum at the harmonics.’ It is significant that the all-polespectrum resulting from LP modeling does not yield the spectrumwe desire. The immediate reason for this is that the solutionfor the model parameters from (12) depends on the valuesof the signal autocorrelation, which for the periodic signal are*The remainder of the spectrum is simply neglected.91n general this is true only if the period between input impulsesgreater than twice the number of poles in the filter.isAuthorized licensed use limited to: Escuela Superior de Ingeneria Mecanica. Downloaded on November 26, 2009 at 20:06 from IEEE Xplore. Restrictions apply.
MAKHOUL: LINEAR PREDICTION 57 1Flh- t rw(b)Fig. 6. Application of LP modeling to a filter bank spectrum. (a) A14-pole fit to the original spectrum. (b) A 14-pole fit to the simulatedfdter bank spectrum.strengths and weaknesses in order to be able to fully utilize itscapabilities. The analysis will be restricted to the stationary(autocorrelation) case, although the conclusions can be extrapolatedto the nonstationary (covariance) case.The error measure used in Section 11-B to determine the predictorparameters is the least squares error measure due toGauss, who first reported on it in the early 1800's. This errormeasure has been used extensively since then, and is quite wellunderstood. Its major asset is its mathematical tractability.Its main characteristic is that it puts great emphasis on largeerrors and little emphasis on small errors. Purely from thetime domain, it is often difficult to say whether such an errormeasure is a desirable one or not for the problem at hand.Many would probably agree that it does not really matterwhich error measure one uses as long as it is a reasonable functionof the magnitude of the error at each point. For the <strong>linear</strong>prediction problem, we are fortunate that the error measurecan also be written in the frequency domain and can be interpretedas a goodness of fit between a given signal spectrumand a model spectrum that approximates it. The -insightsgained in the frequency domain should enhance our understandingof the least squares error criterion.-8..FREaEtcI (KHz1(a)A. The Minimum ErrorFor each value of p, minimization of the error measure E in(62) leads to the minimum error Ep in (13), which is given interms of the predictor and autocorrelation coefficients. Herewe derive an expression for Ep in the frequency domain, whichwill help us determine some of its properties. Other propertieswill be discussed when we discuss the normalized minimumerror.Letbe the zeroth coefficient (quefrency) of the cepstrum (inverseFourier transform of log spectrum) [381, [77] correspondingto p(w). From (60), (70) reduces toww22se interpreted as the geometricmean of the model spectrum P(w). From (40) we know thatEp decreases as p increases. The minimum occurs as p +. m,and is equal toEmin =E, = e', (73)where co is obtained by substituting P(w) for B(o) in(70).1°Therefore, the absolute minimum error is a function of P(o)only, and is equal to its geometric mean, which is always positivefor positive definite spectra." This is a curious result,because it says that the minimum error can be nonzero evenlo If P(w) is a p ,-pole spectrum then Ep = Emin for all p 3 p, ."E- is equal to zero only if P(w) IS zero over a noncountable setof frequencies (i.e., over a line segment). In that case, the signal isperfectly predictable and the prediction error is zero [ 107 1.Authorized licensed use limited to: Escuela Superior de Ingeneria Mecanica. Downloaded on November 26, 2009 at 20:06 from IEEE Xplore. Restrictions apply.
572 PROCEEDINGS OF THE IEEE, APRIL 1975hwhen the matching spectrum P(w) is identical to the matchedspectrum P(w). Therefore, although Ep is a measure of fit ofthe model spectrum to the signal spectrum, it is not an absoluteone. The measure is always relative to Emin. The nonzeroaspect of Emin can be understood by realizing that, for any p,Ep is equal to that portion of the signal energy that is not predictableby a pth order predictor. For example, the impulseresponse of an all-pole filter is perfectly predictable except forthe initial nonzero value. It is the energy in this initial valuethat shows up in Ep. (Note that in the covariance method onecan choose the region of analysis to exclude the initial value,in which case the prediction error would be zero for thisexample.)B. Spectral Matching PropertiesThe LP error measure E in (62) has two major properties:”a global property and a local property.1) GlobalProperty: Because the contributions to the totalerror are determined by the ratio of the two spectra, thematching process should perform uniformly over the wholefrequency range, irrespective of the general shaping of thespectrum.This is an important property for spectral estimation becauseit makes sure that the spectral match at frequencies withlittle energy is just as good, on the average, as the match atfrequencies with high energy (se: Fig. 3). If the error measurehad been of the form I P(w) - P(w) I dw, the spectral matcheswould have been best at high energy frequency points.2) Local Property: This property deals with how the matchis done in each small region^ of the spectrum.Let the ratio of P(o) to P(o) be given byThen from (67) we have(74)E(w) can b,” interpreted as the “instantaneous error” betweenP(w) and P(w) at frequency w. Equation (75) says that thearithmetic mean of E(o) is equal to 1, which means that thereare values of E(w) greater and less than 1 such that the averageis equal to l.13 In terms of the two spectra, this means thatP(w) will be greater than $(a) in some regions and less inothers such that (75) applies. However, the-contribution to:he total error is more significant when P(o) is greater thanP(w) than when P(w) is smaller, e.g., a ratio of E(w) = 2 contributesmore to the total error than a ratio af 1/2. We concludethat:tfter the minimization of error, we expezt a better fit ofP(w) to P(w) where P(o) is greater than P(w), than whereP(w) is smaller (on the average).For example, ifP(w) is the power spectrum of a quasi-periodicsignal (such as in Fig. 3), then most of the energy in P(w) willexist in the harmonics, and very little energy will reside betweenharmonics. The error measure in (62) insures that theItakura [SO], [ 511 discusses a maximum likelihood error criterionhaving the same properties.I3Except for the special case when P(w) is all-pole, the conditionE(w)=lforallwktrueonlyasp-r=.approximation of p(w) to P(w) is far superior at the harmonicsthan between the harmonics. If the signal had been generatedby exciting a filter with a periodic sequence of impulses, thenthe system response of the filter must pass through all theharmonic peaks. Therefore, with a proper choice of the modelorder p, minimization of the LP error measure results in amodel spectrum that is a good approximation to that systemresponse. This leads to one characteristic of the local property:minimhization of the error measure E results in a model spectrumP(w) that is a good estimate of the spectral envelope ofthe signal spectrum P(o).Fig. 6 shows that this statement also applies in a qualitativeway when the excitation is random noise. It should be clearfrom the above that the importance of the local property isnot as crucial when the variations of the signal spectrum fromthe spectral envelope are much less pronounced.In the modeling of harmonic spectra, we showed an examplein Fig. 7(a) where, although the all-pole spectrum resultingfrom LP modeling was a reasonably good estimate of theharmonic spectral envelope, it did not yield the unique all-poletransfer function that coincides with the line spectrum at theharmonics. This is a significant disadvantage of LP modeling,and is an indirect reflection of another characteristic of thelocal property: the cancellation of errors. This is evident from(75) where the instantaneous errors E(o) are greater and lessthan 1 such that the average is 1. To help elucidate this point,let us define a new error measure E’ that is the logarithmof E in (62):where the gain factor has been omitted since it is not relevantto this discussion. It is simple to show that the minimizationof E’ is equivalent to the Tinbization of E. For cases whereP(w) is smooth relative to P(w) and thehvalues of P(o) are notexpected to deviate very much from P(o), the logarithm ofthe average of spectral ratios can be approximated by theaverage of the logarithms, i.e.,(77)From (72) it is clear that the contributips to the error whenP(w) > P(w) cancel those when P(o) < P(o).The above discussion suggests the use of an error measurethat takes the magnitude of the integrand in (77). One sucherror measure is1-[log P(w) - log B(w)l dw. (78)=G I,E” is just the mean squared error between the two log spectra.It has the important phroperty that the minimum error of zerooccurs if and only if P(w) is identical to P(w). Therefore, ifwe use (the discrete form of) E” in modeling the harmonicspectrum in Fig. 7(a), the resulting model spectrum (for p = 14)will be identical to the dashed spectrum, since the minimumerror of zero is achie;able by that spectrum. However, whilethe error measure E solves one problem, it introduces an-Authorized licensed use limited to: Escuela Superior de Ingeneria Mecanica. Downloaded on November 26, 2009 at 20:06 from IEEE Xplore. Restrictions apply.
QueryRank of the top snippet thatmatched the forum responseGCS Koders Krugle SNIFFget active editor window from eclipse workbench 2 2 2 1parse a java source and create ast 2 3 2 1connect to a database using jdbc 2 1 - 1display directory dialog from viewer in eclipse - 9 2 1read a line of text from a file 6 1 - 1return an audio clip from url 1 1 1 1execute SQL query 1 1 3 2return current selection from eclipse workbench 5 1 4 1Relevant snippet is top ranked (%) 25 62.5 12.5 87.5Relevant snippet is in top 5 hits (%) 75 87.5 75 100Relevant snippet is in top 10 hits (%) 87.5 100 75 100Table 6. Results from existing code search engines on user queries.on their sizes with the smaller snippets getting higher ranks. We compared theranks and sizes (in LOC) of the most relevant snippets with and without intersection/clustering.We also compared the amount of pruning obtained usingintersection.The results are shown in Table 7. The first column of the table gives thequeries. The next two columns give the rank of the most relevant code snippetwith and without intersection and clustering (denoted I/C and No I/C, respectively.)The next two columns give similar observations for the size of themost relevant snippet. The table shows that the rank and size of the returnedsnippet is better when intersection and clustering are turned on. In more thanhalf of the cases, the most relevant snippets are poorly ranked when intersectionis turned off. Intersection also reduces the size of resultant snippets by 34% onan average. Smaller size of snippet usually means less post-processing time onthe returned snippets required by the users.6 Other Related WorkA large fraction of the previous research, including Prospector [14] has focusedon user queries of the form T in → T out , where T in is a source object and T out isa destination object. These tools return code snippets that convert T in to T out ,using a sequence of API method calls. PARSEWeb [20] and XSnippet [17] aretwo more examples in this research direction.PARSEWeb [20] gathers the relevant code samples from GCS and performsa static analysis over them to answer the queries of type T in → T out . They alsosplit the query by introducing intermediate object types. The dynamic database(that of Google Code Search) together with the query splitting results in somereported improvements. XSnippet [17] makes use of context information alongwith a user query for finding relevant snippets. Their object instantiation queriescan be classified as type-based (from type T in to type T out ) or parent-based, whereparenthood is defined by the subclass-superclass relation.Although there is variation in the expressiveness of queries allowed by theseapproaches, the basic structure of the queries is still limited to object instan-
574 PROCEEDINGS OF THE APRIL 1975figure are plots of the normalized error versus the spectraldynamic range (in decibels) for 2-pole models of 200 differentspeech spectra. The solid curve in Fig. 9 is an absolute lowerbound on the geometric-to-arithmetic mean ratio for anyspectrum with a given dynamic range. The curve is a plot ofthe following relation [ 221 , [ 64 Jvu = y (’-7) (83)wherelog d7=77and Vu stands for the absolute lower bound on Vp for a givend. The overall impression from Fig, 9 is that the normalizederror generally decreases as the dynamic range of the spectrumincreases. This is apparent in Fig. 8 where Vp for the vowel[a] is less than that for the fricative [SI, and [a] has a muchhigher spectral dynamic range than [SI.2) A Measure of Ill-Conditioning: In solving the autocorrelationnormal equations (1 2), the condition of the autocorrelationmatrix is an important consideration in deciding theaccuracy of the computation needed. An illconditioned matrixcan cause numerical problems in the solution. An acceptedmeasure of illconditioning in a matrix is given by the ratiod’ = hmax/Xmh (85)where Amax and Amin are the maximum and minimum eigenvaluesof the matrix [ 27 J , [ 8 11 . Grenander and Szego [ 4 1 1,[42] have shown that all the eigenvalues of an autocorrelationmatrix lie in the range hi E [H, L] , 1 < i < p , where H and Lare defined in (82). In addition, as the order of the matGx pincreases, the eigenvalues become approximately equal to P(w)evaluated at equally spaced points with separation 2n/(p + 1).Therefore, the ratio d’ gizen in (85) can be well approximatedby the dynamic range of P(w):d’ Z d. (86)Therefore, the spectral dynamic range is a good measure of theill-conditioning of the autocorrelation matrix. The larger thedynamic range, the greater is the chance that the matrix is illconditioned.But in the previous section we noted that an increase in dusually results in a decrease in the normalized error Vp. Therefore,Vp can also be used as a measure of ill-conditioning: theill-conditioning is greater with decreased Vp. The problem becomesmore and more serious as Vp + 0, i.e., as the signalbecomes highly predictable.If ill-conditioning occurs sporadically, then one way ofpatching the problem is to increase the values along the princi-.pal diagonal of the matrix by a small fraction of a percent.However, if the problem is a regular one, then it is a good ideaif one can reduce the dynamic range of the signal spectrum.For example, if the spectrum has a general slope, then a singlezerofilter of the form 1 + nz-’ applied to the signal can bevery effective. The new signal is given bys:, =s, +USn-’. (87)An optimal value for n is obtained by solving for the filterA(z) that “whitens” (flattens) s;. This is, of course, given bythe first order predictor, whereR( 1) and R(0) are autocorrelation coefficients of the signal s,.The filtered signal s; is then guaranteed to have a smallerspectral dynamic range. The above process is usually referredto as preemphasis.One conclusion from the above concerns the design of thelow-pass filter that one uses before sampling the signal to reducealiasing. In order to ensure against aliasing, it is usuallyrecommended that the cutoff frequency of the filter be lowerthan half the sampling frequency. However, if the cutoff frequencyis appreciably lower than half the sampling frequency,then the spectral dynamic range of the signal spectrum increases,especially if the fiiter has a sharp cutoff and the stopband is very low relative to the pass band. This increasesproblems of ill-conditioning. Therefore, if one uses a lowpassfilter with a sharp cutoff, the cutoff frequency should be setas close to half the sampling frequency as possible.D. Optimnl Number of PolesOne of the important decisions that usually has to be madein fitting of all-pole models is the determination of an “optimal”number of poles. It is a nontrivial exercise to define the word“optimal” here, for as we have seen, the fit of the model“improves” as the number of poles p increases. The problemis where to stop. Clearly we would like the minimum value ofp that is adequate for the problem at hand, both to reduce ourcomputation and to minimize the possibility of ill-conditioning(which increases with p since V, decreases).If the signal spectrum is an all-pole spectrum with po poles,then we know that Vp = Vp,, p 2 po, and k,= 0, p > po, i.e.,the error curve remains flat for p > po. Therefore, if we expectthe signal spectrum to be an all-pole spectrum, a simpletest to obtain the optimal p is to check when the error curvebecomes flat. But, if the signal is the output of a po-pole filterwith white noise excitation, then the suggested test will notwork, because the estimates of the poles are based on a finitenumber of data points and the error curve will not be flat forp > po. In practice, however, the error curve will be almostflat for p > po. This suggests the use of the following thresholdtestThis test must succeed for several consecutive values beforeone is sure that the error curve has actually flattened out.The use of the ratio V,,,/V, has been an accepted methodin the statistical literature [ 61 , [ 171 , [ 1121 for the determinationof the optimal p. The test is based on hypothesis testingprocedures using maximum likelihood ratios. A critical reviewof hypothesis testing procedures has been given recently byAkaike [ 51. Akaike’s main point is that model fitting is aproblem where multiple decision procedures are requiredrather than hypothesis testing. The fitting problem should bestated as an estimation problem with an associated measure offit. Akaike suggests the use of an information theoretic criterionthat is an estimate of the mean log-likelihood [3],[SI .14 This is given byI( p) = - 2 log (maximum likelihood) + 2p. (90)The value of p for which I(p) is minimum is taken to be theoptimal value. In our problem of all-pole modeling, if weassume that the signal has a Gaussian probability distribution,[I=-- R(1)(88) I4An earlier criterion used by Akaike is what he &led the ‘‘final pre-R(0)‘diction error” [ 1 1, [ 2 1, [ 37 1.Authorized licensed use limited to: Escuela Superior de Ingeneria Mecanica. Downloaded on November 26, 2009 at 20:06 from IEEE Xplore. Restrictions apply.
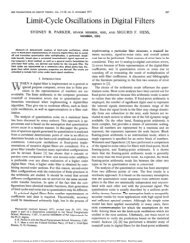
Authorized licensed use limited to: Escuela Superior de Ingeneria Mecanica. Downloaded on November 26, 2009 at 20:06 from IEEE Xplore. Restrictions apply.MAKHOUL: LINEAR PREDICTION 5150.010 2 4 6 8 10 12 14 16 18 20NUMBER OF POLES pFig. 10. A plot of Akaike’s information criterion versus the order ofthe predictor p. Here, Z(p) = 10 log,, Vp + (8.686p/O.4N), (N=200, Hamming windowed). The “optimal” value of p occurs at theminimum of I(p), shown by the arrow at p = 10.then (90) reduces to (neglecting additive constants and dividingbyN) [a], 1171, [5112PZ( p) = log vp + -Newhere Ne is the “effective” number of data points in the signal.The word “effective” is used to indicate that one must compensatefor possible windowing. The effective width of awindow can be taken as the ratio of the energy under thewindow relative to that of a rectangular window. For example,for a Hamming window, Ne = 0.4N.Note that the first term in (91) decreases as a function of p ,and the second term increases. Therefore, a minimum canoccur. In practice, there are usually several local minima, thenthe value of p corresponding to the absolute minimum of Z(p)is taken as the optimal value. Usually Z(p) is computed up tothe maximum value of interest,” and the minimum of Z(p) isfound in that region.Fig. 10 shows an example of the application of Akaike’scriterion. The dotted curve is the usual error curve and thesolid curve is a plot of Z(p) in (91) multiplied by 10 loglo e toobtain the results in decibels. In Fig. 10, the optimal predictororder is p = 10. Note that Z(p) for p > 10 slopes upward,but very gently. This indicates that the actual absoluteminimum is quite sensitive to the <strong>linear</strong> term in (91). In practice,the criterion in (91) should not be regarded as an absolute,because it is based on several assumptions which mightnot apply for the signal of interest. For example, the assumptionsof uncorrelated noise excitation and Gaussian distributionsmight not hold. Therefore, the experimenter should feelfree to adjust the criterion to suit one’s application. Onesimple way of “tuning” the criterion is to multiply Ne by anappropriate factor.V. DATA COMPRESSION BY LINEAR PREDICTIONThe methods outlined in Section I1 for the modeling of thebehavior of a signal can be very useful in data compression.The process of signal or system modeling is essentially one ofredundancy removal, which is the essence of data compression.-16The idea of attempting to predict the value of a signal fromprevious sample values has been labeled in communications as“predictive coding” [ 281 . Adaptive <strong>linear</strong> prediction has beenused extensively in speech and video transmission [ 71, [9],[231,[,MI,[SO],[57],[83]. For the purposes oftransmissionone must quantize and transmit the predictor parametersor some transformation thereof. It has been known for sometime that the quantization of the predictor parameters themselvesis quite inefficient since a large number of bits is requiredto retain the desired fidelity in the reconstructed signalat the receiver [ 721. Below, several equivalent representationsof the predictor are presented and their quantization propertiesare discussed. We shall continue to assume that H(z) isalways stable, and hence minimum phase. A(z) is, of course,then also minimum phase.A. Alternate Representations of Linear PredictorThe following is a list of possible sets of parameters thatcharacterize uniquely the all-pole filter H(z) or its inverse A(z).1) (a) Impulse response of the inverse filter A(z), i.e., predictorparameters ak, 1 Q k < p.(b) Impulseresponse of the all-pole model h,, 0 < n < p ,which is defined in (30). Note that the first p + 1 coefficientsuniquely specify the filter.2) (a) Autocorrelation coefficients of ak, p(i), 0 Q i < p, asdefined in (66).(b) Autocorrelation coefficients of h,, Rh(i), 0 Q i < p , asdefined in (31) and (32).3) Spectral coefficients of A(z), ri, 0 Q i Q p (or equivalentiyspectral coefficients of ~(z), c2/ri):P2mJri = p(o) + 2 p(j) COS - OQiGp (92)i-1 2p+1’where p(i) are as defined in (66). In other words, (ri) is obtainedfrom {p(i)} by a discrete Fourier transform.4) Cepstral coefficients of A@), c,, 1 Q n Q p (or equivalentlycepstral coefficients of H(z), - c,):log A(eiw) einw dw. (93)Since A(z) is minimum phase, (93) reduces to [381, [771Equation (94) is an iterative method for the computationof the cepstral coefficients directly from the predictorcoefficients.5) Poles of H(z) or zeros of A(z), zk, 1 < k ( p, where(zk} are either real or form complex conjugate pairs. Conversionof the roots to the s plane can be achieved by setting eachroot zk = eSkT, where sk = (7k + jwk is the corresponding polein the s plane, and T is the sampling period. If the root zk =Zkr + jzkj, then1 zkiwk = - arctan -T ZkrIs Akaike informed me that he usually recommends pmax < 3N’I’ asthe maximum value of p that should be used if one is interested in a where Zkr and zki are the and parts Of ‘k*reliableestimate. respectively.
Authorized licensed use limited to: Escuela Superior de Ingeneria Mecanica. Downloaded on November 26, 2009 at 20:06 from IEEE Xplore. Restrictions apply.516 PROCEEDINGS OF THE 19756) Reflection coefficients ki, 1 < i Gp, which are obtainedas a byproduct of the solution of the autocorrelation normalequations, as in (38), or from the backward recursion (51).Some of the preceding sets of parameters have p + 1 coefficientswhile others have only p coefficients. However, for thelatter sets the gain G needs to be specified as well, thus keepingthe total number of parameters asp + 1 for all the cases.For purposes of data transmission, one is usually interestedin recovering the predictor coefficients from the parametersthat are chosen for transmission. The required transformationsare clear for most of the above parameters, except per-haps for the parameters p(i) and ri. Through an inverse DFT,the spectral coefficients ri can be converted to autocorrelationcoefficients p(i). One method of recovering the predictorparameters from {p(i)} is as follows. Apply a DFT to thesequence {p(i)) after appending it with an appropriate numberof zeros to achieve sufficient resolution in the resulting spectrumof A(z). Divide G2 by this spectrum to obtain the spectrumof the filter H(z). Inverse Fourier transformation okthespectrum of H(z) yields the ptocorrelation coefficients R(i).The first p + 1 coefficients R(i), 0 < i G p, are then used tocompute the pre2ictor(12) with R(i) = R(i).B. Quantization Propertiescoefficients via the normal equationsAlthough the sets of parameters given above provide equivalentinformation about the <strong>linear</strong> predictor, their propertiesunder quantization are different. For the purpose of quantization,two desirable properties for a parameter set to have are:1) filter stability upon quantization and 2) a natural orderingof the parameters. Property 1) means that the poles of H(z)continue to be inside the unit circle even after parameterquantization. By 2), we mean that the parameters exhibit aninherent ordering, e.g., the predictor coefficients are orderedas a1 , a2, * - , up. If a1 and (12 are interchanged then H(z) isno longer the same in general, thus illustrating the existenceof an ordering. The poles of H(z), on the other hand, are notnaturally ordered since interchanging the values of any twopoles does not change the filter. When an ordering is present,a statistical study on the distribution of individual parameterscan be used to develop better encoding schemes. Only thepoles and the reflection coefficients insure stability uponquantization, while all the sets of parameters except the polespossess a natural ordering. Thus only the reflection coefficientspossess both of these properties.In an experimental study [63] of the quantization propertiesof the different parameters, it was found that the impulserezponses {ak} and {h,} and the autocorrelations {p(i)} and{R(i)) are highly susceptible to causing instability of the filterupon quantization. Therefore, these sets of parameters can beused only under minimal quantization, in which case thetransmission rate would be excessive.In the experimental investigation of the spectral and cepstralparameters, it was founs that the quantization properties ofthese parameters are generally superior to those of the impulseresponses and autocorrelation coefficients. The spectral parametersoften yield results comparable to those obtained byquantizing the reflection coefficients. However,, for the caseswhen the spectrum consists of one or more very sharp peaks(narrow bandwidths), the effects of quantizing the spectralcoefficients often cause certain regions in the reconstructedspectrum (as described in the previous section) to becomenegative, which leads to instability of the computed filter.Quantization of the cepstral coefficients can also lead to instabilities.It should be noted here that the quantizationproperties of these parameters give better results if the spectraldynamic range of the signal is limited by some form ofpreprocessing.Filter stability is preserved under quantization of the poles.But poles are expensive to compute, and they do not possess anatural ordering.The conclusion is that, of the sets of parameters given in thepreceding, the reflection coefficients are the best set to use astransmission parameters. In addition to ease of computation,stability under quantization, and natural ordering, the valuesof the reflection coefficients ki, i < p, do not change as p isincreased, unlike any of the other parameters. In the following,we discuss the optimal quantization of the reflectioncoefficients.C. Optimal Quantization (531, (6.51Optimal quantization of the reflection coefficients dependson the fidelity criterion chosen. For many applications, it isimportant that the log spectrum of the all-pole model be preserved.In this case, it is reasonable to study the sensitivity ofthe log spectrum with respect to changes in the reflection coefficients.In a recent study [ 65 I , a spectral sensitivity curvewas plotted versus each of the reflection coefficients ki formany different all-pole models obtained by analyzing a largenumber of speech samples. The results of the study show thateach sensitivity curve versus ki has the same general shape,irrespective of the index i. Each sensitivity curve is Ushaped;it is even-symmetric about ki = 0, with large values whenlkil+ 1, and small values when lkil is close to zero. Theseproperties indicate that <strong>linear</strong> quantization of the reflectioncoefficients is not desirable, especially if some of them takevalues very close to 1, which happens when the spectrum containssharp resonances. Non<strong>linear</strong> quantization of ki is equivalentto a <strong>linear</strong> quantization of another parameter, say gi,which is related to ki by a non<strong>linear</strong> transformation. The re-quirement that the spectral sensitivity of the new parametersbe flat resulted in the following optimal transformation [65]:1 +kigi = log -, alli.1 kiIt is interesting to note from (45) that gi is simply the logarithmof the. hypothetical impedance ratios corresponding toki .The optimality of the preceding transformation was basedon a specific spectral fidelity criterion. Other transformationswould result if other quantization fidelity criteria wereadopted."The transmission rate can be reduced further without affectingthe fidelity by proper encoding of each parameter. Variableword length encoding [34] (such as Huffman) can beused for this purpose if the statistical distributions of each ofthe parameters is known. These distributions can be obtainedvery simply from a representative sample of signals.VI. POLE-ZERO MODELINGGiven the spectrum of some arbitrary signal, it is generallynot possible to determine for certain the identity of the systemthat generated the signal in terms of a set of poles and16Using a log likelihood criterion, Itakura informed me thatformation proportional to arcsin (kt) is optimal.a trans-
Authorized licensed use limited to: Escuela Superior de Ingeneria Mecanica. Downloaded on November 26, 2009 at 20:06 from IEEE Xplore. Restrictions apply.MAKHOUL: LINEAR PREDICTION 511zeros. The problem is inherently nondeterministic, for a zerocan be approximated arbitrarily closely by a large number ofpoles and vice versa. Indeed, we have seen in this paper thatthe all-pole model spectrum can approximate the signal spectrumarbitrarily closely by simply increasing the number ofpoles. However, if there are a number of influential zeros inthe signal spectrum, the number of model poles can becomevery large. For data compression applications, this is an undesirablesituation. Also, there are applications where theidentification of the zeros is important. Therefore, it is usefulto be able to model a spectrum in terms of poles and zeros.Much effort is currently being expended on the problem ofpole-zero modeling [8], [17], [19], [20], [29], [30], [88],[ 91 1 . Most of these methods are purely in the time domain.However, there seems to be a growing interest in frequencydomain methods [ 41, [ 461, [ 941 , partly due to the speed offeredby the FFT. Add to this the market availability of spectrumanalyzers and special hardware FFT processors. Ofcourse, the time and frequency domain approaches shouldgive similar results since LP analysis is actually performed inthe autocorrelation domain.The beauty of all-pole modeling is that it is relatively simple,straightforward, well understood, inexpensive, and “always”works. Unfortunately, none of these properties apply to polezeromodeling. The main difficulty is that the pole-zero problemis non<strong>linear</strong>. We show this below for the stationary case.Then, we sketch out representative schemes for iterative andnoniterative estimation of the pole and zero parameters. Noexhaustive analysis is attempted; the reader is referred to theaforementioned references.A. Normal EquationsThe transfer function of the pole-zero model is given by H(z)in (2). The corresponding model spectrum is given bywhere B(z) and A(z) are the numerator and denominator polynomialsin H(z), and the all-zero spzctra N(o) and D(w) formthe numerator and denominator of P(o) and are given byandI 1=1N(w) = 1 +Qbp-jrwI2(99):he matching error between the signal spectrum P(w) andP(w) is given by (62), and from (97) is equal toE can be interpreted as the residual energy obtained by passingthe signal through the filter A(z)/B(z). The problem is to determine{ak} and (bl} such that E in (100) is minimized.In the sequel we shall make use of the following tworelations:--In addition, we shall use the notation R,p(i) to represent theautocorrelation defined byThus, Rm(i) is simply the Fourier transform of P(w).” TakingaE/aai in (1 00) one obtainsauSimilarly, one can show thatDIn order to minimize E, we set aE/aai = 0, 1 < i < p, andaE/abi = 0, 1 < i < q, simultaneously. These, then, comprisethe normal equations.From (103), it is clear that Rlo(i - k) is not a function ofak. Therefore, setting (104) to zero results in a set of <strong>linear</strong>equations, identical in form to the autocorrelation normalequations (12). However, Rzl (i - 1) in (105) is a function ofbl, as can be deduced from (1 03) with a = 2 and 0 = 1. Therefore,setting (1 05) to zero results in a set of non<strong>linear</strong> equationsin bl. If one wishes to solve for {ak} and {bl} simultaneously,then one solves a set of p + q non<strong>linear</strong> equations.Note that if the signal is assumed to be nonstationary, theabove analysis can be modified accordingly in a manner similarto that in Section 111-A for the all-pole case. The resultingequations will be very similar in form to the preceding equations,with nonstationary autocorrelations replacing the stationaryautocorrelations.B. Iterative SolutionsSince the minimization of E in (100) leads to a set of non<strong>linear</strong>equations, the problem of minimizing E must then besolved iteratively. There are many methods in the literaturefor finding the extrema of a function [ 301, [ 1081, many ofwhich are applicable in our case. In particular, gradientmethods are appropriate here since it is possible to evaluatethe error gradient, as in (104) and (105). One such methodwas used by Tretter and Steiglitz [94] in pole-zero modeling.Other schemes, such as the Newton-Raphson method, requirethe evaluation of the Hessian (i.e., second derivative). Thiscan be very cumbersome in many problems, but is straightforwardin our case. This is illustrated below by giving aNewton-Raphson solution.Let x)= [ala2 * **apblbz- * *bq] be the transpose of acolumn vector x whose elements are the coefficients ak andb1. If x(m) is the solution at iteration m, then x(m + 1) isgiven byx(m+l)=x(m)-J-’-aElax x=x(m)(1 06)where J is the (p + q) X (p + q) symmetric Hessian matrixaN(w) - 2 5 bl COS (i- 1) W, bo = 1 (101) “For a discrete spectrum awn)abi l=o replaced by summations.the integrals in (100) and (103) are
Authorized licensed use limited to: Escuela Superior de Ingeneria Mecanica. Downloaded on November 26, 2009 at 20:06 from IEEE Xplore. Restrictions apply.578PROCEEDINGS OF THE IEEE, APRIL 1975given by -J= azE/axax’. Setting a’ = [ala2 - *ap] and b’ =[blb2bq], (106) can be partitioned, with X’ = [a’b‘l, asP O-=- 2Rzl(i- j) + 4 x x bkblabiabj k=O 1=0* [R3](j+i- I- k)tRJl(j- i- ltk)]. (110)Given the estimates dm) and b(m), one can compute N(a)and D(a) from (98) and (99) using FFT’s, and then use (103)to compute the autocorrelations Rlo, RZo, Rzl, and R31,which can then be used in (107)qllO) to compute the newestimates a(m + 1) and b(m t 1). The iterations are haltedwhen the error gradient goes below some prespecified threshold.The minimum error is then computed from (100).The Newton-Raphson method works very well if the initialestimate is close to the optimum. In that case, the Hessian J ispositive definite and the convergence is quadratic [ 301 . In thenext section we discuss noniterative methods which can beused to give these good initial estimates.C. Noniterative SolutionsOne property that is common to noniterative methods isthat a good estimate of the number of poles and zeros seemsto be necessary for a reasonable solution. Indeed, in that case,there is not much need to go to expensive iterative methods.However, in general, such information is unavailable and oneis interested in obtaining the best estimate for a given p and q.Then, noniterative methods can be used profitably to givegood initial estimates that are necessary in iterative methods.I) Pole Estimation: Assume that the signal s, had beengenerated by exciting the pole-zero filter H(z) in (2) by eitheran impulse or white noise. Then it is simple to show that thesignal autocorrelation obeys the autocorrelation equation (31)for i > q. Therefore, the coefficients ‘Ik can be estimated bysolving(31)withq+l
MAKHOUL: LINEAR PREDICTION 579[ 41 -, .“Maximum likelihood identification of Gaussian autoregresslvemoving average models,” Biomem’ka, vol. 60, no. 2, pp.255-265, 1973.[SI -, “A new look at statistical model identification,” IEEETrans. Automat. Contr., vol. AC-19, pp. 716-723, Dec. 1974.[ 61 T. W. Anderson, The Statistical Analysis of Time Series NewYork: Wiley, 1971.[7] C. A. Andrew, J. M. Davies, and G. R. Schwartz, “Adaptivedata compression,” Roc. IEEE, vol. 55, pp. 267-277, Mar.1967.[8] K. J. htrom and P. Eykhoff, “System identification-A survey,”Automatica,vol.7, pp. 123-162, 1971.191 B. S. Atal and M. R. Schroeder, “Adaptive predictive coding ofspeech signals,” Bell Syst. Tech. J., vol. 49, no. 6, pp. 1973-1986, Oct. 1970.[ 101 B. S. Atal and S. L. Hanauer, “Speech analysis and synthesis by<strong>linear</strong> prediction of the speech wave,” J. Acoust. SOC. Amer.,vol. 50, no. 2, pp. 637-655, 1971.[ 11 ] M. S. Bartlett, An Introduction to Stochastic Processes withSpecial Reference to Methods and Applications Cambridge,England: Cambridge Univ. Ress, 1956.[ 121 J. S. Bendat and A. G. Piersol, Random Data: Analysis andMeasurement Pmcedures. New York: Wiley, 1971.[ 131 C. Bingham, M. D. Godfrey, and J. W. Tukey, “Modern techniquesof power spectrum estimation,” ZEEE Trans. AudioElectroacoust., vol. AU-15, pp. 56-66, June 1967.[ 141 R. B. Blackman and J. W. Tukey, The Measurement of PowerSpectra New York: Dover, 1958.[ 151 T. Bohlin, “Comparison of two methods of modeling stationaryEEG signals,” IBM J. Res. Dev., pp. 194-205, May 1973.[ 161 S. F. Boll, “A priori digital speech analysis,” Computer ScienceDiv., Univ. Utah, Salt Lake City, UTEC-CSC-73-123, 1973.[ 171 G. E. Box and G. M. Jenkins, Time Series Analysis Forecastingand Control. San Francisco, Calif.: Holden-Day, 1970.[ 181 J. P. Burg, “The relationship between maximum entropy spectraand maximum likelihood spectra,” Geophysics, vol. 37, no. 2,pp. 375-376, Apr. 1972.[ 191 C. S. Burrus and T. W. Parks, “Time domain design of recursivedigital filters,” ZEEE Trans. Audio Electroacoust., vol. AU-18,pp. 137-141, June 1970.[20] J. C. Chow, “On estimating the orders of an autoregressivemoving-average process with uncertain observations,” ZEEETrans. Automat. Contr., vol. AC-17, pp. 707-709, Oct. 1972.121 1 W. T. Cochranetal., “What is the fast Fourier transform?,”ZEEETrans Audio Electroacowt., vol. AU-15, pp. 45-55, June 1967.[22] H. Cox, “Linear versus logarithmic averaging,” J. Acoust. SOC.Amer., vol. 39, no. 4, pp. 688-690, 1966.I231 L. D. Davisson, “The theoretical analysis of data compressionsystems,”Proc. ZEEE,vol. 56, pp. 176-186, Feb. 1968.1241 J. Durbin, “Efficient estimation of parameters in movingaveragemodels,” Biomerrika, vol. 46, Parts 1 and 2, pp. 306-316, 1959.[25] -, “The fitting of time-series models,”Rev. Znst.Znt. Statist,vol. 28, no. 3, pp. 233-243, 1960.(26) A. Eberhard, “An optimal discrete window for the calculationof power spectra,” IEEE Trans. Audio Electroacoust., vol.AU-21, pp. 3743, Feb. 1973.(271 M. P. Ekstrom, “A spectral characterization of the illconditioningin numerical deconvolution,” ZEEE Trans. AudioElectroacoust., vol. AU-21, pp. 344-348, Aug. 1973.[28] P. Elias, “Predictive coding, Parts I and I1,”IRE Trans. Inform.Theory,vol. IT-1, p. 16, Mar. 1955.(291 A. G. Evans and R. Fischl, “Optimal least squares time-domainsynthesis of recursive digital filters,” ZEEE Trans. AudioElectroacoust.,vol. AU-21, pp. 61-65, Feb. 1973.[ 301 P. Eykhoff, System Identification: Parameter and State Estimation,New York: Wiley, 1974.[ 31 ] D. K. Faddeev and V. N. Faddeeva, Computational Methods ofLinear Algebra. San Francisco, Calif.: Freeman,[32] P. B. C. Fenwick, P. Michie, J. Dollimore, and1963.G. W. Fenton,“Mathematical simulation of the electroencephalogram using anautoregressive series,” Bio-Med. Comput., vol. 2, pp. 281-307,1971.I331 J. L. Flanagan, Speech Analysis Synthesis and Perception, 2ndEdition. New York: Springer-Verlag, 1972.[ 341 R. G. Gallager, Information Theorytion. New York: Wiley, 1968.and Reliuble Communica-[ 351 L. Y. Geronimus, Orthogonal Polynomials. New York: ConsultantsBureau, 1961.[36] W. Gersch, “Spectral analysis of EEG’s by autoregressive decompositionof time series,” Math. Biosci, vol. 7, pp. 205-222,1970.[ 371 W. Gersch and D. R. Sharpe, “Estimation of power spectra withfiite-order autoregressive models,” IEEE Trans. Automat.Cone.., vol. AC-18, pp. 367-369, Aug. 1973.[38] B. Gold and C. M. Rader, Digital Procemhg of Signols. NewYork: McGraw-Hill, 1969.[ 39) G. H. Golub and C. Reinsch, “Singular value decomposition andleast squares solutions,” Numer. Math., vol. 14, pp. 403-420,1970.[40] A. H. Gray and J. D. Markel, “A spectral-flatness measure forstudying the autocorrelation method of <strong>linear</strong> prediction ofspeech analysis,” IEEE Trans. Acoust., Speech, Signal Processing,vol. ASSP-22, pp. 207-216, June 1974.I411 R. M. Gray, “On the asymptotic eigenvalue distribution ofToeplitz matrices,” IEEE Trans. Inform. Theory, vol. IT-18,pp. 725-730, NOV. 1972.[42] U. Grenander and G. Szego, Toeplitz Forms and Their Applications.Berkeley, Calif.: Univ. California Press, 1958.(431 U. Grenander and M. Rosenblatt, Statistical Analysis of StationaryTime Series. New York: Wiley, 1957.[44] A. Habibi and G. S. Robinson, “A survey of digital picturecoding,” Computer, pp. 22-34, May 1974.[45] E. J. Hannan, Time Series Analysis. London, England:Methuen, 1960.I461 -,Multiple Time Series. New York: Wiley, 1970.[47] J. R. Haskew, J. M. Kelly, R. M. Kelly, Jr., and T. H. McKinney,“Results of a study of the <strong>linear</strong> prediction vocoder,” IEEETrans. Commun., vol. COM-21, pp. 1008-1014, Sept. 1973.[48] R. L. Hershey, “Analysis of the difference between log meanand mean log averaging,” J. Acoust. SOC. Amer., vol. 51, pp.1194-1197, 1972.[49] F. B. Hildebrand, Introduction to Numerical Values NewYork: McGraw-Hill, 1956.[SO] F. Itakura and S. Saito, “Analysis synthesis telephony based onthe maximum likelihood method,” in Rep. 6th Int. Congr.Acoustics, Y. Kohasi, Ed., pp. C17-C20, Paper C-5-5, Aug.1968.51 ] -, “A statistical method for estimation of speech spectraldensity and formant frequencies,” Electron. Commun. Japan,vol. 53-A, no. 1, pp. 36-43, 1970.521 -, “Digital filtering techniques for speech analysis and synthesis,”in Conf. Rec., 7th Inr. Congr. Acoustics, Paper 25 C 1,1971.531 -, “On the optimum quantization of feature parameters inthe Parcor speech synthesizer,” in IEEE Conf. Rec., 1972 Conf.Speech Communication and Processing, pp. 434-437, Apr.1972.541 G. M. Jenkins and D. G. Watts, Spectral Analysis and Its Ap-Dlicationa San Francisco, Calif.: Holden-Day, 1968.[SS] T. Kailath, “A view of three decades of <strong>linear</strong> filtering theory,”ZEEE Trans. Inform. Theory, vol. IT-20, pp. 146-181, Mar.1974.[56] R. E. Kalman, “A new approach to <strong>linear</strong> filtering and predictionproblems,” Trans. ASME, J. Basic Eng., Series D82, pp.3545, 1960.(571 H. Kobayashi and L. R. Bahl, “Image data compression by predictivecoding I: <strong>Prediction</strong> algorithms,” IBM J. Res. Dev., pp.164-171, Mar. 1974.(581 A. Kolmogorov, “Interpolation und Extrapolation von stationarenzufalligen Folgen,” Bull. Acad. Sci, U.S.S.R., Ser. Math.,VOI. 5, pp. 3-14, 1941.(591 K. S. Kunz, Numerical Analysis. New Yak: McGraw-Hill,1957.(601 R. C. K. Lee, Optimal Estimation, Identification, and Control,Research Monograph no. 28. Cambridge, Mass.: M.I.T. Press,1964.1611 N. Levinson, “The Wiener RMS (root mean square) error criterionin filter design and prediction,” J. Math. Phys., vol. 25,no. 4, pp. 261-278, 1947. Also Appendix B, in N. Wiener,Extrapolation, Interpolation and Smoothing of Stationary TimeSeries. Cambridge, Mass.: M.I.T. Press, 1949.[62] J. Makhoul, “Spectral analysis of speech by <strong>linear</strong> prediction,”ZEEE Trans. Audio Electroacoust., vol. AU-21, pp. 140-148,June 1973.[a31 -, “Selective <strong>linear</strong> prediction and analysis-by-synthesis inspeech analysis,” Bolt Beranek and Newman Inc., Cambridge,Mass., Rep. 2578, Apr. 1974.[641 J. Makhoul and J. J. Wolf, “Linear prediction and the spectralanalysis of speech,” Bolt Beranek and Newman Inc., Cambridge,Mass., NTIS AD-749066, Rep. 2304, Aug. 1972.I651 J. Makhoul and R. Viswanathan, “Quantization properties oftransmission parameters in <strong>linear</strong> predictive systems,” BoltBeranek and Newman Inc., Cambridge, Mass., Rep. 2800, Apr.1974.(661 H. B. Mann and A. Wald, “On the statistical treatment of <strong>linear</strong>stochastic difference equations,” Econometrica, vol. 11, nos. 3and 4, pp. 173-220, 1943.I671 W. D. Mark, “Spectral analysis of the convolution and filteringof non-stationary stochastic processes,” J. Sound Vib., no. 11,pp. 19-63, 1970.I681 J. D. Markel, “Digital inverse filtering-A new tool for formanttrajectory estimation,” IEEE Trans. Audio Electroacoust., vol.AU-20, pp. 129-137, June 1972.
~~580 PROCEEDINGS OF 1975 THJ. D. Markel and A. H. Gray, “On autocorrelation equations asapplied to speech analysis,” IEEE Trans. Audio Electroacoust.,vol. AU-20, pp. 69-79, Apr. 1973.E. Matsui et a&, “An adaptive method for speech analysis basedon Kalman filtering theory,” Bull Electrotech. Lab, vol. 36,no. 3, pp. 42-51, 1972 (in Japanese).[711 R. N. McDonough and W. H. Huggins, “Best least-squares representationof signals by exponentials,” IEEE Trans. Automat.Contr., vol. AC-13, pp. 408-412, Aug. 1968.S. K. Mitra and R. J. Sherwood, “Estimation of pole-zero displacementsof a digital filter due to coefficient quantization,”ZEEE Trans. Circuits Syst., vol. CAS-21, pp. 116-124, Jan.1974.R. E. Nieman, D. G. Fisher, and D. E. Seborg, “A review ofprocess identification and parameter estimation techniques,”Znt. J. Control, vol. 13, no. 2, pp.209-264, 1971.R. H. Norden, “A survey of maximum likelihood estimation,”Int. Statist. Rev., vol. 40, no. 3, pp. 329-354, 1972.-, “A survey of maximum likelihood estimation, Part 2,”Znt. Statist. Rev., vol. 41, no. 1, pp. 39-58, 1973.A. Oppenheim and J. M. Tribolet, “Pole-zero modeling usingcepstral prediction,” Res. Lab. Electronics, M.I.T., Cambridge,Mass., QPR 111, pp. 157-159, 1973.A. V. Oppenheim, R. W. Schafer and T. G. Stockham, “Non<strong>linear</strong>filtering of multiplied and convolved signals,”Proc. IEEE,VO~. 56, pp. 1264-1291, Aug. 1968.M. Pagano, “An algorithm for fitting autoregressive schemes,”J. Royal Statist. SOC., Series C (Applied Statim‘cs), vol. 21, no.3, pp. 274-281, 1972.A. Papoulis, Probability, Random Variables, and StochasticProcesses New York: McGraw-Hill, 1965.L. R. Rabiner et aL, “Terminology in digital signal processing,”ZEEE Trans. Audio Electroacoust., vol. AU-20, pp. 322-337,Dec. 1972.A. Ralston, A First Course in Numerical Analysis. New York:McGraw-Hill, 1965.A. Ralston and H. Wilf, Mathematical Methods for Digital Computers,vol. 11. New York: Wiley, 1967.M. P. Ristenbatt, “Alternatives in digital communications,”Proc. IEEE,vol. 61, pp. 703-721, June 1973.E. A. Robinson, Multichannel Time Series Analysis with DigitalComputer Programs. San Francisco, Calif.: Holden-Day, 1967.-, Statistical Communication and Detection. New York:Hafner, 1967.-, “Predictive decomposition of time series with applicationto seismic exploration,” Geophysics, vol. 32, no. 3, pp. 418-484, June 1967.E. A. Robinson and S. Treitel, The Robinson-Treitel Reader,3rd ed. Tulsa, Okla.: Seismograph Service Corp., 1973.A. P. Sage and J. L. Melsa, System Identification. New York:Academic Press, 1971.R. W. Schafer and L. R. Rabiner, “Digital representations ofspeech signals,” this issue, pp. 662677.F. C. Schweppe, Uncertain Dynamic Systems. EnglewoodCliffs, N.J.: Rentice-Hall, 1973.J. L. Shanks, “Recursion filters for digital processing,” Geophysics,vol. XXXII, no. 1, pp. 33-51, 1967.R. A. Silverman, “Locally stationary random processes,” IRETrans. Inform. Theory, vol. IT-3, pp. 182-187, Sept. 1957.G. Szego, Orthogonal Polynomials. New York: Amer. Math.SOC. Colloquium Publ., vol. XXIII, N.Y., 1959.[94] S. A. Tretter and K. Steiglitz, “Power-spectrum identification interms of rational models,” ZEEE Trans. Automat. Control, vol.AC-12, pp. 185-188, Apr. 1967.[95] J. M. Tribolet, “Identification of <strong>linear</strong> discrete systems withapplications to speech processing,” Master’s thesis, Dep. Elec.Eng., M.I.T., Cambridge, Mass., Jan. 1974.[96] A. Van den Bos, “Alternative interpretation of maximumentropy spectral analysis,” IEEE Trans. Inform. Theory, vol.IT-17, pp. 493-494, July 1971.[ 971 H. Wakita, “Direct estimation of the vocal tract shape by inversefdtering of acoustic speech waveforms,” ZEEE Trans. AudioElectroacoust., vol. AU-21, pp. 417-427, Oct. 1973.[98] G. Walker, “On periodicity in series of related terms,” Proc.RoyalSoc.,vol. 131-A, p. 518, 1931.[99] R. J. Wang, “Optimum window length for the measurement oftime-varvine Dower suectra.” , J. Acoust. SOC. Amer.. vol. 52. no.~~~1 (part i), Pp: 33-38,-1971.[ 1001 R. 1. Wang and S. Treitel, “The determination of digital Wienerfilters by means of gradient methods,” Geophysics, vol. 38, no.2, pp. 310-326, Apr. 1973.[ 1011 P. D. Welch, “A direct digital method of poyer spectrum estimation,”ZBMJ.Res. Dev., vol. 5, pp. 141-156, Apr. 1961.[ 1021 A. Wennberg and L. H. Zetterberg, “Application of a computerbasedmodel for EEG analysis,” Electroencephalogr. Clin.Neurophys., vol. 31, no. 5, pp. 457-468, 1971.I1031 P. Whittle, “Some recent contributions to the theory of stationaryprocesses,” Appendix 2, in H. Wold, A Study in theAnalysis of Stationary Time Series. Stockholm, Sweden: Almqvistand Wiksell, 1954.(1041 -, “On the fitting of multivariate autoregressions, and theapproximate canonical factorization of a spectral density ma-trix,”Biometrika, vol. 50, nos. 1 and 2, pp. 129-134, 1963.[ 1051 -, <strong>Prediction</strong> and Regulation by Linear Least Square Methods.London, England: English Universities Press, 1963.[loa] B. Widrow, P. E. Mantey, L. J. Griffiths, and B. B. Goode,“Adaptive antenna systems,” Proc. IEEE, vol. 55, pp. 2143-2159, Dec. 1967.[ 1071 N. Wiener, Extrapolation, Interpolation and Smoothing of Sta-tionary Time Series With Engineering Applications. Cambridge,Mass.: M.I.T. Press, 1949.[ 1081 D. J. Wilde, Optimum Seeking Merhods. Englewood Cliffs,N.J.: Prentice-Hall, 1964.[lo91 J. H. Wilkinson, “Error analysis of direct methods of matrixinversion,” J. Ass. Comput. Mach., vol. 8, no. 3, pp. 281-330,1961.[ 1 lo] -, “The solution of ill-conditioned <strong>linear</strong> equations,” in Ralstonand Wilf, Mathematical Methods for Digital Computers,pp. 65-93, 1967.[ 1111 J. H. Wilkinson and C. Reinsch, Linear Algebra, vol. 11. NewYork: Springer-Verlag, 1971.[ 1121 H. Wold, A Study in the Analysis of Stationary Time Series.Stockholm, Sweden: Almqvist and Wiksell, 1954.[ 113) H. 0. A. Wold, Bibliography on Time Series and StochasticProcesses Cambridge, Mass.: M.I.T. Press, 1965.[ 1141 L. C. Wood and S. Treitel, “Seismic signal processing,” thisissue, pp. 649-66 1.[ 1151 G. U. Yule, “On a method of investigating periodicities in dis-turbed series, with special reference to Wolfer’s sunspot numbers,”Phil.Trans. Roy. Soc.,vol. 226-A, pp. 267-298, 1927.