Reactivity of Nellore steers in two feedlot housing systems and its ...
Reactivity of Nellore steers in two feedlot housing systems and its ...
Reactivity of Nellore steers in two feedlot housing systems and its ...

You also want an ePaper? Increase the reach of your titles
YUMPU automatically turns print PDFs into web optimized ePapers that Google loves.
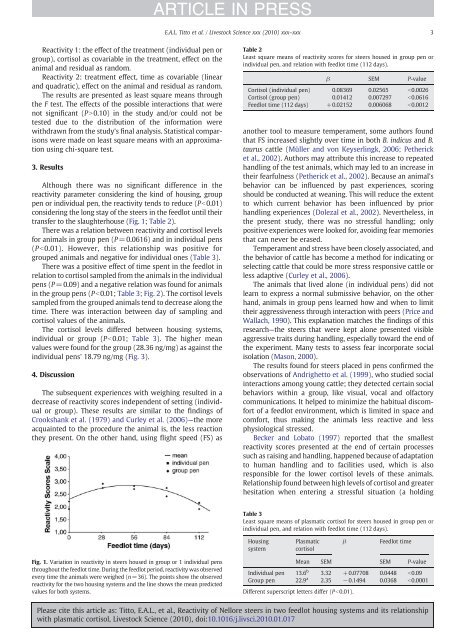
ARTICLE IN PRESSE.A.L. Titto et al. / Livestock Science xxx (2010) xxx–xxx3<strong>Reactivity</strong> 1: the effect <strong>of</strong> the treatment (<strong>in</strong>dividual pen orgroup), cortisol as covariable <strong>in</strong> the treatment, effect on theanimal <strong>and</strong> residual as r<strong>and</strong>om.<strong>Reactivity</strong> 2: treatment effect, time as covariable (l<strong>in</strong>ear<strong>and</strong> quadratic), effect on the animal <strong>and</strong> residual as r<strong>and</strong>om.The results are presented as least square means throughthe F test. The effects <strong>of</strong> the possible <strong>in</strong>teractions that werenot significant (PN0.10) <strong>in</strong> the study <strong>and</strong>/or could not betested due to the distribution <strong>of</strong> the <strong>in</strong>formation werewithdrawn from the study's f<strong>in</strong>al analysis. Statistical comparisonswere made on least square means with an approximationus<strong>in</strong>g chi-square test.3. ResultsAlthough there was no significant difference <strong>in</strong> thereactivity parameter consider<strong>in</strong>g the k<strong>in</strong>d <strong>of</strong> hous<strong>in</strong>g, grouppen or <strong>in</strong>dividual pen, the reactivity tends to reduce (Pb0.01)consider<strong>in</strong>g the long stay <strong>of</strong> the <strong>steers</strong> <strong>in</strong> the <strong>feedlot</strong> until theirtransfer to the slaughterhouse (Fig. 1; Table 2).There was a relation between reactivity <strong>and</strong> cortisol levelsfor animals <strong>in</strong> group pen (P=0.0616) <strong>and</strong> <strong>in</strong> <strong>in</strong>dividual pens(P b0.01). However, this relationship was positive forgrouped animals <strong>and</strong> negative for <strong>in</strong>dividual ones (Table 3).There was a positive effect <strong>of</strong> time spent <strong>in</strong> the <strong>feedlot</strong> <strong>in</strong>relation to cortisol sampled from the animals <strong>in</strong> the <strong>in</strong>dividualpens (P=0.09) <strong>and</strong> a negative relation was found for animals<strong>in</strong> the group pens (Pb0.01; Table 3; Fig. 2). The cortisol levelssampled from the grouped animals tend to decrease along thetime. There was <strong>in</strong>teraction between day <strong>of</strong> sampl<strong>in</strong>g <strong>and</strong>cortisol values <strong>of</strong> the animals.The cortisol levels differed between hous<strong>in</strong>g <strong>systems</strong>,<strong>in</strong>dividual or group (Pb0.01; Table 3). The higher meanvalues were found for the group (28.36 ng/mg) as aga<strong>in</strong>st the<strong>in</strong>dividual pens' 18.79 ng/mg (Fig. 3).4. DiscussionThe subsequent experiences with weigh<strong>in</strong>g resulted <strong>in</strong> adecrease <strong>of</strong> reactivity scores <strong>in</strong>dependent <strong>of</strong> sett<strong>in</strong>g (<strong>in</strong>dividualor group). These results are similar to the f<strong>in</strong>d<strong>in</strong>gs <strong>of</strong>Crookshank et al. (1979) <strong>and</strong> Curley et al. (2006)—the moreacqua<strong>in</strong>ted to the procedure the animal is, the less reactionthey present. On the other h<strong>and</strong>, us<strong>in</strong>g flight speed (FS) asTable 2Least square means <strong>of</strong> reactivity scores for <strong>steers</strong> housed <strong>in</strong> group pen or<strong>in</strong>dividual pen, <strong>and</strong> relation with <strong>feedlot</strong> time (112 days).β SEM P-valueCortisol (<strong>in</strong>dividual pen) 0.08369 0.02565 b0.0026Cortisol (group pen) 0.01412 0.007297 b0.0616Feedlot time (112 days) +0.02152 0.006068 b0.0012another tool to measure temperament, some authors foundthat FS <strong>in</strong>creased slightly over time <strong>in</strong> both B. <strong>in</strong>dicus <strong>and</strong> B.taurus cattle (Müller <strong>and</strong> von Keyserl<strong>in</strong>gk, 2006; Pethericket al., 2002). Authors may attribute this <strong>in</strong>crease to repeatedh<strong>and</strong>l<strong>in</strong>g <strong>of</strong> the test animals, which may led to an <strong>in</strong>crease <strong>in</strong>their fearfulness (Petherick et al., 2002). Because an animal'sbehavior can be <strong>in</strong>fluenced by past experiences, scor<strong>in</strong>gshould be conducted at wean<strong>in</strong>g. This will reduce the extentto which current behavior has been <strong>in</strong>fluenced by priorh<strong>and</strong>l<strong>in</strong>g experiences (Dolezal et al., 2002). Nevertheless, <strong>in</strong>the present study, there was no stressful h<strong>and</strong>l<strong>in</strong>g; onlypositive experiences were looked for, avoid<strong>in</strong>g fear memoriesthat can never be erased.Temperament <strong>and</strong> stress have been closely associated, <strong>and</strong>the behavior <strong>of</strong> cattle has become a method for <strong>in</strong>dicat<strong>in</strong>g orselect<strong>in</strong>g cattle that could be more stress responsive cattle orless adaptive (Curley et al., 2006).The animals that lived alone (<strong>in</strong> <strong>in</strong>dividual pens) did notlearn to express a normal submissive behavior, on the otherh<strong>and</strong>, animals <strong>in</strong> group pens learned how <strong>and</strong> when to limittheir aggressiveness through <strong>in</strong>teraction with peers (Price <strong>and</strong>Wallach, 1990). This explanation matches the f<strong>in</strong>d<strong>in</strong>gs <strong>of</strong> thisresearch—the <strong>steers</strong> that were kept alone presented visibleaggressive tra<strong>its</strong> dur<strong>in</strong>g h<strong>and</strong>l<strong>in</strong>g, especially toward the end <strong>of</strong>the experiment. Many tests to assess fear <strong>in</strong>corporate socialisolation (Mason, 2000).The results found for <strong>steers</strong> placed <strong>in</strong> pens confirmed theobservations <strong>of</strong> Andrighetto et al. (1999), who studied social<strong>in</strong>teractions among young cattle; they detected certa<strong>in</strong> socialbehaviors with<strong>in</strong> a group, like visual, vocal <strong>and</strong> olfactorycommunications. It helped to m<strong>in</strong>imize the habitual discomfort<strong>of</strong> a <strong>feedlot</strong> environment, which is limited <strong>in</strong> space <strong>and</strong>comfort, thus mak<strong>in</strong>g the animals less reactive <strong>and</strong> lessphysiological stressed.Becker <strong>and</strong> Lobato (1997) reported that the smallestreactivity scores presented at the end <strong>of</strong> certa<strong>in</strong> processessuch as rais<strong>in</strong>g <strong>and</strong> h<strong>and</strong>l<strong>in</strong>g, happened because <strong>of</strong> adaptationto human h<strong>and</strong>l<strong>in</strong>g <strong>and</strong> to facilities used, which is alsoresponsible for the lower cortisol levels <strong>of</strong> these animals.Relationship found between high levels <strong>of</strong> cortisol <strong>and</strong> greaterhesitation when enter<strong>in</strong>g a stressful situation (a hold<strong>in</strong>gTable 3Least square means <strong>of</strong> plasmatic cortisol for <strong>steers</strong> housed <strong>in</strong> group pen or<strong>in</strong>dividual pen, <strong>and</strong> relation with <strong>feedlot</strong> time (112 days).Hous<strong>in</strong>gsystemPlasmaticcortisolβFeedlot timeFig. 1. Variation <strong>in</strong> reactivity <strong>in</strong> <strong>steers</strong> housed <strong>in</strong> group or 1 <strong>in</strong>dividual pensthroughout the <strong>feedlot</strong> time. Dur<strong>in</strong>g the <strong>feedlot</strong> period, reactivity was observedevery time the animals were weighed (n=36). The po<strong>in</strong>ts show the observedreactivity for the <strong>two</strong> hous<strong>in</strong>g <strong>systems</strong> <strong>and</strong> the l<strong>in</strong>e shows the mean predictedvalues for both <strong>systems</strong>.Mean SEM SEM P-valueIndividual pen 13.6 b 3.32 +0.07708 0.0448 b0.09Group pen 22.9 a 2.35 −0.1494 0.0368 b0.0001Different superscript letters differ (Pb0.01).Please cite this article as: Titto, E.A.L., et al., <strong>Reactivity</strong> <strong>of</strong> <strong>Nellore</strong> <strong>steers</strong> <strong>in</strong> <strong>two</strong> <strong>feedlot</strong> hous<strong>in</strong>g <strong>systems</strong> <strong>and</strong> <strong>its</strong> relationshipwith plasmatic cortisol, Livestock Science (2010), doi:10.1016/j.livsci.2010.01.017