Farms for the Future: Massachusetts - American Farmland Trust
Farms for the Future: Massachusetts - American Farmland Trust
Farms for the Future: Massachusetts - American Farmland Trust

You also want an ePaper? Increase the reach of your titles
YUMPU automatically turns print PDFs into web optimized ePapers that Google loves.
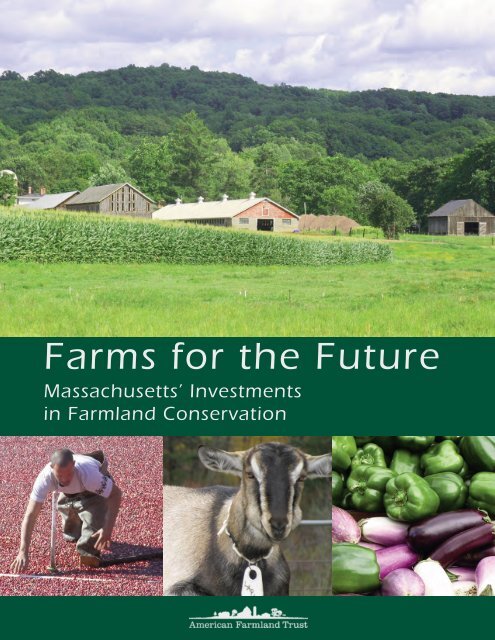
<strong>Farms</strong> <strong>for</strong> <strong>the</strong> <strong>Future</strong><strong>Massachusetts</strong>’ Investmentsin <strong>Farmland</strong> Conservation
<strong>Farms</strong> <strong>for</strong> <strong>the</strong> <strong>Future</strong><strong>Massachusetts</strong>’ Investments in <strong>Farmland</strong> ConservationThis report is intended to provide readers with a better understanding of <strong>Massachusetts</strong>agriculture and <strong>the</strong> land on which it relies. <strong>Farms</strong> <strong>for</strong> <strong>the</strong> <strong>Future</strong>: <strong>Massachusetts</strong>’Investments in <strong>Farmland</strong> Conservation includes a review of state programs that aresaving farmland, protecting <strong>the</strong> environment and helping improve farm profitability,and recommends a number of actions to improve and complement those programs.The in<strong>for</strong>mation is presented in five chapters:I. Commonwealth <strong>Farms</strong>: Many Products, Many BenefitsII. Farming in <strong>the</strong> Commonwealth Today: Challenges and OpportunitiesIII. Agricultural Preservation Restriction ProgramIV. Farm Viability and Conservation ProgramsV. Recommendations<strong>American</strong> <strong>Farmland</strong> <strong>Trust</strong> (AFT) is a private, nonprofit organization founded in 1980 tostop <strong>the</strong> loss of productive farmland and to promote farming practices that lead to a healthyenvironment. Our New England Office is located in Northampton, Mass.AFT has been active in farmland protection ef<strong>for</strong>ts in <strong>Massachusetts</strong> <strong>for</strong> more than 20 yearsand promotes farmland protection, farm viability and farm conservation through research,outreach, advocacy and policy development at <strong>the</strong> municipal, state and federal levels.AcknowledgmentsSpecial thanks to <strong>the</strong> following people <strong>for</strong> <strong>the</strong>ir helpful feedback, ideas and in<strong>for</strong>mation:Kathy Carroll of University of <strong>Massachusetts</strong> Cooperative Extension Service, Kelly Colemanof Community Involved in Sustaining Agriculture, Carl DeMatteo of Nor<strong>the</strong>ast Family <strong>Farms</strong>,Diemand family of Diemand Farm, Doug Gillespie and Nathan L’Etoile of <strong>Massachusetts</strong> FarmBureau Federation, Rich Hubbard of Franklin Land <strong>Trust</strong>, Dave Jackson of Enterprise Farm,Deborah Johnson of Natural Resources Conservation Service, Jeff LaFleur of Cape CodCranberry Growers’ Association, Bernie McHugh of <strong>Massachusetts</strong> Land <strong>Trust</strong> Coalition,North Amherst Community Farm, Andrew Orr of Westport, Jim Putnam and Bob Smith ofFirst Pioneer Farm Credit, Steve Verrill of Verrill Farm, Ryan Voiland of Red Fire Farm, and<strong>the</strong> staff of <strong>the</strong> <strong>Massachusetts</strong> Executive Office of Energy and Environmental Affairs, and <strong>the</strong>Department of Agricultural Resources.<strong>American</strong> <strong>Farmland</strong> <strong>Trust</strong> is grateful to its <strong>Massachusetts</strong> members, <strong>the</strong> Sarah K. deCoizartArticle TENTH Perpetual Charitable <strong>Trust</strong>, <strong>the</strong> Claneil Foundation and o<strong>the</strong>r donors <strong>for</strong> <strong>the</strong>generous financial support that made this publication possible.The following <strong>American</strong> <strong>Farmland</strong> <strong>Trust</strong> staff members were involved in <strong>the</strong> production ofthis report: Ben Bowell, Cris Coffin, Mike Eley and Doris Mittasch.© <strong>American</strong> <strong>Farmland</strong> <strong>Trust</strong>, 2008Front cover photos: USDA Natural Resources Conservation Service.Back cover photo: Bernie Kubiak, www.berniekubiak.com,©2007.
CHAPTER ONECommonwealth <strong>Farms</strong>: Many Products, Many Benefits<strong>Massachusetts</strong> has a rich and diverse heritage of farming, and <strong>the</strong> Commonwealth’s agriculturecontinues to be an integral part of <strong>the</strong> state’s economy, culture and landscape. From cranberry bogs toapple orchards, dairy farms to greenhouses, vegetable fields to livestock operations, <strong>the</strong> state’s diverseagricultural industry remains composed primarily of family farms, which are increasingly focused onvalue-added products and direct-to-consumer marketing to improve farm profitability.Some of <strong>the</strong> public benefits of <strong>the</strong> state’s 6,100 farms and 519,000 acres of land in farms are readilyapparent—<strong>the</strong> scenic beauty of a pumpkin field in <strong>the</strong> fall or a pasture of grazing dairy cows in <strong>the</strong>summer, <strong>the</strong> availability of fresh-picked fruits and vegetables from June through November. O<strong>the</strong>rbenefits are not as obvious, such as farmland’s contribution to water quality, flood storage and carbonsequestration; <strong>the</strong> access often offered to neighbors and community residents <strong>for</strong> hunting, walking orsnowmobiling; or <strong>the</strong> role of farms in keeping town budgets balanced.Generating Revenue and Jobs<strong>Farms</strong> are a vital component of <strong>the</strong> state’s economy.The Commonwealth’s farms generate$384 million in annual sales of farm products,employ 13,545 workers and spend nearly$216 million statewide on inputs such as feed,seed, livestock, fertilizer, electricity and fuel.<strong>Massachusetts</strong> farmers also pay $23 millionannually in local property taxes. 1 The economicimpact of farming can be particularly large insome communities. For example, a 2006 studyper<strong>for</strong>med by First Pioneer Farm Credit foundthat <strong>the</strong> total economic impact of agriculture inCarver is over $55 million per year. 2The Commonwealth’s agrarian heritage is anintegral part of <strong>the</strong> state’s appeal to tourists.Picturesque pastures and orchards, rural villagesanchored by working farms, and bountiful harvestsof seasonal farm products clearly play alarge role in attracting <strong>the</strong> estimated 31 millionvisitors who spend over $12 billion each year. 3Helping Balance Municipal BudgetsLike commercial properties, farmland helps tobalance municipal budgets. Cost of CommunityServices (COCS) studies done in towns andcounties across <strong>the</strong> country consistently show thatfarmland generates more in local property taxesthan it requires in local municipal services.Conversely, residential development generallyfails to generate sufficient tax revenues to offset<strong>the</strong> costs of providing services to its residents.Unlike human residents, cows don’t play soccerand cranberries don’t go to school, so farms“Fingertip Facts”about <strong>Massachusetts</strong> AgricultureCash receipts$384 million<strong>Farms</strong> 6,075<strong>Farmland</strong>518,570 acresAverage farm85 acres<strong>Farmland</strong> value$9,234/acre<strong>Farms</strong> with hired labor 1,770Workers 13,545Wages paid$99 millionFarmers’ markets 141Roadside stands 414Food manufacturers 2,600Revenue$6 billionCash ReceiptsGreenhouse/nurseryFruit/vegetablesCranberriesMilkLivestock/poultryO<strong>the</strong>r cropsCattle36%20%12%12%9%9%2%Source: <strong>Massachusetts</strong> Department of Agricultural Resources(MDAR); data based on 2002 Census of Agriculturerequire little in <strong>the</strong> way of town services orinfrastructure. Even when assessed at its agriculturalvalue, as it is under Chapter 61A in<strong>Massachusetts</strong>, farmland helps to finance neededtown services. 4<strong>American</strong> <strong>Farmland</strong> <strong>Trust</strong>1
<strong>Massachusetts</strong>’ Investments in <strong>Farmland</strong> Conservation<strong>Massachusetts</strong> farms are meeting this expandingdemand in a variety of ways. Farm stands areincreasingly prevalent. So, too, are CommunitySupported Agriculture (CSA) farms, where familiescan purchase a yearly “share” in a farm andreceive a certain amount of food every week.According to <strong>the</strong> University of <strong>Massachusetts</strong>,<strong>the</strong>re are currently more than 72 CSA farms in<strong>the</strong> state. Additionally, <strong>the</strong> number of farmers’markets has increased by 40 percent in <strong>the</strong> lastseven years; <strong>the</strong>re are now over 164 of <strong>the</strong>m. 9In 2000, three University of <strong>Massachusetts</strong>professors assessed <strong>the</strong> Commonwealth’s selfsufficiencyin several food categories. While<strong>Massachusetts</strong> farms were <strong>the</strong> source of only1 percent of meat and poultry purchases in <strong>the</strong>state and less than 15 percent of dairy productsand eggs, <strong>the</strong>y accounted <strong>for</strong> 33 percent of <strong>the</strong>vegetables and 65 percent of <strong>the</strong> fruit purchases.In comparison to a study done in 1975, overallself-sufficiency in food products from <strong>Massachusetts</strong>farms had increased, from approximately19 percent in 1975 to 32 percent in 1997. 10Improving Local Quality of LifePerhaps <strong>the</strong> most valued attribute of <strong>Massachusetts</strong>farms is <strong>the</strong> hardest to quantify—<strong>the</strong>ir contributionto local “quality of life.” When faced with <strong>the</strong>potential loss of a local farm, community residentsoften rally in support. In Duxbury, <strong>for</strong> example,residents voted to spend $1.5 million raisedthrough <strong>the</strong> Community Preservation Act topurchase <strong>the</strong> town’s last remaining dairy farm; anadditional $2 million or so was raised throughprivate donations to complete <strong>the</strong> project. 11For some people, farms and farming represent animportant link to an agrarian past and Yankeetenacity and ingenuity. For o<strong>the</strong>rs, farms provideheart-warming scenic beauty that makes <strong>the</strong> dailycommute a pleasant experience or offer <strong>the</strong> tranquilityof a snowshoe through a winter pasture ora run past a summer meadow of freshly cut hay.In recent years, many <strong>Massachusetts</strong> communitieshave taken steps to acknowledge <strong>the</strong> value residentsplace on local farms by enacting right-to-farmbylaws and establishing town agricultural commissions.As of October 2008, 116 towns across <strong>the</strong>state had <strong>for</strong>med, through town meeting vote,agricultural commissions to represent <strong>the</strong> voice ofagriculture in local government. Eighty-one townshad adopted right-to-farm bylaws indicating <strong>the</strong>irsupport <strong>for</strong> local farms and <strong>the</strong> rights of farmers toconduct normal agricultural practices. 12Recognition of <strong>the</strong> value of local farms isapparent in o<strong>the</strong>r ways as well. Communitiesacross <strong>the</strong> Commonwealth are committingsignificant local resources toward local farmlandprotection projects. And many consumers arewilling to pay more <strong>for</strong> local food products tosupport local farm businesses. A statewide pollconducted in May 2007 found that 69 percent ofindividuals surveyed were willing to pay at least5 cents more <strong>for</strong> milk at <strong>the</strong> grocery store if <strong>the</strong>increase were to be used to directly support dairyfarms in <strong>Massachusetts</strong>. 13<strong>American</strong> <strong>Farmland</strong> <strong>Trust</strong>3
CHAPTER TWOFarming in <strong>the</strong> Commonwealth Today: Challenges and Opportunities<strong>Farmland</strong> Availability and LossIn 2002, according to <strong>the</strong> U.S. Census of Agriculture, <strong>Massachusetts</strong> had 519,000 acres of land in farms,representing 10 percent of <strong>the</strong> state’s total land area. As is typical in New England, a significant percentageof this land—about 40 percent, or 211,000 acres—is <strong>for</strong>ested. The remainder is a mix of cropland(207,000 acres), pastureland (31,000 acres) and o<strong>the</strong>r land, including wetlands (69,000 acres). Theaverage farm size is 85 acres, including wetlands and woodlands. The amount of prime farmland—landwith <strong>the</strong> best combination of physical and chemical characteristics <strong>for</strong> producing crops—represents justover 50 percent of <strong>the</strong> state’s total farmland acreage. As of 1997, <strong>the</strong> state’s prime farmland included119,000 acres of cropland, 26,500 acres of pasture and 132,000 acres of <strong>for</strong>ested land. 14The amount and rate of farmland loss in <strong>the</strong> Commonwealth over <strong>the</strong> past 25 years can be piecedtoge<strong>the</strong>r through three different data sources: MassGIS, U.S. Department of Agriculture (USDA) NationalResources Inventory (NRI) and USDA Census of Agriculture.The most recent data available through <strong>the</strong>sesources are from 2003.· According to MassGIS, between 1971 and1999 <strong>Massachusetts</strong> lost approximately79,000 acres of cropland, pasture and woodyperennials, such as cranberry bogs, nurseryland and Christmas tree farms. This representsan average annual loss of about 2,900 acres.· The NRI indicates that on average5,440 acres of cropland and pasture in<strong>Massachusetts</strong> were converted to developeduse every year from 1992 to 1997. Data from<strong>the</strong> 2003 Annual NRI suggest that this rateslowed between 1997 and 2003 to less than2,000 acres per year. However, <strong>the</strong> 2003 dataalso indicate that during this same period,While <strong>Massachusetts</strong> has 519,000 acres ofland in farms, only 119,000 acres of thatland is cropland with prime agriculturalsoils—<strong>the</strong> best land <strong>for</strong> food production.conversion of <strong>for</strong>ested land exceeded 15,000acres per year. Since more than half of <strong>the</strong>state’s prime farmland is <strong>for</strong>ested, this largerate of <strong>for</strong>est conversion impacts agriculturein a number of ways: managed woodlots providemany <strong>Massachusetts</strong> farms with incomefrom timber and firewood sales, and <strong>the</strong>ir losscan affect farm profitability. Forest land isalso an important buffer between farms andnon-farming neighbors.6.0%4.0%2.0%4.1%Percent Change of Land in <strong>Farms</strong> in Nor<strong>the</strong>ast States (1997-2002)0.0%-2.0%-4.0%-6.0%ME PA NY NH VT NJ MD RI MA CT-1.0% PA-1.0% -1.7%-2.4%-4.1%-4.8%-5.3% -5.6%-8.0%-10.0%-12.0%-14.0%-10.8%-12.1%Source: USDA National Agricultural Statistics Service, Census of Agriculture, 20024<strong>American</strong> <strong>Farmland</strong> <strong>Trust</strong>
<strong>Massachusetts</strong>’ Investments in <strong>Farmland</strong> Conservation· The 2002 Census of Agriculture data reportthat, from 1997 to 2002, <strong>the</strong> total acreageof land in farms in <strong>Massachusetts</strong> declinedannually on average by nearly 12,000 acres.The Census does not indicate whe<strong>the</strong>r or notthis land has been developed. Like <strong>the</strong> 2003Annual NRI data, more recent estimates from<strong>the</strong> National Agricultural Statistics Servicesuggest that <strong>the</strong> rate of land leaving agriculturalproduction may be abating. 15 New 2007Census data are expected in February 2009.· There are significant regional variations infarmland loss. The 2002 Census reports thatPlymouth County saw <strong>the</strong> largest drop inland in farms from 1997 to 2002, with a27 percent decline in farm acreage. Bristol,Hampden, Hampshire and Worcester countieseach experienced more than a 10 percentdrop in farm acreage.<strong>Farmland</strong> Af<strong>for</strong>dabilityThe Commonwealth’s shrinking base of workinglands has enormous repercussions <strong>for</strong> a naturalresource-based industry whose profitabilitydepends on a stable source of productive land.Competing demands on farmland <strong>for</strong> housing andcommercial development have dramaticallyincreased farm real estate values over <strong>the</strong> pastdecade from $6,200 per acre in 1997 to $12,200per acre in 2008. 16 While <strong>the</strong> escalating value offarmland represents a valuable asset on <strong>the</strong> farmbalance sheet and a vital nest egg <strong>for</strong> retiringfarmers, it is also making it increasingly difficultto establish or expand a farm operation.The average per-acre farm real estate valuein <strong>Massachusetts</strong> is $12,200, <strong>the</strong> highestin <strong>the</strong> country. 17Farmers across <strong>Massachusetts</strong> rely on rented land.According to <strong>the</strong> 2002 Census of Agriculture,109,000 acres of land in farms in <strong>the</strong> state arerented or leased by farmers from non-farminglandowners. 18 While <strong>the</strong> Census does not indicatewhat type of land this is, assuming it islargely cropland and pasture land, rental landwould account <strong>for</strong> over 40 percent of <strong>the</strong>Commonwealth’s total land in crops or pasture.Land owned by non-farming landowners can beespecially vulnerable to conversion to nonagriculturaluses, especially if passed on to heirswho have little connection to ei<strong>the</strong>r <strong>the</strong> land or to<strong>the</strong> farmer working it.Farm Expenses and Income<strong>Massachusetts</strong> farmers pay over $360 millionannually in production expenses. Farm expensesin <strong>the</strong> Commonwealth have risen sharply in <strong>the</strong>past decade. From 1997 to 2002, average productionexpenses increased by a staggering27.5 percent. Partially as a result of risingexpenses, <strong>the</strong> same five-year period saw a steepdrop in net farm income, from an average perfarm of $24,000 to an average of $11,000. Morerecent estimates suggest a upward turn in net farmincome—from $94 million in 2002 to $131 millionin 2005—but a continued escalation of farminput costs such as feed and energy. 19The average per-acre property tax paid by<strong>Massachusetts</strong> farmers is <strong>the</strong> fourth highestin <strong>the</strong> nation. 20Several factors contribute to <strong>the</strong> high costs offarm production expenses in <strong>the</strong> Commonwealth.Because of agriculture’s dependence on fuel, highenergy costs have a significant impact on farming.<strong>Massachusetts</strong> ranks eighth in <strong>the</strong> U.S. <strong>for</strong> overallenergy prices, which are 30 percent higher than<strong>the</strong> national average. 21 Rising land values havealso contributed to higher expenses. Land renthas increased—from 1997 to 2002 <strong>the</strong> per farmaverage increased by 20 percent while <strong>the</strong> numberof renters paying $10,000 or more annually increasedby 38 percent. Property taxes, too, havehad an impact.High production expenses have encouraged<strong>Massachusetts</strong> farm businesses to develop retailmarket opportunities and value-added products tomaintain profitability. As a result, <strong>the</strong> state’s farmslead <strong>the</strong> way in <strong>the</strong> growing direct-to-consumermovement. In fact, <strong>Massachusetts</strong> ranks first in<strong>the</strong> nation <strong>for</strong> <strong>the</strong> value of direct market sales perfarm, at $24,900—over 2.5 times that of <strong>the</strong> U.S.average. Worcester County ranks fourth among allcounties in <strong>the</strong> U.S. <strong>for</strong> <strong>the</strong> value of direct sales ofagricultural products to consumers, at nearly$5 million. 22<strong>American</strong> <strong>Farmland</strong> <strong>Trust</strong>5
<strong>Farms</strong> <strong>for</strong> <strong>the</strong> <strong>Future</strong>1%25%11%Source: <strong>Massachusetts</strong> Department of Agricultural Resources, 2008Market and Product DevelopmentSeveral state initiatives are helping to encouragenew market and product development and torevitalize <strong>the</strong> Commonwealth’s food system.These initiatives include:Department of Agricultural Resources:FY07 Funding Sources63%Operating $20,001,365Capital $7,864,778<strong>Trust</strong> $350,127Federal $3,528,835·Anew state “agricultural preference law”requires state institutions to give preferenceto <strong>Massachusetts</strong>-grown farm products andauthorizes local school districts to do likewise,helping to build new market outlets <strong>for</strong>local farms.· A “virtual” Agricultural Innovation Center(AIC) provides grants to trade associations andnonprofit organizations <strong>for</strong> several purposes,including expanding export opportunities <strong>for</strong>state food and farm products, direct-toconsumersales, and developing and promotingnew uses of farm products andby-products. The AIC has granted morethan $3.4 million since fiscal year 2007.· A new energy ombudsman position in <strong>the</strong><strong>Massachusetts</strong> Department of AgriculturalResources (MDAR) is tasked with helpingto create new energy-related farm marketand product opportunities.· A landmark energy bill enacted in 2008allows farmers to sell excess electricitygenerated from solar and wind power into<strong>the</strong> grid. The measure also mandates yearlyincreases in <strong>the</strong> Commonwealth’s renewableenergy portfolio, which will spurinvestments in technologies that make useof wood, new agricultural products, andcrop waste and by-products.· A newly authorized “linked” loanprogram will offer farmers four-year,low-interest loans of up to $500,000 <strong>for</strong>a variety of marketing, production, infrastructureor environmental needs.These initiatives are an important complementto three capital investment programswithin <strong>the</strong> MDAR—<strong>the</strong> AgriculturalPreservation Restriction (APR) program,<strong>the</strong> Farm Viability Enhancement Program(FVEP) and <strong>the</strong> Agricultural EnvironmentalEnhancement Program (AEEP). Thesethree bond-funded programs, which accounted <strong>for</strong>31 percent of <strong>the</strong> MDAR budget in fiscal year2007, represent <strong>the</strong> department’s core investmentsin farmland conservation. Funding <strong>for</strong> <strong>the</strong>se programsis typically authorized in a multi-yearEnvironmental Bond bill. In 2008, <strong>the</strong> state legislatureenacted a new Environmental Bond thatincreased <strong>the</strong> bond authorization <strong>for</strong> each of <strong>the</strong>sethree programs over <strong>the</strong> next five years. The newbond authorization levels, discussed in greaterdetails in <strong>the</strong> chapters that follow, include:· $67.75 million <strong>for</strong> <strong>the</strong> APR program, up from$45.5 million in <strong>the</strong> 2002 Environmental Bond;· $30 million <strong>for</strong> <strong>the</strong> FVEP and o<strong>the</strong>r farm viabilityinitiatives, up from $15 million; and· $3 million <strong>for</strong> <strong>the</strong> AEEP up from $2 million.Department of Agricultural Resources:FY07 SpendingAgriculturalInnovationCenter10%AEEP 1%Farm Viability4%Earmarks andDairy Relief11%APR26%Staff9%Farmers'Markets andFoodAssistance34%O<strong>the</strong>r5%Source: <strong>Massachusetts</strong> Department of Agricultural Resources, 20086<strong>American</strong> <strong>Farmland</strong> <strong>Trust</strong>
CHAPTER THREEAgriculture Preservation Restriction ProgramThe Agricultural Preservation Restriction (APR) Program, authorized under <strong>Massachusetts</strong> General LawsChapter 20 Sections 23-26 and administered by <strong>the</strong> MDAR, is <strong>the</strong> Commonwealth’s primary farmlandprotection program. The APR program is voluntary, with a rolling application process. A landownerinterested in protecting his or her farmland submits a program application, which is scored on <strong>the</strong> basisof a number of parcel and community criteria; <strong>the</strong> land is appraised; and <strong>the</strong> application is <strong>the</strong>n ei<strong>the</strong>rapproved or disapproved. If approved, <strong>the</strong> Commonwealth pays <strong>the</strong> landowner up to <strong>the</strong> differencebetween <strong>the</strong> “fair market value” and <strong>the</strong> “agricultural value” of <strong>the</strong> farmland in exchange <strong>for</strong> a permanentdeed restriction that precludes any use of <strong>the</strong> land that would have a negative impact on itsagricultural viability.Since its first purchase in 1980, <strong>the</strong> APR program has permanently protected 61,855 acres of <strong>the</strong> state’smost productive farmland at a cost to <strong>the</strong> Commonwealth of $172.5 million. 23Number of farmland parcelsprotected through <strong>the</strong> APR programthrough fiscal year 2007Number of parcelsby town01–56–1516–52Source: <strong>Massachusetts</strong> Department of Agricultural Resources, 2007Program SpendingAs <strong>the</strong> chart on page 10 indicates, APR programspending has stayed relatively constant over <strong>the</strong>past 10 years, with a few notable exceptions.These include a $2.4 million jump in state spendingon <strong>the</strong> program in fiscal year 2008, <strong>the</strong> firstyear of capital spending decisions by <strong>the</strong> Patrickadministration. The fiscal year 2008 funding wasaugmented by an additional $2.6 million from <strong>the</strong>federal Farm and Ranch Lands Protection Program(FRPP), <strong>for</strong> a total investment in <strong>the</strong> program of$12.6 million. Since <strong>the</strong> program’s inception,annual spending has averaged $6.9 million <strong>for</strong>land acquisition and associated costs. 24The Environmental Bond bill enacted in <strong>the</strong>summer of 2008 provides a significant increase inbond authority <strong>for</strong> <strong>the</strong> program over <strong>the</strong> next fiveyears. Compared to <strong>the</strong> $48 million authorizedthrough <strong>the</strong> 2002 bond bill and a 2007 “patch”bond, <strong>the</strong> 2008 Environmental Bond provides$67.75 million <strong>for</strong> <strong>the</strong> program—an annualaverage of $13.55 million.Program DemandDemand <strong>for</strong> <strong>the</strong> APR program has consistentlyoutpaced available funding. Thanks to <strong>the</strong> fiscalyear 2008 increase in program spending, <strong>the</strong> program“queue” is smaller than it has been in yearsand program applications are on <strong>the</strong> rise. As ofOctober 2008, <strong>the</strong> program had 14 approved or“final voted” projects representing 913 acres;<strong>the</strong>se projects had a total estimated restrictionvalue of $8.1 million. An additional 58 projectsrepresent 4,934 acres that have been nominated<strong>for</strong> appraisals. 25<strong>American</strong> <strong>Farmland</strong> <strong>Trust</strong>7
<strong>Farms</strong> <strong>for</strong> <strong>the</strong> <strong>Future</strong>APR Program: Benefiting Farmers and Consumers by……Growing New FarmersFor young farmers, finding available farmland at af<strong>for</strong>dable prices is perhaps <strong>the</strong> greatestchallenge to getting started. The APR program is crucial to <strong>the</strong>se new farm enterprises, providinga pathway to ownership that would not o<strong>the</strong>rwise be possible. Demand <strong>for</strong> land protectedthrough <strong>the</strong> APR program is high among starting farmers because its price, determined by its“agricultural” value, is significantly more af<strong>for</strong>dable than unprotected land. If APR land is notavailable, young farmers can also work with retiring farmers or non-farming landowners, usuallyhelped by a land trust, to purchase unprotected farmland with a simultaneous sale of an APR to<strong>the</strong> Commonwealth. This significantly reduces <strong>the</strong> cost of <strong>the</strong> farmland to <strong>the</strong> farm buyer. Throughei<strong>the</strong>r approach, <strong>the</strong> APR program is playing a critical role in facilitating <strong>the</strong> transfer of farmlandfrom one generation of farmers to <strong>the</strong> next.Ryan Voiland was looking <strong>for</strong> land after graduating from Cornell in 2000 with adegree in fruit and vegetable horticulture. Thanks to <strong>the</strong> APR program, along with<strong>the</strong> USDA’s Farm Service Agency and First Pioneer Farm Credit, Ryan was able topurchase a 50-acre <strong>for</strong>mer dairy farm in Granby at an af<strong>for</strong>dable price. Red FireFarm—named after Ryan’s favorite red leaf variety of lettuce as well as after <strong>the</strong>fire of 1922 that destroyed <strong>the</strong> original house and barn—is now a 450-memberCSA and well known <strong>for</strong> its award-winning tomatoes. The farm’s Annual TomatoFestival in August attracts over a thousand visitors to celebrate <strong>the</strong> more than50 varieties grown on <strong>the</strong> farm.During his last three years of high school, Andrew Orr learned how to raise and sellflowers, herbs and vegetables on a local Westport farm. When <strong>the</strong> farm’s ownerneeded to sell <strong>the</strong> 13-acre farm to finance his retirement, <strong>the</strong> <strong>Trust</strong>ees ofReservations, <strong>the</strong> Westport Land Conservation <strong>Trust</strong> and <strong>the</strong> residents of Westportoffered assistance. The <strong>Trust</strong>ees and <strong>the</strong> <strong>Trust</strong> facilitated <strong>the</strong> purchase of <strong>the</strong> propertyfrom <strong>the</strong> farmer and <strong>the</strong> sale of an APR to <strong>the</strong> state, and <strong>the</strong>n sold <strong>the</strong>protected farm to Andrew <strong>for</strong> $32,000, fulfilling <strong>the</strong> 18-year-old’s dream of owninga farm. The retiring farmer’s dream came true as well—being able to retire whileseeing his farm protected and in <strong>the</strong> hands of an able young farmer he had trained.The son of a professor, Dave Jackson chose to pursue organic vegetables ra<strong>the</strong>rthan a college education. After living off <strong>the</strong> land <strong>for</strong> several years outside ofBrattleboro, Vermont, Dave moved to Whately, where he made his start on landthat had been protected through <strong>the</strong> APR program. Twenty years later, EnterpriseFarm has expanded significantly, due, says Dave, to <strong>the</strong> APR program making itpossible <strong>for</strong> farmers like him to purchase land at an af<strong>for</strong>dable price. In 2007,Enterprise Farm hosted a popular winter farmers’ market and <strong>for</strong> <strong>the</strong> winter 2008-2009 season is spearheading a regional innovation in CSA farms, offering wintershares of regionally produced organic and conventional fruits, herbs and vegetables.8<strong>American</strong> <strong>Farmland</strong> <strong>Trust</strong>
<strong>Massachusetts</strong>’ Investments in <strong>Farmland</strong> Conservation…Keeping <strong>Farms</strong> ProfitableIn 1922, Steve Verrill’s parents started a successful dairy operation. Today <strong>the</strong>re are no cows on <strong>the</strong>Verrill Family Farm in Concord, but visitors will find fields of strawberries, asparagus, tomatoesand corn. A farm store was recently devastated by fire; <strong>the</strong> store’s popular array of fruits and vegetables,as well as soups, salads and baked goods was so cherished by its customers that a numberof local fundraisers have been held to help with <strong>the</strong> cost of rebuilding.The trans<strong>for</strong>mation of <strong>the</strong> farm began in 1982, when several parcels of land <strong>the</strong> Verrills wererenting were about to be sold. With developers offering high prices, Steve could not af<strong>for</strong>d to buy<strong>the</strong> land outright. Instead, <strong>the</strong> Verrills persuaded <strong>the</strong> landowners to enroll <strong>the</strong>ir land in <strong>the</strong> APRprogram, providing <strong>the</strong>m with <strong>the</strong> money <strong>the</strong>y needed, and to sell <strong>the</strong> protected land to <strong>the</strong> family.The Verrills also enrolled a significant portion of <strong>the</strong>ir own land in <strong>the</strong> program at <strong>the</strong> same time.Farming protected land changed Steve’s perspective. With no option to sell <strong>the</strong> land <strong>for</strong>development, <strong>the</strong> family was now committed to making <strong>the</strong> farm operation profitable. As aresult, eight years later <strong>the</strong> Verrills sold <strong>the</strong> dairy herd and constructed a retail farm stand. Theoperation quickly expanded and, until <strong>the</strong> fire, included produce, specialty foods, gifts and alarge kitchen and bakery, employing 50 people full time. The Verrills, who are planning torebuild <strong>the</strong> farm store, are proud that <strong>the</strong> farm has become a center of <strong>the</strong> community, hostingevents throughout <strong>the</strong> year. Steve attributes <strong>the</strong> farm’s success largely to <strong>the</strong> APR program andhow it encouraged investments in <strong>the</strong> farm’s future.…Protecting Local Food Production CapacityEdwin Dziekanowski raised Scottish Highland cattle on his 39-acre North Amherst farm untilhe fell ill in 2004 and had to be hospitalized. To cover his care and medical costs, Edwin was<strong>for</strong>ced to sell <strong>the</strong> farm, even though it was his family’s wish that <strong>the</strong> farm remain in agriculture.Developers were offering up to $2 million <strong>for</strong> <strong>the</strong> property.In late 2004, a local non-profit group—newly organized to preserve <strong>the</strong> farm and keep it inagricultural use—struck a deal with <strong>the</strong> Dziekanowski family to purchase <strong>the</strong> farm <strong>for</strong>$1.2 million. The North Amherst Community Farm (NACF) would give <strong>the</strong> family a $600,000downpayment, with <strong>the</strong> balance payable in increments over <strong>the</strong> next five and a half years. Whileincome from renting a portion of <strong>the</strong> land and sales from <strong>the</strong> farm will help offset some costs, <strong>the</strong>majority will be met through fundraising.In 2005, <strong>the</strong> family and NACF worked with APR program staff to enroll 35 of <strong>the</strong> property’s39 acres. The remaining 4 acres will be used <strong>for</strong> houses <strong>for</strong> two families that will work <strong>the</strong> land.The proceeds of <strong>the</strong> sale of <strong>the</strong> APR, along with Community Preservation Act funds from <strong>the</strong> townand approximately $140,000 in private donations, constituted <strong>the</strong> downpayment on <strong>the</strong> farm.NACF’s vision <strong>for</strong> <strong>the</strong> farm includes creating more equitable access to fresh, organic produce <strong>for</strong><strong>the</strong> 10,000 people that live within 1.5-miles of <strong>the</strong> farm. To fulfill that goal, <strong>the</strong> group solicitedproposals from farmers and chose two farm families—one will operate <strong>the</strong> CSA venture and <strong>the</strong>o<strong>the</strong>r will raise grass-fed animals on <strong>the</strong> land <strong>for</strong> meat and eggs. In 2007, 95 families purchasedshares in <strong>the</strong> CSA <strong>for</strong> <strong>the</strong> inaugural season; membership <strong>for</strong> <strong>the</strong> 2008 season has increased to 150.<strong>American</strong> <strong>Farmland</strong> <strong>Trust</strong>9
<strong>Farms</strong> <strong>for</strong> <strong>the</strong> <strong>Future</strong>$16.0Agriculture Preservation Restriction Program:Historic Spending$14.9$14.0Million Millions$12.0$10.0$8.0$7.2 $6.9$7.3$11.1$7.1$8.4$7.9 $7.6$10.0$6.0$4.0$2.0$0.0$0.0FY98 FY99 FY00 FY01 FY02 FY03 FY04 FY05 FY06 FY07 FY 08NOTE: Adjusted <strong>for</strong> Inflation: based upon <strong>the</strong> Bureau of Labor and Statistics CPI calculator: http://data.bls.gov/cgi-bin/cpicalc.plSource: <strong>Massachusetts</strong> Department of Agricultural Resources, 2008Rate of ProtectionSince <strong>the</strong> program’s first APR purchase in 1980, <strong>the</strong>program has protected an average of 2,300 acresper year. The average yearly decline in farmacreage over <strong>the</strong> same general time frame, dependingon <strong>the</strong> data source, is estimated at between2,900 acres and 7,700 acres. 26 Using even <strong>the</strong>most conservative of farmland loss estimates, since1980 <strong>the</strong> Commonwealth has consistently lostmore farmland per year than it has protectedthrough <strong>the</strong> program.Rising land values are reducing <strong>the</strong> program’s rateof farmland protection. Due to escalating farm realestate values, <strong>the</strong> APR program has been payinghigher prices to landowners <strong>for</strong> restrictions. While<strong>the</strong> average price paid per acre over <strong>the</strong> life of <strong>the</strong>program is $2,864, <strong>the</strong> average price paid per acrein 2007 was $6,847. Consequently, <strong>the</strong> number ofacres protected annually has been dropping.Land protected through <strong>the</strong> APR Programto date represents 11.8 percent of <strong>the</strong>Commonwealth’s land in farms.Leveraging Federal, Localand Private ResourcesState expenditures on <strong>the</strong> APR program haveleveraged substantial federal and local funding aswell as private contributions from landownersthrough “bargain sales” (<strong>the</strong> sale of an agriculturalpreservation restriction at a price below itsappraised fair market value). In fiscal years 2004through 2008, 41 percent of <strong>the</strong> value of allAPR projects was contributed from sources o<strong>the</strong>rthan <strong>the</strong> Commonwealth, including landownerbargain sales, private donations, municipalcontributions and federal funding.Between 2003 and 2007, <strong>the</strong> state protectedan average of only 1,828 acres each year—an18 percent drop from <strong>the</strong> historical average. 27Federal: Since 2002, <strong>Massachusetts</strong> has receivedan annual allocation from <strong>the</strong> federal FRPPprogram based on <strong>the</strong> number and value of pendingAPR applications and <strong>the</strong> availability of statefunds. The program provides up to 50 percent of<strong>the</strong> value of <strong>the</strong> APR <strong>for</strong> qualifying parcels. Inorder to take full advantage of <strong>the</strong> federal funding—approximately$25 million since 2002—<strong>the</strong>state requires that virtually all APR applicationsqualify <strong>for</strong> <strong>the</strong> federal program as well. 28Historically, proceeds from <strong>the</strong> federal program,which <strong>Massachusetts</strong> receives in <strong>the</strong> <strong>for</strong>m of areimbursement, have been used to fund programso<strong>the</strong>r than <strong>the</strong> APR program, such as <strong>the</strong> FVEPprogram and o<strong>the</strong>r farm viability initiatives. In achange of approach, <strong>the</strong> Patrick administration infiscal year 2008 reinvested a majority of <strong>the</strong> reimbursement—$2.6million of $3.6 millionreceived—in <strong>the</strong> APR program.10<strong>American</strong> <strong>Farmland</strong> <strong>Trust</strong>
<strong>Massachusetts</strong>’ Investments in <strong>Farmland</strong> ConservationLocal: The APR program also isleveraging three types of local fundingsources. The first is municipalcontributions toward <strong>the</strong> cost of anAPR project. While municipal contributionshave been requested by <strong>the</strong>state <strong>for</strong> years, <strong>the</strong> process was <strong>for</strong>malizedin 2004 when <strong>the</strong> MDARadministratively instituted <strong>the</strong> APRMunicipal Grant Program. Virtuallyall APR applications are now runthrough <strong>the</strong> Municipal GrantProgram, and an applicant’s score andultimate approval are determined inpart on <strong>the</strong> basis of actions taken insupport of agriculture by <strong>the</strong> town inwhich <strong>the</strong> land is located.Private contributions are ano<strong>the</strong>r source of localfunding. One type of private contribution is a“bargain sale,” a donation made by <strong>the</strong>landowner selling <strong>the</strong> agricultural preservationrestriction or a portion of <strong>the</strong> restriction’s fairmarket value. Contributions from individuals,typically made to a land trust that <strong>the</strong>n uses <strong>the</strong>funds to help satisfy <strong>the</strong> local match requirement<strong>for</strong> <strong>the</strong> APR application, are ano<strong>the</strong>r source oflocal funding. 29One of <strong>the</strong> primary requirements of <strong>the</strong> MunicipalGrant Program is a local contribution of up to20 percent of <strong>the</strong> cost of an APR project. A localcontribution can include any or all of <strong>the</strong> threetypes of local funding sources noted above, andtowns can reduce <strong>the</strong> required match by takingMillions$7.0$6.0$5.0$4.0$3.0$2.0$1.0$0.0$8,000$7,000$6,000$5,000$4,000$3,000$2,000$1,000$0Agriculture Preservation Restriction Program:Price Paid Per Acre$2,864HistoricalAverageFederal Farm and Ranch Lands Protection Program:Allocations to <strong>Massachusetts</strong>$2.9$4.5 $4.7$3.8 $4.0$4,749$3,163specific actions to support farming and encouragefarmland protection locally. The program hasmanaged to achieve an overall 20 percent contributionfrom local sources annually and hasexceeded that goal over <strong>the</strong> past five years. Of <strong>the</strong>approximately $66 million in value of APR projectscompleted from fiscal year 2004 throughfiscal year 2008, $8.5 million was contributedthrough landowner “bargain sales,” and an additional$11.1 million from municipalities and landtrusts, <strong>for</strong> an overall 30 percent local contribution.30Role of Land <strong>Trust</strong>s$5,627$6,255$6,8472003 2004 2005 2006 2007Average, 1980-2006AverageThe MDAR estimates that 20 to 30 percent ofAPR applications involve land trusts. Land trustsplay an increasingly important role in <strong>the</strong> programby helping landowners andtowns navigate <strong>the</strong> application$5.9FY03 FY04 FY05 FY06 FY07 FY 08Source: USDA Natural Resources Conservation Services, 2008Source: <strong>Massachusetts</strong> Department of Agricultural Resources, 2007process, finding additional financialresources to contribute toAPR applications, and providinginterim funding to landownersby “pre-acquiring” restrictions.A 2007 survey by AFT of 33land trusts around <strong>the</strong> statefound that land trusts haveei<strong>the</strong>r pre-acquired or played asignificant fundraising role in atleast 89 APR projects involvingover 10,000 acres —one-sixthof all land protected through<strong>the</strong> program.<strong>American</strong> <strong>Farmland</strong> <strong>Trust</strong>11
CHAPTER FOURFarm Viability and Conservation ProgramsFarm Viability Enhancement ProgramThe Farm Viability Enhancement Program (FVEP) has been a powerful tool in helping <strong>Massachusetts</strong>farmers adapt to changing markets and consumer demands. The program provides farmers with two typesof assistance.In Phase I, a team of consultants helps participating farmers develop a “farm viability plan” to improve<strong>the</strong>ir farm profitability. The plan might focus on improved management practices, diversification, directmarketing, possible value-added initiatives, agritourism or some combination <strong>the</strong>reof. The plan may alsoaddress farm environmental and/or energy concerns.Phase II provides funding to implement components of <strong>the</strong> plan; <strong>the</strong> participating farmer must grantto <strong>the</strong> Commonwealth a non-development covenant on <strong>the</strong> land <strong>for</strong> a number of years. The size of <strong>the</strong>grant varies from $25,000 to $100,000 depending on <strong>the</strong> size of <strong>the</strong> farm, <strong>the</strong> components of <strong>the</strong> planto be implemented and <strong>the</strong> length of <strong>the</strong> covenant—five to 10 years. The program holds periodic openapplication periods, typically once or twice a year.Number of Farm Viability covenantsthrough fiscal year 2007<strong>Farms</strong> in 110 towns have participated in <strong>the</strong>covenant phase of <strong>the</strong> FVEP program.Number ofcovenants by town01–45–12Source: <strong>Massachusetts</strong> Department of Agricultural Resources, 2007Program SpendingOver <strong>the</strong> past 10 years, annual spending <strong>for</strong><strong>the</strong> two phases of <strong>the</strong> program has averaged$1.2 million. Since 1996, $1.5 million has beenexpended on Phase I, helping develop viabilityplans <strong>for</strong> 278 farms, or an average of 25 farms ayear. Through Phase II, an additional $11.9 millionhas funded 259 covenants, temporarilyprotecting 29,011 acres of <strong>Massachusetts</strong> farmlandfrom development and providing valuablefinancing <strong>for</strong> farm business improvements. 31The FVEP, authorized under <strong>Massachusetts</strong>General Laws Chapter 20, Section 22, is fundedthrough <strong>the</strong> state’s capital budget. The 2008Environmental Bond bill provided $30 millionover five years <strong>for</strong> a suite of farm viability initiatives,including <strong>the</strong> FVEP. Ano<strong>the</strong>r statute enactedin 2008, <strong>the</strong> Dairy Farm Preservation Act,expands FVEP Phase II eligibility to owners ofland enrolled in <strong>the</strong> APR program, provided <strong>the</strong>implementation funding improves <strong>the</strong> economicviability or productivity of <strong>the</strong> farm, createsadditional jobs and tax revenues, supports onfarmrenewable energy or environmentalremediation projects, or expands and supportsfarm markets and infrastructure that streng<strong>the</strong>n<strong>the</strong> farm industry.Since its enactment in 1996, <strong>the</strong> FVEPhas provided $13.5 million in assistanceto 278 farmers under <strong>the</strong> two phasesof <strong>the</strong> program. 3212<strong>American</strong> <strong>Farmland</strong> <strong>Trust</strong>
<strong>Massachusetts</strong>’ Investments in <strong>Farmland</strong> ConservationFarm Viability Enhancement Program: Connecting <strong>Farms</strong> with ConsumersAt Diemand Farm in Wendell, plans to expand <strong>the</strong> refrigeration capacity are underway, madepossible by <strong>the</strong> FVEP. This is <strong>the</strong> second time <strong>the</strong> farm has made use of <strong>the</strong> program; <strong>the</strong> farmowes its current success in large part, says <strong>the</strong> Diemand family, to changes made through earlierbusiness planning and funding through <strong>the</strong> program.Be<strong>for</strong>e Diemand Farm enrolled in <strong>the</strong> FVEP, customers who wished to purchase <strong>the</strong> farm’s eggswould pick <strong>the</strong>m up from a self-serve outdoor refrigerator on <strong>the</strong> farm. The farm’s turkey potpieswere popular, but <strong>the</strong> farm produced only about 50 of <strong>the</strong>m a year. The FVEP grant changed this.Business planning allowed <strong>the</strong> family to explore <strong>the</strong> expansion of its product line and <strong>the</strong> constructionof a farm store. A Phase II grant put <strong>the</strong> plan into action.Today <strong>the</strong> farm sells eggs, fresh turkeys and chickens, turkey potpies, soups, ground turkey, fruitpies and cookies, maple syrup, honey and compost. The farm’s store employs one full-time andtwo part-time staff, and production of turkey potpies has multiplied to several hundred a year.Diemand Farm products can now be found in University of <strong>Massachusetts</strong> dining halls and in<strong>the</strong> Cooley Dickinson Hospital café and are available at local grocery stores and through a homedelivery service. Expanding <strong>the</strong> refrigeration capacity will open <strong>the</strong> door to fur<strong>the</strong>r market opportunities,helping <strong>the</strong> family meet growing demand <strong>for</strong> its products.Program DemandDemand <strong>for</strong> <strong>the</strong> FVEP has been relatively constant.In <strong>the</strong> past five years, <strong>the</strong> program received 293applications, 68 of which went unfunded. Whilesome of <strong>the</strong>se applications were deemed ineligible,some would likely have been funded had <strong>the</strong>resources been available. As older covenantsexpire, many program participants are seekingrenewal contracts to implement o<strong>the</strong>r componentsof <strong>the</strong>ir viability plan. Since 2004, 25 renewalapplications have been accepted. 33Leveraging Private DollarsAs with any type of business, farm upgrades andexpansions can be costly. The FVEP has helpedleverage bank financing <strong>for</strong> farm business improvementsand additional farm owner investments.Of FVEP participants to date, 73 percent haveinvested additional funds to complete improvementsdescribed in <strong>the</strong>ir viability plans. The totalestimated value of <strong>the</strong>se leveraged funds is overSeventy-three percent of FVEP participantscontribute additional funds to implement<strong>the</strong>ir viability plans, at an averageof $31,791 per farm. 35O<strong>the</strong>r Farm Viability ProgramsIn addition to <strong>the</strong> FVEP, a number of smaller programsare funded through <strong>the</strong> “farm viability”capital account.ACCELERATED CONSERVATIONPLANNING PARTNERSHIPWell-managed farms can provide multiple environmentalbenefits, from carbon sequestration towater filtration to wildlife habitat. While somefarming practices that provide habitat, conservewater or energy, or reduce fertilizer or pesticideuse are inexpensive to implement, o<strong>the</strong>rs can becomplicated and expensive. Accordingly, severalfederal and state conservation programs havebeen created to help farmers plan <strong>for</strong> and adoptconservation measures. One such program is <strong>the</strong>state’s Accelerated Conservation PlanningPartnership (ACPP), a program that helps farmersidentify <strong>the</strong> type of conservation practices thatmake sense <strong>for</strong> <strong>the</strong>ir farm.ACPP’s conservation planners provide farmersand o<strong>the</strong>r landowners with in<strong>for</strong>mation aboutstate and federal farm conservation programs.The program has developed conservation plans<strong>for</strong> more than 15,000 acres in nine <strong>Massachusetts</strong>counties, helping to ensure landowner eligibility<strong>for</strong> <strong>the</strong>se programs. Participants in <strong>the</strong> APR$6 million. 34 13<strong>American</strong> <strong>Farmland</strong> <strong>Trust</strong>
<strong>Farms</strong> <strong>for</strong> <strong>the</strong> <strong>Future</strong>program, <strong>the</strong> FVEP program, and <strong>the</strong> state’s AEEPare given priority as each of <strong>the</strong>se programsrequires that farmers have and comply with afarm conservation plan. The Commonwealth’sannual investment of around $200,000 has beenmatched with equal funding from USDA’s NaturalResources Conservation Service (NRCS). 36FARM-TO-SCHOOLInterest in serving locally grown foods in schoolcafeterias and o<strong>the</strong>r public and private institutionshas increased dramatically in recent years, and arecently enacted state “agricultural preference”law is intended to encourage this trend.Through support <strong>for</strong> <strong>the</strong> Farm-to-School Project,<strong>the</strong> MDAR helps match farm suppliers with institutions.In <strong>the</strong> past three years, <strong>the</strong> number offarms selling directly to schools has grown from20 to 69. State spending on this initiative totaled$65,000 in 2005 and 2006. The program’s totalbudget <strong>for</strong> 2008–2009 is $133,000. 37Over 167 public school districts,private schools and colleges around <strong>the</strong> statenow serve local foods.AGRICULTURE BUSINESS TRAINING PROGRAMThe Agricultural Business Training Program(ABTP) provides locally tailored business trainingto farmers around <strong>the</strong> state. The program offersmultiple course <strong>for</strong>mats, including a 10-sessiongeneral agriculture business course (Tilling <strong>the</strong>Soil of Opportunity) and beginning farmertraining (Exploring Your Small Farm Dream).Co-sponsors of <strong>the</strong>se courses have includedregional “Buy Local” campaigns, ResourceConservation and Development Councils,Community Development Corporations, andcommodity associations.Since <strong>the</strong> program began, more than 300 farmbusinesses have graduated from <strong>the</strong> program’svarious courses. From 2001 to 2005, <strong>the</strong> programspent approximately $15,000 per year, some ofwhich came from federal grants. In 2006 and2007, program spending increased to $30,000with new course <strong>for</strong>mats. The MDAR anticipatesthat <strong>the</strong> program will cost $35,000 annually infuture years. 38Improving on-farm irrigation efficiencyrelieves pressure on public water supplies andimproves stream flows <strong>for</strong> fish and o<strong>the</strong>raquatic species.AGRICULTURAL ENVIRONMENTALENHANCEMENT PROGRAMThe AEEP is designed to help farms mitigate <strong>the</strong>irimpact on <strong>the</strong> environment and to encourage environmentalstewardship. While primarily a waterquality program, AEEP also funds practices thatpromote energy efficiency, conserve water and$2.5Farm Viability Enhancement Program:Historic Spending$2.1Million MIllions$2.0$1.5$1.0$1.3$0.8$1.7$1.5$1.0 $1.0$1.5$1.2$1.1$1.2$0.5$0.0FY98 FY99 FY00 FY01 FY02 FY03 FY04 FY05 FY06 FY07 FY08NOTE: Adjusted <strong>for</strong> Inflation: based upon <strong>the</strong> Bureau of Labor and Statistics CPI calculator: http://data.bls.gov/cgi-bin/cpicalc.plSource: <strong>Massachusetts</strong> Department of Agricultural Resources, 200814<strong>American</strong> <strong>Farmland</strong> <strong>Trust</strong>
<strong>Massachusetts</strong>’ Investments in <strong>Farmland</strong> Conservationreduce greenhouse gas emissions.Participating farmers are reimbursed<strong>for</strong> <strong>the</strong> cost of materials,up to $30,000.Since 1999, <strong>the</strong> program hasfunded 267 projects statewide.These projects have rangedfrom <strong>the</strong> installation of animalmanure waste systems to pesticidestorage facilities to fencing tokeep livestock away fromwetlands and water supplies.Conservation practices like<strong>the</strong>se can help farmers reduceexpenses, provide valuable publicbenefits and, in some cases, commandhigher prices <strong>for</strong> products. These practicesalso help farmers comply with federal rules, such asthose that regulate animal feeding operations.Program SpendingMillions$18.0$16.0$14.0$12.0$10.0$8.0$6.0$4.0$2.0$0.0Since 1999, <strong>the</strong> program has awarded 267 grantsto farmers, totaling $2.3 million. Annual programspending has averaged about $270,000, and, over<strong>the</strong> past three years, about 29 farms a year havereceived grants. 39 The 2008 Environmental Bondbill provides $3 million in bond authority <strong>for</strong> <strong>the</strong>program over <strong>the</strong> next five years.$9.0AEEP: Helping <strong>Farms</strong> Make Good NeighborsWater is a critical component of cranberry production. Tocontrol <strong>the</strong> water flow from a bog, cranberry growers oftenuse “flumes,” boards made out of steel, aluminum or concrete.After applying pesticides, growers will hold water in abog <strong>for</strong> a number of days until <strong>the</strong> pesticides become inactiveand can be released without threat of harm. During this time,it is important that <strong>the</strong>re not be seepage through <strong>the</strong> flumes.AEEP funding has helped at least one cranberry grower withdeteriorated flumes. 41 Such assistance is helping cranberrygrowers make good neighbors.Demand <strong>for</strong> Conservation Cost-Share Assistance$15.6Program Demand$3.6 $3.2$5.5FY03 FY04 FY05 FY06 FY07Unfunded Applications to <strong>the</strong> Environmental Quality Incentives ProgramSource: USDA Natural Resources Conservation Service, 2008This program consistently receives two-and-a-halftimes <strong>the</strong> number of requests <strong>for</strong> eligible projectsthan can be funded. In 2008, <strong>the</strong> program receivedrequests <strong>for</strong> approximately $900,000 in cost-shareassistance with only $400,000 available.A particular strength of <strong>the</strong> AEEP program is itsability to complement federal funding <strong>for</strong> environmentalquality practices on farms, thus enabling<strong>the</strong> completion of, <strong>for</strong> example, a costly manuremanagement system that o<strong>the</strong>rwise afarmer could not have af<strong>for</strong>ded.The USDA administers a programsimilar to AEEP known as <strong>the</strong>Environmental Quality IncentivesProgram (EQIP). The program helpsfinance structural or managementpractices that promote environmentalquality and is consistently oversubscribedin <strong>Massachusetts</strong>. From2003 to 2006, <strong>the</strong>re were 1,301applications to <strong>the</strong> program fromfarmers around <strong>the</strong> state—requesting$31.4 million in conservation costshareassistance—that wentunfunded. 40 The unmet demand <strong>for</strong>this program suggests a need <strong>for</strong>additional AEEP funding.<strong>American</strong> <strong>Farmland</strong> <strong>Trust</strong>15
CHAPTER FIVERecommendationsAgricultural Preservation Restriction ProgramTo protect 20 percent of <strong>the</strong> Commonwealth’s land in farms by 2020 will require anincreased investment of $25–$30 million annually. A yearly investment of $15 millionis needed simply to keep pace with historic protection rates.Less than 12 percent of <strong>Massachusetts</strong>’ land in farms is permanently protected, yet <strong>the</strong> amountof land enrolled annually through <strong>the</strong> APR program has been declining as <strong>the</strong> cost of protectingit has been rising. While land values may be leveling off, an increase in current spending, to$15 million annually, will be required just to keep pace with <strong>the</strong> program’s historic average of2,300 acres protected per year. With a population of aging farmers and non-farming landownersretiring and relocating, farmland in <strong>Massachusetts</strong> is especially vulnerable to development as itpasses from one generation to <strong>the</strong> next. An aggressive goal of permanently protecting a total of20 percent of <strong>the</strong> Commonwealth’s farmland by 2020 would provide new opportunities <strong>for</strong>young and beginning farmers, spur additional investments in farm businesses, and help stabilize aland base that is growing in importance <strong>for</strong> local food and renewable energy production, waterfiltration and carbon sequestration.Reinvest all funds received from <strong>the</strong> federal Farm and Ranch Lands Protectionprogram in <strong>the</strong> APR program.From 2003 through 2007, <strong>the</strong> U.S. Department of Agriculture allocated over $19 million to<strong>Massachusetts</strong> through <strong>the</strong> federal Farm and Ranch Lands Protection Program (FRPP). Yet<strong>Massachusetts</strong> has used less than $9 million of that funding <strong>for</strong> <strong>the</strong> APR program. While <strong>the</strong>Department of Agricultural Resources (MDAR) is under no obligation to use <strong>the</strong> FRPP reimbursement<strong>for</strong> <strong>the</strong> program, <strong>the</strong> use of this funding <strong>for</strong> o<strong>the</strong>r programs within <strong>the</strong> department,primarily <strong>the</strong> Farm Viability Enhancement Program (FVEP), has limited <strong>the</strong> impact of <strong>the</strong> federalprogram’s focus on permanent farmland protection ef<strong>for</strong>ts. The Patrick administration has madean important change in this regard, dedicating $2.6 million of <strong>the</strong> $3.6 million of <strong>the</strong> 2007 reimbursementto <strong>the</strong> APR program. An investment of <strong>the</strong> entire FRPP reimbursement—$5.7 millionin 2008 and potentially higher in future years as FRPP spending increases under <strong>the</strong> 2008Farm Bill—in addition to <strong>the</strong> yearly $13.35 million state investment as envisioned in <strong>the</strong> 2008Environmental Bond would provide <strong>the</strong> APR Program with $19 million. This would allow <strong>the</strong>program to improve its monitoring and en<strong>for</strong>cement of existing restrictions while aggressivelypursuing new acquisitions.Establish a process to consider changes in APR program policies.New regulations <strong>for</strong> <strong>the</strong> APR program are expected in 2009. While <strong>the</strong>se regulations willprovide needed guidance on program implementation, <strong>the</strong>y are not likely to address a number ofimportant program policies that impact <strong>the</strong> type and quality of applications to <strong>the</strong> program, <strong>the</strong>selection and approval process, and <strong>the</strong> continued viability of farms with land enrolled in <strong>the</strong>program. These policies include <strong>the</strong> program’s current cap on prices paid per acre, its eligibilitycriteria and ranking system, <strong>the</strong> local contribution requirement, and its policy with regard tohousing on protected parcels. The MDAR should establish a <strong>for</strong>mal process that invites stakeholderparticipation in <strong>the</strong> review of and recommendation <strong>for</strong> changes to <strong>the</strong>se and o<strong>the</strong>rprogram policies.16<strong>American</strong> <strong>Farmland</strong> <strong>Trust</strong>
<strong>Massachusetts</strong>’ Investments in <strong>Farmland</strong> ConservationExpand <strong>the</strong> Agricultural Lands Preservation Committee to include two newmembers—a land trust representative and a municipal representative.Established in <strong>the</strong> statute that created <strong>the</strong> APR Program, <strong>the</strong> Agricultural Lands PreservationCommittee evaluates and acts on APR applications and advises <strong>the</strong> MDAR on program implementation.The nine-member committee consists of <strong>the</strong> Commissioner of Agriculture; <strong>the</strong> Chairof <strong>the</strong> Board of Agriculture; representatives from <strong>the</strong> Executive Office of Energy andEnvironmental Affairs, Department of Housing and Community Development, and Office ofState Planning; and four public members appointed by <strong>the</strong> Governor, two of whom must befarmers. There are two non-voting members—<strong>the</strong> Dean of <strong>the</strong> College of Food and NaturalResources at University of <strong>Massachusetts</strong> and <strong>the</strong> USDA Natural Resources Conservation ServiceState Conservationist. Given <strong>the</strong> significant role both land trusts and local governments now playin identifying, financing and stewarding APR projects, adding representation from <strong>the</strong>se twocommunities would provide valuable perspective.Report annually on <strong>the</strong> program’s progress and undertake a comprehensiveprogram evaluation.In 2008, 31 years after its creation and 28 after buying its first restriction, <strong>the</strong> APR Program hit amilestone of 60,000 acres enrolled. There is little, though, to measure this milestone against.While many o<strong>the</strong>r state Purchase of Conservation Easement (PACE) programs have acreage goalsor a process <strong>for</strong> evaluating <strong>the</strong>ir progress, <strong>the</strong> APR program has nei<strong>the</strong>r. An annual reportrequired by <strong>Massachusetts</strong> General Law Chapter 20 Section 25, which is intended to provide <strong>the</strong>number and geographic distribution of APR applications accepted and rejected, <strong>the</strong> acreage andcosts of purchases, and “such o<strong>the</strong>r in<strong>for</strong>mation as will enable <strong>the</strong> program to be evaluated,” hasnot been produced in recent years, nor has a comprehensive evaluation been undertaken. Suchan evaluation, which might examine <strong>the</strong> ownership patterns of APR land, <strong>the</strong> type and extent offarm products being produced, <strong>the</strong> profitability of farms with APR land relative to farms thathave not enrolled land in <strong>the</strong> program, and <strong>the</strong> geographic location of APR land relative to stateinfrastructure investments and areas of significant farmland loss, could help chart a path anddevelop goals <strong>for</strong> <strong>the</strong> program <strong>for</strong> <strong>the</strong> next 10 years.Farm Viability ProgramsInvest at least $4 million annually in <strong>the</strong> Department of Agricultural Resources’ suiteof Farm Viability programs, including <strong>the</strong> Farm Viability Enhancement Program, <strong>the</strong>Farm Energy Program, <strong>the</strong> Accelerated Conservation Planning Partnership, and <strong>the</strong>Farm-to-School Project.This level of investment is in accord with <strong>the</strong> 2008 Environmental Bond, which provides$30 million <strong>for</strong> <strong>the</strong>se and o<strong>the</strong>r programs, including a $10 million earmark to facilitate <strong>the</strong>creation of a public market in Boston. As noted in Chapter Four, yearly spending on <strong>the</strong> FVEPprogram over <strong>the</strong> past 10 years has averaged $1.2 million; this small investment in farm businessplanning and <strong>the</strong> implementation of those business plans have not only improved farm profitability,but helped to connect farmers and consumers by supporting <strong>the</strong> transition of farms fromwholesale to retail marketing and value-added product development. A yearly investment of$2 million in <strong>the</strong> FVEP could allow a small increase in farms served by <strong>the</strong> program in additionto expanding implementation grants to farms now enrolled in <strong>the</strong> APR program as authorizedthrough <strong>the</strong> 2008 Dairy Farm Preservation Act, leaving an equal amount to fund <strong>the</strong> o<strong>the</strong>rvaluable programs within <strong>the</strong> farm viability bond account.<strong>American</strong> <strong>Farmland</strong> <strong>Trust</strong>17
<strong>Farms</strong> <strong>for</strong> <strong>the</strong> <strong>Future</strong>Report annually on <strong>the</strong> Farm Viability Enhancement Program’s progress and undertakea comprehensive program evaluation.As with <strong>the</strong> APR program, <strong>the</strong>re is no regular report on <strong>the</strong> yearly milestones <strong>for</strong> <strong>the</strong> FVEPprogram nor has <strong>the</strong>re been a comprehensive evaluation of <strong>the</strong> program to date. Such anevaluation is especially needed as <strong>the</strong> MDAR begins to allow farmers to seek successive FVEPimplementation grants at <strong>the</strong> end of <strong>the</strong>ir initial grant term. An evaluation that quantifies <strong>the</strong>increases in sales, net income and employment on participating farms, as well as improvementsin productivity, technology and marketing could help to underscore <strong>the</strong> program’s benefits andprovide valuable perspective on program direction <strong>for</strong> <strong>the</strong> next 10 years.Encourage <strong>the</strong> transition of farms from <strong>the</strong> Farm Viability Enhancement Programto <strong>the</strong> Agricultural Preservation Restriction Program.Current policy discourages farmers who are participating in <strong>the</strong> FVEP from transitioning landinto <strong>the</strong> APR Program, by requiring farmers to reimburse <strong>the</strong> entire implementation grant when<strong>the</strong>y enroll land in <strong>the</strong> APR program, regardless of where <strong>the</strong>y may be in <strong>the</strong> length of <strong>the</strong>irFVEP contract. For example, a farmer who receives a $75,000 FVEP grant and signs a 10-yearno-development covenant on 100 acres of farmland must repay <strong>the</strong> entire $75,000 grant if, inyear seven, <strong>the</strong> farmer wishes to enroll those 100 acres in <strong>the</strong> APR program. A policy that prorates<strong>the</strong> required reimbursement to <strong>the</strong> length of time remaining in a FVEP contract—in <strong>the</strong>above example, $22,500 ra<strong>the</strong>r than $75,000—would encourage <strong>the</strong> transition of farmlandfrom one program to <strong>the</strong> o<strong>the</strong>r.Agricultural Environmental Enhancement ProgramInvest at least $1 million annually in <strong>the</strong> Agricultural EnvironmentalEnhancement Program.An investment of this size would require additional bond authority above <strong>the</strong> $3 millionprovided in <strong>the</strong> 2008 Environmental Bond, yet would serve to maximize <strong>the</strong> environmentalbenefits produced by <strong>the</strong> Commonwealth’s 518,000 acres of working farmland. Much as <strong>the</strong>Agricultural Conservation Planning Partnership, which funds <strong>the</strong> development of whole farmconservation plans, is comparable to <strong>the</strong> business planning phase of <strong>the</strong> FVEP, <strong>the</strong> AEEP is likePhase II of that program, funding <strong>the</strong> implementation of conservation plans. Unlike <strong>for</strong> farmbusiness plans, <strong>the</strong>re are significant federal resources available <strong>for</strong> conservation plan implementation.Funding <strong>for</strong> <strong>the</strong> federal Environmental Quality Incentives Program (EQIP)—thatprovides grants to farmers to implement on-farm energy, air, soil and water conservationpractices—is scheduled to ramp up over <strong>the</strong> next five years, and <strong>the</strong> Farm Bill’s “regionalequity” provision will help to ensure that some of that funding increase comes to <strong>Massachusetts</strong>.As EQIP generally requires a 25-50 percent cost-share, increased funding <strong>for</strong> AEEP should allow<strong>Massachusetts</strong> farmers to leverage significant new federal resources <strong>for</strong> practices that will leadto cleaner air and water and reduced water and energy use.18<strong>American</strong> <strong>Farmland</strong> <strong>Trust</strong>
<strong>Massachusetts</strong>’ Investments in <strong>Farmland</strong> ConservationExpanding <strong>the</strong> <strong>Farmland</strong> Conservation ToolboxOver <strong>the</strong> past 30 years, <strong>Massachusetts</strong> has created and substantially invested in programs tohelp secure <strong>the</strong> Commonwealth’s farmland base and improve <strong>the</strong> economic and environmentalsustainability of its farms. Some of <strong>the</strong>se programs, like <strong>the</strong> FVEP, and initiatives, like <strong>the</strong> APRprogram’s “option at agricultural value,” were groundbreaking policy innovations that havebeen emulated in o<strong>the</strong>r states. Ano<strong>the</strong>r program not detailed in this report but valuable as a tool<strong>for</strong> financing farmland protection projects—<strong>the</strong> Community Preservation Act—has beenano<strong>the</strong>r national model.As <strong>the</strong> agricultural industry’s land uses and needs evolve and environmental conditions change,<strong>the</strong>re is both a need to evaluate and examine <strong>the</strong> effectiveness of <strong>the</strong> current farmland conservationtoolbox and a need to assess whe<strong>the</strong>r new and complementary tools may be needed. Somepotential tools that may be worthy of additional exploration are identified below. AFT hopesthat this initial, partial list may provide a starting point <strong>for</strong> dialogue and innovative thinkingamong farmers and conservationists, community leaders and policy makers, about new policyinitiatives that can continue <strong>the</strong> Commonwealth’s important commitment to ensuring farms <strong>for</strong><strong>the</strong> future.New financing <strong>for</strong> farmland protection: Installment Purchase AgreementsInstallment Purchase Agreements, or “IPAs,” have been used <strong>for</strong> years by o<strong>the</strong>r state andcounty farmland protection programs as a means of providing landowners who sell agriculturalconservation easements with a phased payment option that defers capital gains andprovides annual interest payments while stretching public funding <strong>for</strong> farmland protectionby providing less cash to <strong>the</strong> seller up front. Offering a long-term payment contract optionthat can be sold or securitized at any time to realize <strong>the</strong> outstanding principal may attractnew interest from land-owners in <strong>the</strong> APR program.Coordinating smart growth, farmland protection and agricultural economic development<strong>Massachusetts</strong>’ Agricultural Incentive Area statute (M.G.L. Chapter 40L) has been largelyignored because of its lack of incentives to municipalities or farmers. A revised Chapter 40Lcould provide new incentives to communities to identify agricultural or farm and <strong>for</strong>est districtsand encourage land protection within those districts, while targeting new or currentstate benefits to <strong>the</strong> landowners within those districts.Linking farm pensions and farmland protectionFor many farmers, <strong>the</strong>ir land is <strong>the</strong>ir pension. With <strong>the</strong> equity in <strong>the</strong>ir land often <strong>the</strong>ir onlysource of retirement income, <strong>the</strong>y may need to sell individual farmland parcels or <strong>the</strong>irentire farm <strong>for</strong> top value—typically <strong>for</strong> development. One possible way to avoid this situationis to actually turn <strong>the</strong> preservation of a farm into a retirement <strong>for</strong> its owner. TheDelaware Department of Agriculture is exploring <strong>the</strong> mechanics and feasibility of a programthat could link pensions and farmland protection.Compensating farmers <strong>for</strong> ecosystem servicesAs discussed in Chapter Two, <strong>Massachusetts</strong> farmers provide a number of “non-market”ecosystem services, including air cleansing, water filtration, reduction of runoff and sedimentation,carbon sequestration and wildlife habitat. A potential compensation program thatoffers payments to farmers in exchange <strong>for</strong> following prescribed conservation “best managementpractices” such as no-till cultivation, water-conserving irrigation, nutrient managementor Integrated Pest Management, could improve farm profitability while protecting farmlandand addressing some of <strong>the</strong> Commonwealth’s environmental needs and concerns.<strong>American</strong> <strong>Farmland</strong> <strong>Trust</strong>19
<strong>Farms</strong> <strong>for</strong> <strong>the</strong> <strong>Future</strong>EndnotesChapter OneCommonwealth <strong>Farms</strong>: Many Products, Many Benefits1 <strong>Massachusetts</strong> Department of Agricultural Resources, Fingertip Facts:http://www.mass.gov/agr/facts/fingertip.htm Accessed: 3/10/2008;USDA National Agricultural Statistics Service, 2002 Census ofAgriculture, 2002.2 First Pioneer Farm Credit, Report on <strong>the</strong> Economic Impact ofAgriculture on <strong>the</strong> Town of Carver, <strong>Massachusetts</strong>, 2006.3 <strong>Massachusetts</strong> Office of Travel and Tourism:http://www.mass-vacation.com/ Accessed: 3/10/2008.4 <strong>American</strong> <strong>Farmland</strong> <strong>Trust</strong>, <strong>Farmland</strong> In<strong>for</strong>mation Center, Fact Sheet:Cost of Community Services, 2007.5 Ibid.6 <strong>Massachusetts</strong> Audubon Society, Losing Ground: At What Cost?,2003; USDA National Agricultural Statistics Service, 2002 Census ofAgriculture, 2002.7 Community Involved in Sustainable Agriculture, Greenburg QuinlanRosner Research, Continued Success Seven Years Into CISA’s Campaign,2006.8 National Sustainable Agriculture In<strong>for</strong>mation Service, Reducing FoodMiles: http://www.attra.org/farm_energy/food_miles.html Accessed:3/10/2008.9 Federation of <strong>Massachusetts</strong> Farmers’ Markets:http://www.massfarmersmarkets.org/ Accessed: 2/25/2008.10 David Holm, Daniel Lass, Richard Rogers, and David Damery,Agriculture’s Hold on <strong>the</strong> Commonwealth, 2000, University of<strong>Massachusetts</strong> Amherst.11 Wildlands <strong>Trust</strong>: http://www.wildlandstrust.org/ Accessed:3/10/2008.12 <strong>Massachusetts</strong> Agricultural Commissions, About AgComs: MAAgComs, 2008: http://www.massagcom.org/about/maagcoms.htmlAccessed: 3/10/2008; based on statistics from <strong>the</strong> <strong>Massachusetts</strong>Department of Agricultural Resources, 2008.13 Commonwealth Conservation Coalition, <strong>Massachusetts</strong> StatewideSurvey, April 2007; poll conducted by Barry Zeplowitz andAssociates.Chapter TwoFarming in <strong>the</strong> Commonwealth Today: Challenges and Opportunities14 USDA National Agricultural Statistics Service, Annual Bulletin: NewEngland Agricultural Statistics, 2007: http://www.nass.usda.gov/nh/07start.htm/ Accessed: 8/14/2008.15 Ibid.16 USDA National Agricultural Statistics Service, 2008 Farm RealEstate Value by State, 2008.17 Ibid.18 USDA National Agricultural Statistics Service, 2002 Census ofAgriculture.19 USDA National Agricultural Statistics Service,2002 Census ofAgriculture; USDA National Agricultural Statistics Service, AnnualBulletin: New England Agricultural Statistics, 2006, 2007.20 USDA National Agricultural Statistics Service, 2002 Census ofAgriculture.21 Energy In<strong>for</strong>mation Administration, Department of Energy, StateData <strong>for</strong> Prices, 2004: http://tonto.eia.doe.gov/state/SEPMorePrices.cfm/ Accessed: 3/10/2008.22 Ibid.Chapter Three Agriculture Preservation Restriction Program23 Figure as of 11/2008; based on statistics from <strong>the</strong> <strong>Massachusetts</strong>Department of Agricultural Resources, 2007.24 Figure not adjusted <strong>for</strong> inflation; based on statistics from <strong>the</strong><strong>Massachusetts</strong> Department of Agricultural Resources, 2007.25 Based on statistics from <strong>the</strong> <strong>Massachusetts</strong> Department ofAgricultural Resources, 2007.26 Compiled sources cover <strong>the</strong> time period of 1982 to 2003. USDANatural Resources Conservation Service, 1997 Five-Year NaturalResources Inventory, 1997; USDA National Agricultural StatisticsService, 2002 Census of Agriculture; <strong>Massachusetts</strong> GeographicIn<strong>for</strong>mation Service, Land Use Summary Statistics, 2003:http://www.mass.gov/mgis/landuse_stats.htm. Accessed: 3/10/2008.27 Based on statistics from <strong>the</strong> <strong>Massachusetts</strong> Department ofAgricultural Resources, 2007.28 Ibid.29 Ibid.30 The federal Farm and Ranch Lands Protection Program contributedapproximately $6.9 million or 11percent toward <strong>the</strong> $66 million invalue of APR projects from FY04 to FY08.Chapter FourFarm Viability and Conservation Programs31 Based on statistics from <strong>the</strong> <strong>Massachusetts</strong> Department of Agricultural 35 Ibid.Resources, 2007. Note: <strong>the</strong> total expenditures and total participating 36 Ibid.farms in Phase I & II include an older component of Farm Viability 37 Ibid.entitled Cranberry Viability. This program is now fully incorporated38into Farm Viability: cranberry growers can apply to Farm Viability in Ibid.<strong>the</strong> same way o<strong>the</strong>r farmers apply.39 Ibid.32 Based on statistics from <strong>the</strong> <strong>Massachusetts</strong> Department of Agricultural 40 USDA Natural Resources Conservation Service, EnvironmentalResources, 2007. Note: Figure does not double count <strong>the</strong> 2,506 acres Quality Incentives Program, 2007: http://www.nrcs.usda.gov/that have been placed under new covenants after <strong>the</strong> first termPROGRAMS/EQIP/ Accessed: 3/10/2008.expired.41 <strong>Massachusetts</strong> Department of Agricultural Resources, <strong>Massachusetts</strong>33 Based on statistics from <strong>the</strong> <strong>Massachusetts</strong> Department of Agricultural Agricultural Environmental Enhancement Program, 2007:Resources, 2007.http://www.mass.gov/agr/programs/aeep/index.htm. Accessed:34 Ibid. 6/2/2007; University of <strong>Massachusetts</strong> Amherst, UMass CranberryStation, Best Management Practices – Guides, 2000.20<strong>American</strong> <strong>Farmland</strong> <strong>Trust</strong>
National Office1200 18th Street, NWSuite 800Washington, DC 20036(202) 331-7300www.farmland.org<strong>Farmland</strong> In<strong>for</strong>mation Center1 Short StreetSuite 2Northampton, MA 01060(413) 586-4593www.farmlandinfo.orgNew England Office1 Short StreetSuite 2Northampton, MA 01060(413) 586-4593, ext. 29

![Farmland by the Numbers [PDF] - American Farmland Trust](https://img.yumpu.com/31549391/1/190x245/farmland-by-the-numbers-pdf-american-farmland-trust.jpg?quality=85)