Energy Indicators for Sustainable Development ... - IAEA Publications
Energy Indicators for Sustainable Development ... - IAEA Publications
Energy Indicators for Sustainable Development ... - IAEA Publications
Create successful ePaper yourself
Turn your PDF publications into a flip-book with our unique Google optimized e-Paper software.
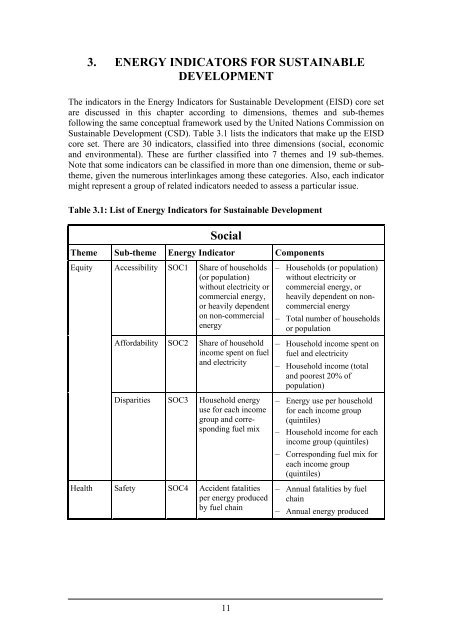
3. ENERGY INDICATORS FOR SUSTAINABLEDEVELOPMENTThe indicators in the <strong>Energy</strong> <strong>Indicators</strong> <strong>for</strong> <strong>Sustainable</strong> <strong>Development</strong> (EISD) core setare discussed in this chapter according to dimensions, themes and sub-themesfollowing the same conceptual framework used by the United Nations Commission on<strong>Sustainable</strong> <strong>Development</strong> (CSD). Table 3.1 lists the indicators that make up the EISDcore set. There are 30 indicators, classified into three dimensions (social, economicand environmental). These are further classified into 7 themes and 19 sub-themes.Note that some indicators can be classified in more than one dimension, theme or subtheme,given the numerous interlinkages among these categories. Also, each indicatormight represent a group of related indicators needed to assess a particular issue.Table 3.1: List of <strong>Energy</strong> <strong>Indicators</strong> <strong>for</strong> <strong>Sustainable</strong> <strong>Development</strong>SocialTheme Sub-theme <strong>Energy</strong> Indicator ComponentsEquityAccessibility SOC1 Share of households(or population)without electricity orcommercial energy,or heavily dependenton non-commercialenergyAf<strong>for</strong>dability SOC2 Share of householdincome spent on fueland electricityDisparities SOC3 Household energyuse <strong>for</strong> each incomegroup and correspondingfuel mixHealth Safety SOC4 Accident fatalitiesper energy producedby fuel chain– Households (or population)without electricity orcommercial energy, orheavily dependent on noncommercialenergy– Total number of householdsor population– Household income spent onfuel and electricity– Household income (totaland poorest 20% ofpopulation)– <strong>Energy</strong> use per household<strong>for</strong> each income group(quintiles)– Household income <strong>for</strong> eachincome group (quintiles)– Corresponding fuel mix <strong>for</strong>each income group(quintiles)– Annual fatalities by fuelchain– Annual energy produced11


