1 THE CHALLENGES OF TESTING PHASOR MEASUREMENT ...
1 THE CHALLENGES OF TESTING PHASOR MEASUREMENT ...
1 THE CHALLENGES OF TESTING PHASOR MEASUREMENT ...

You also want an ePaper? Increase the reach of your titles
YUMPU automatically turns print PDFs into web optimized ePapers that Google loves.
<strong>THE</strong> <strong>CHALLENGES</strong> <strong>OF</strong> <strong>TESTING</strong> <strong>PHASOR</strong> <strong>MEASUREMENT</strong> UNIT (PMU)WITH A DISTURBANCE FAULT RECORDER (DFR)Krish Narendra, Zhiying Zhang, John LaneNxtPhase T&D CorporationEd Khan, Jim WoodDoble EngineeringABSTRACTPhasor Measurement Unit (PMU) is an emerging technology in Electric Power Systems which has many advantages inWide Area Disturbance Analysis, Protection and Control. In order to utilize the benefits of this technology and to arrive atcommon way of representing, reporting and utilizing Phasor measurements, the IEEE standards committee revised theexisting 1344 standard for synchrophasors and recently published “IEEE Standard for Synchrophasors for Power Systems-C37.118- 2005”. The new standard mandates compliance levels (level 0 and / or level 1) for the PMU under steady stateconditions. This paper discusses some of the challenges of testing the PMU - a software module available with the DFR asper the new standard. The possible sources of errors and the current state of the art of the calibration equipment whichqualifies for PMU testing will also be discussed. A demonstration of testing the PMU using Doble F1650 instrument will bepart of this paper presentation.1. 0 OVERVIEWSynchrophasors – phasor measurements with phase angles referenced to a global time standard – coordinated universal time(UTC) – have been used in limited scope by electric power utilities in North America for well over a decade as a means ofmeasuring and predicting dynamic stability of the power grid. Recently, growing concern about the stability of the powersystem has increased interest in the use of synchrophasors on a broader scale. The formulation of a new standard to definethe calculation and transmission of synchrophasors in real time (IEEE C37.118 – 2005) [1], and the launch of a majorsynchrophasor project on the eastern north American power grid (North American Synchro Phasor Initiative (NASPI) [2] –formerly EIPP) have solidified the requirement for devices which can provide synchrophasor measurements in real time.With the recent blackouts that have occurred in the US, the concept of wide area protection using synchrophasormeasurements is gaining considerable momentum. The key components in successfully implementing a wide areaprotection are the PMUs. The PMUs are precision level measurement units installed at various substations within an areato implement an area of wider protection.The recent synchrophasor standard C37.118 mandates compliance levels (level 0 and / or level 1) for the PMU under steadystate conditions. This paper discusses some of the challenges of testing the PMU - a software module available with theDFR as per the new standard. The possible sources of errors and the current state of the art of the testing equipment whichqualifies for PMU testing will be discussed.A number of references are available [1],[3],[4],[5] which explains the meaning , convention and communication aspects ofthe PMU. Very few literatures are available on the calibration and testing of PMU. The NASPI [2] is actively involved inimproving the concept of PMU and its applicability under a number of task forces. One of the Performance RequirementTask Team (PRTT) is involved in addressing the calibration and testing of the PMUs.This paper focuses on the challenges of testing PMU with a DFR using testing equipments that are commonly utilized bymany electrical utilities for calibration and testing of protection relays and recording devices.1
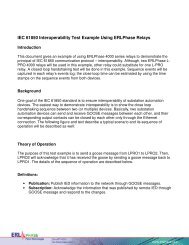
2.0 PMU WITH A DISTURBANCE FAULT RECORDERThe DFR used in this test is a multi-time frame recording system used to monitor electrical power systems. It can record upto 36 analog channels and 64 digital (status) channels and store up to 1000 recordings. Up to four recorders can be operatedas a cooperative group to achieve greater numbers of channels. The can record data simultaneously in three time domains:high speed transient fault (upto 384 samples/ cycle), low speed dynamic swing (upto 30 minutes), and continuous trend (10second to 1 hour intervals). A wide variety of triggers are available to initiate recording. The recording system consists of arecorder, analog input isolation modules and a Control Panel user interface software. There are various analog inputisolation modules available to interface to signal sources. Modules are available to connect to standard signals found in atypical electric power substation including secondary ac voltage and current and low level dc voltage and current signals.These modules can generally be installed up to 300 meters from the recorder unit, allowing them to be located near thesource of the signals being monitored. The Control Panel user interface software provides tools to configure the recorder,trigger, retrieve and manage records and display real time measured values. Control Panel also includes RecordGraph, agraphical record display and analysis software tool. An optional central station program - RecordBase - is available toautomatically collect and store records from multiple recorders. RecordBase provides fast network-based access tocollected records through distributed RecordBase View desktop clients (refer Figure 1).PMU functionality is an optional software product feature on this DFR. The PMU module can be installed as a fieldupgrade. The PMU functionality will comply with IEEE C37.118 – 2005 [1]. Up to 12 user selectable phasors - asindividual phase quantities or three-phase positive, negative or zero sequence phasors or summated phasors- can betransmitted via Ethernet, Serial port, or Modem at rates up to 60 frames each second. The PMU functionality is designed towork simultaneously with the existing DFR features such as triggering, recording, and trending. This means,simultaneously you can connect to the DFR using the Control Panel software and view Metering, Modify configurationsettings, transfer records over Modem and stream PMU data over Ethernet or vice-versa.In order to reliably transmit the PMU data, it is required to connect IRIG-B signal from a reliable Global PositioningSystem (GPS) clock or receiver to a DFR through standard BNC connector. The GPS signal must comply with thespecification as mentioned in the IEEE C37.118 standard [1].AC Voltage InputModule (Va,Vb,Vc)Digital I/OStatus O/PIRIG-BAC Current InputModule (Ia,Ib,Ic,In)DC InputModule - 4 ChannelSplit core & ClamponCTsTo Phasor DataConcentrator(PDC)TESLA 3000 DFRPMUModuleLAN, Modem or SerialTESLA Control PanelWindows Software (GUI)LAN orModemRecordBase CentralStation Server withRecordBase ViewSoftware (MS Accessbackend database)FIGURE 1: SCHEMATIC VIEW <strong>OF</strong> A DFR WITH PMU MODULE2
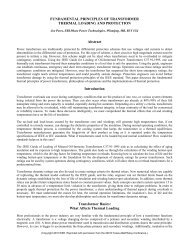
3.0 <strong>PHASOR</strong> <strong>MEASUREMENT</strong> AND REPORTING - SOURCES <strong>OF</strong> ERRORThis section explains the various sources of errors that contribute to the phasor measurement calculations and reporting(Figure 2). The input to the DFR will be from the station PTs and CTs through the input modules as shown in Figure 1.There will be an inherent error in the CTs and PTs that need to be compensated. If the PMU is under calibration or testingphase, then the testing equipment needs to be qualified as per the C37.118 to be considered as a calibration device. In thiscase, the input to DFR is from the calibration device and any sources of phase angle or magnitude correction needs to becompensated. From the primary transducers, the signal passes through anti-aliasing filter before it is sampled and this isanother source of error. The A/D converter, ADC count bit error and channel-to-channel skew can introduce magnitude orgain error and channel phase shift. Later, once the sampling is done, the signal processing will be carried out to evaluate thephasor magnitude and phase angle. There is a possibility that the signal processing may introduce some error in the phasorcalculations. Since the phase angle needs to be reported with respect to the global time reference (synchronized with UTC),the poor quality IRIG-B signal may introduce some error. The cable delays can cause some errors. Components aging andwide variation of operating temperatures can cause errors over time. The standard [1] mandates the compliance level 0 and/or level 1 for the PMU under any conditions.GPS source– IRIG -BPhasor DataConcentrator (PDC)Powersystemelement(signal to bemeasured)SubstationsensorPTs /CTs orCalibrationDevicePTs /CTsinputmoduleAnti-AliasingfilterA/DConverterPhasorEstimation –SignalProcessingReal Time Operating SystemImplementPC37.118protocolCommunicationMedia – Serial / Modem/Ethernet (LAN)FIGURE 2: <strong>PHASOR</strong> ESTIMATION AND POSSIBLE SOURCES <strong>OF</strong> ERRORS3
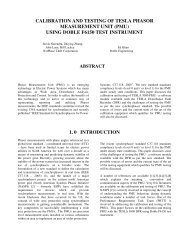
4.0 <strong>CHALLENGES</strong> <strong>OF</strong> TESING PMU AS PER C37.118 - 2005 COMPLIANCEAs explained in the previous section, there are number of possible sources of error that needs to be addressed before thephasor information is transmitted. As per the definition of the standard [1], the phase angle of the phasor (cosine reference)must be reported with respect to the global time reference (UTC) as shown in Figure 3. For example, at time t1, the UTCintersects with the zero cross-over of the A phase signal and the theoretical reporting phase angles are -90, 150 and 30degrees for A, B, and C phases respectively. At time t2, the UTC intersects at cosine reference of the A phase signal and thetheoretical reporting angles are 0, -120 and 120 for A, B and C phases respectively. Unless specified for all the test cases,Doble F6150 test set with 3 phase balanced voltages of 69 V rms and 3 phase balanced current 5A rms was used.Cosine reference(A,B,C phases)UTC referenceTime , t1Time , t2FIGURE 3: PHASE ANGLE REPORTING CONVENTION AS PER C37.118-2005The Total Vector Error (TVE) is an important criterion which must be < 1% under steady state conditions for Level 0 andLevel 1 compliance Table 3 of standard [1]. For convenience, the definition is repeated as follows (Figure 4).FIGURE 4: DEFINITION <strong>OF</strong> TVE, V TH , V OB , AND V DIF ARE <strong>THE</strong> <strong>THE</strong>ORETICAL, OBSERVED AND DIFFERENCEVECTORS4.1 IRIG-B Receiver signal variationsThe challenge was to find the right source of the IRIG-B receiver signal as an input to the DFR and the testing equipment,which synchronizes with the UTC time with a requirement as mentioned in the standard [1]. A study was conducted todetermine the variations of 1 PPS signal with 3 different manufacturers. A calibrated Tektronix digital oscilloscope(THS720A) was used for this purpose and a number of triggers were analyzed. A sample result is depicted in Figure 5.4
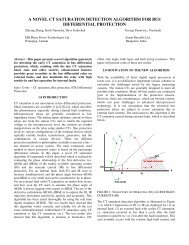
a) Doble’s 1 PPS signal with GPS Clock A 1 PPS b) Doble’s 1 PPS signal with GPS Clock B 1PPSFIGURE 5: GPS SIGNAL COMPARISON – DOBLE’s 1PPS WITH O<strong>THE</strong>R CLOCK S A, AND BThe relative comparison of the above shows that the clock B has wider difference in their reading in the range of 500nS,compared to clock A, which is 150nS. Doble’s 1 PPS signal was consistent with Clock A 1PPS signal and varied between147ns to 150nS and with respect to Clock B it varied between 490nS to 500nS. More information on GPS signal can befound in [6].4.2 Modulated vs Unmodulated IRIG-B SignalFrom the point of view of accuracy and the stringent requirements of the standard, it is recommended to use unmodulatedIRIG-B signal compared to the modulated IRIG-B signal. A test was conducted to verify the results and a significantdifference in the TVE was found between modulated and unmodulated signal. Table 1 below summarizes a sample studyresult.Nominal Signal Unmodulated – TVE % Modulated – TVE %1 69V rms A, B, C phase 0.01, 0.01, 0.011 0.86, 0.85, 0.842 5A rms A, B, C phase 0.036, 0.041,0.013 0.86, 0.91, 0.83TABLE 1: COMPARISON <strong>OF</strong> TVE FOR UNMODULATED AND MODULATED IRIG-B SIGNAL4.3 Reference signal variationsAs per the standard [1], the reference signal generated from the test set should meet the criteria of 0.25% TVE in order toqualify as a calibration or testing equipment. This is important because the reference signal from the test set will beconsidered as the theoretical signal for evaluating the TVE. Three different manufacturers test equipments were studied tocheck the accuracy of the calibration or test signal. In all the cases a number of trials were carried out to verify the accuracyof the phase angle generation with respect to the 1 PPS signal.In the case of manufacturer A, there was an inconsistency in SineWave startup (point-on-wave) time with respect to the1PPS. Also, the 60Hz nominal system frequency was varying (even though the variation was 0.0001 Hz),as a result of thisvariation the phase angle was monotonically increasing (fourth decimal place), and over a period of time this would resultin a significant error. Hence manufacturer A’s test set could not be used as a calibration device for PMU analysis. Sampleobservation of manufacturer A signal generation with respect to 1PPS signal is shown in Figure 6a.5
1)2)a) SinWave startup with respect to 1PPS – Manufacturer A b)SineWave startup with respect to 1PPS- DobleFIGURE 6: SINEWAVE GENERATION (POIN-ON-WAVE) WITH RESPECT TO 1PPSA comparison of Doble’s F6150 SinWave startup scenario for the same test conditions is shown in Figure 6b.Table 2 summarizes the ten iterations of reading obtained using Tektronix digital oscilloscope (THS720A) during theSinWave startup between the manufacture A and the Doble F6150 test set.Iteration Manufacturer – A – Startup w.r.t 1PPS(difference in micro seconds)Doble F6150 Startup w.r.t 1PPS(difference in micro seconds)1 502 362 518 343 503 344 438 345 462 34.76 502 367 444 348 467 369 479 34.710 520 34.7TABEL 2: SUMMARY <strong>OF</strong> SINEWAVE START UP WITH RESPECT TO 1PPS SIGNAL BETWEENMANUFACTURER - A AND DOBLE F6150 DEVICESIdeally, the difference between the SineWave startup instance and the 1PPS tick should be zero. As shown in Table 2, bothmanufacturers startup time with respect to 1PPS signal varied but Doble F6150’s startup showed much better consistencycompared to Manufacturer –A and also the Doble F6150 test set system frequency remained extremely stable throughoutthe testing period .4.4 Off-nominal frequency performance testAs per the standard [1] the off-nominal frequency test must be carried out depending on the level of compliance and theTVE must satisfy < 1% requirement. The challenge here was to generate a reliable off-nominal signal based on the 1PPSand keep track of the phase angle variation of signal due to the change in the frequency. The following relationship existsbetween the reporting rate of the PMU messages and the off nominal frequency variation.6
Phase Angle Rotation ( Degrees / frame) = (f - f0)*360.0 / RWhere, f = Off-nominal frequency (e.g. 61 Hz)f0 = nominal system frequency (e.g. 60 Hz)R = PMU reporting rate (e.g. 10)In the above example, the phasor rotates with the phase angle of 36 degrees per frame as shown below in Figure 7.FIGURE 7: <strong>PHASOR</strong> VARIATION UNDER <strong>OF</strong>FNOMINAL FREQUENCY 61 Hz WITH 10 FRAMES PER SECONDPMU REPORTING RATEHence, for the calculation of the TVE for a corresponding frame, proper phase angle rotation must be used. Also, the initialphase angle reporting time tag must synchronize to the beginning of the UTC time (1PPS tick). The difficulty here was togenerate a synchronized signal at off-nominal frequency. For example, with Doble F6150, this can be achieved by changingthe system frequency to 61 Hz (for the above case) or to any desired off-nominal frequency to achieve the accuratecalibration off-nominal frequency signal, and not just by changing the applied frequency of the signal to 61 Hz.4.5 Harmonic Distortion TestAs per the standard, any harmonic (up to 50 th ) at 1 or 10% of signal magnitude should not result in TVE exceeding 1 %.This test was difficult to conduct using normally available test sets since most of them support upto 20 th harmonic signalgeneration. Even though COMTRADE file can be generated to test the contents of the harmonics but it was difficult totrack the synchronized fundamental frequency variation due to the digital nature of the generation (round-off erroraccumulation etc.). For this case, signal from two different manufacturers test set was used to arrive at a meaningfulcalibration signal.4.6 Out-of-band interfering signalThe standard [1] does not specify the nature of interfering signal – what kind of interference should be considered. Forexample, additive, subtractive or multiplicative interferences are possible with the input signal. Testing for each case andwith theoretically infinite possibilities, it is impractical to generate calibration signals for all these conditions. The nature oflow frequency interference in the power systems swing happens in the range of 0.3 to 5 Hz. Therefore, a discrete number ofcalibration signals were generated to test this condition and cover the broad range of interferences.7
4.7 Communication issuesAlthough the standard [1] requires the phasor information to be transmitted in a particular protocol format, it does notimpose on the choice of communication media. The authors have done testing with TCP/IP, UDP and Serial modecommunication media. In all the cases, the Tennessee Valley Authority (TVA) free PMU connection tester program wasused as a Phasor Data Concentrator (PDC) [7]. More elaborate testing needs to be done to have better insight into PMUdata communications.5.0 CONCLUSIONSIt is beyond doubt that the PMU technology can provide useful information to mitigate wide area disturbances, protectionand real time control of power systems. In order to get meaningful phasor information from different PMU manufacturers,practical procedures to test the interoperability – especially under dynamic conditions should be established. Theexperience of testing the PMU functionality with a DFR indicates that the current state of the calibration equipments is notuser friendly to conduct the compliance tests as mandated by the PMU standard [1]. With the ever increasingcommunication security implementations, it is even more challenging to cooperate and share the phasor information amongdifferent utilities. This technology can be best utilized with the wider participation from utilities, manufacturing industriesand academic institutions. It is encouraging that several organizations (e.g. PSRC, NASPI – formerly EIPP) and utilitieshave already taken steps towards serious implementation of this technology in North America.8
6.0 REFERENCES[1] “IEEE Standard for Synchrophasors for Power Systems”, IEEE C37.118 – 2005.[2] North American SynchroPhasor Initiative (NASPI) [Formerly, Eastern Interconnection Phasor Project (EIPP)]Performance Requirements Task Team (PRTT) - http://phasors.pnl.gov[3] “Synchrophasors : Definition, Measurement, and Application”, Mark Adamiak, William Premerlani and BogdanKasztenny, GE Multilin Publications, pp 1-13.[4] “A New Measurement Technique for Tracking Voltage Phasor, Local System Frequency, and Rate of Change ofFrequency”, A. Phadke, J. Thorp, M. Adamiak; IEEE Trans. vol. PAS-102 no. 5, May 1983, pp 1025-1038.[5] “Real Time Voltage Phasor Measurements for Static State Estimation”, A.G. Phadke, J.S. Thorp and K.J. Karimi,IEEE Transactions on PAS, Vol. 104, No. 11, November 1985, pp.3098-3107.[6] “The Perfect Time: An Examination of Time Synchronization Techniques”, Ken Behrendt and Ken Fodero,Publication, Schweitzer Engineering Laboratories, Inc., pp 1-18.[7] “Tennessee Valley Authority (TVA) free PMU connection tester program”, http://phasors.pnl.gov underResources/Tools9
7.0 ACKNOWLEDGEMENTSThe authors would like to thank Bill Lackey (General Manager, R&R Division) and Michael Miller (Director- ProductDevelopment) of NxtPhase T&D Corporation for their support and encouragements. Thanks are also due to Dale Hoppsand Joe Bernard of NxtPhase T&D Corporation for meticulously carrying out various test cases. The first three authors areindebted to Doble Engineering Company Management for lending Doble F6150 and for their excellent customer support.8.0 AUTHORS BIOGRAPHYKRISH NARENDRA – obtained his B.E. (Electrical Engineering) in 1986 from University Visweswaraiah College ofEngineering (UVCE), and Msc (E.E) , Ph.D. (E.E) with a specialisation in High Voltage Engineering from Indian Instituteof Science, India in 1989 and 1993 respectively. He joined Electrical and Computer Engineering Department of ConcordiaUniversity, Montreal as a Research Scholar in 1995. From 1996 - 2000 he was with APT Power Technologies as a seniorsoftware developer. In 2000 he joined NxtPhase T&D Corporation and since 2006 he is the Software DevelopmentManager of Relay and Recorder division. He has about 15 years of software development expertise and about 16publications to his credit. He is actively participating in the PRSC working groups and a member of the PRTT of NASPI.His areas of interests include Power Systems Disturbance Analysis, Protection, HVDC Controls, Neural Networks, Fuzzylogic, Phasor Technology (PMUs). He can be contacted at Knarendra@nxtphase.com.ZHIYING ZHANG - received his B.Sc. and M.Sc. degrees in Electrical Engineering from the North China Electric PowerUniversity (NCEPU), China, in 1982 and in 1985 respectively. He received his Ph.D. degree in Electrical Engineeringfrom the University of Manitoba, Canada, in 1994. From 1993 to 2000, he worked for APT Power Technologies as asenior relay design engineer, and since 2000, he has been working for NxtPhase Corp. as a senior product developmentengineer. He is a registered professional engineer in the province of Manitoba. His areas of interest include power systemprotection, control and monitoring.JOHN LANE - PE is Manager of Technical Applications and Services for NxtPhase T&D Corporation. He received hisBSEE from Oklahoma State University in 1986 with in emphasis is power systems. He has worked for various companiesincluding General Electric, San Diego Gas & Electric, and Lower Colorado River Authority in various capacities includingfield engineer, and power systems protection.ED KHAN - has 27 years of experience in power system engineering. He has worked at GE for 12 years in theirSchenectady, NY office as a Consulting Engineer performing various types of system studies for the utility and industrialcustomers including protection and harmonics. He has taught the protective relaying course offered by GE to severalutilities in the US and Mexico. He has also worked in the GE Power Plant Design group as a project engineer and electricalproject manager on key power plant projects.JIM WOOD – has over 40 years of experience in power system protection engineering. He has served Manitoba Hydro forover 30 years as Technologist and as a Customer Technical Support representative at NxtPhase for over 6 years. Herecently joined Doble Engineering Company as Sr. Protection Application Engineer. His areas of interest are Power SystemProtection, Monitoring and Metering.10