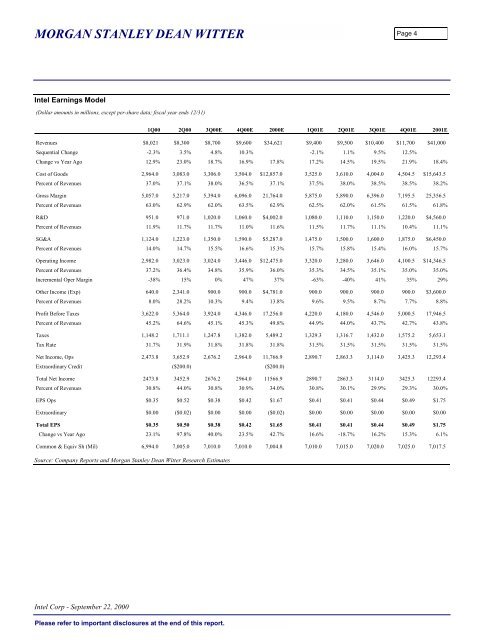
MORGAN STANLEY DEAN WITTERPage 4Intel <strong>Earnings</strong> Model(Dollar amounts in millions, except per-share data; fiscal year ends 12/31)1Q00 2Q00 3Q00E 4Q00E 2000E 1Q01E 2Q01E 3Q01E 4Q01E 2001ERevenues $8,021 $8,300 $8,700 $9,600 $34,621 $9,400 $9,500 $10,400 $11,700 $41,000Sequential Change -2.3% 3.5% 4.8% 10.3% -2.1% 1.1% 9.5% 12.5%Change vs Year Ago 12.9% 23.0% 18.7% 16.9% 17.8% 17.2% 14.5% 19.5% 21.9% 18.4%Cost of Goods 2,964.0 3,083.0 3,306.0 3,504.0 $12,857.0 3,525.0 3,610.0 4,004.0 4,504.5 $15,643.5Percent of Revenues 37.0% 37.1% 38.0% 36.5% 37.1% 37.5% 38.0% 38.5% 38.5% 38.2%Gross Margin 5,057.0 5,217.0 5,394.0 6,096.0 21,764.0 5,875.0 5,890.0 6,396.0 7,195.5 25,356.5Percent of Revenues 63.0% 62.9% 62.0% 63.5% 62.9% 62.5% 62.0% 61.5% 61.5% 61.8%R&D 951.0 971.0 1,020.0 1,060.0 $4,002.0 1,080.0 1,110.0 1,150.0 1,220.0 $4,560.0Percent of Revenues 11.9% 11.7% 11.7% 11.0% 11.6% 11.5% 11.7% 11.1% 10.4% 11.1%SG&A 1,124.0 1,223.0 1,350.0 1,590.0 $5,287.0 1,475.0 1,500.0 1,600.0 1,875.0 $6,450.0Percent of Revenues 14.0% 14.7% 15.5% 16.6% 15.3% 15.7% 15.8% 15.4% 16.0% 15.7%Operating Income 2,982.0 3,023.0 3,024.0 3,446.0 $12,475.0 3,320.0 3,280.0 3,646.0 4,100.5 $14,346.5Percent of Revenues 37.2% 36.4% 34.8% 35.9% 36.0% 35.3% 34.5% 35.1% 35.0% 35.0%Incremental Oper Margin -38% 15% 0% 47% 37% -63% -40% 41% 35% 29%Other Income (Exp) 640.0 2,341.0 900.0 900.0 $4,781.0 900.0 900.0 900.0 900.0 $3,600.0Percent of Revenues 8.0% 28.2% 10.3% 9.4% 13.8% 9.6% 9.5% 8.7% 7.7% 8.8%Profit Before Taxes 3,622.0 5,364.0 3,924.0 4,346.0 17,256.0 4,220.0 4,180.0 4,546.0 5,000.5 17,946.5Percent of Revenues 45.2% 64.6% 45.1% 45.3% 49.8% 44.9% 44.0% 43.7% 42.7% 43.8%Taxes 1,148.2 1,711.1 1,247.8 1,382.0 5,489.2 1,329.3 1,316.7 1,432.0 1,575.2 5,653.1Tax Rate 31.7% 31.9% 31.8% 31.8% 31.8% 31.5% 31.5% 31.5% 31.5% 31.5%Net Income, Ops 2,473.8 3,652.9 2,676.2 2,964.0 11,766.9 2,890.7 2,863.3 3,114.0 3,425.3 12,293.4Extraordinary Credit ($200.0) ($200.0)Total Net Income 2473.8 3452.9 2676.2 2964.0 11566.9 2890.7 2863.3 3114.0 3425.3 12293.4Percent of Revenues 30.8% 44.0% 30.8% 30.9% 34.0% 30.8% 30.1% 29.9% 29.3% 30.0%EPS Ops $0.35 $0.52 $0.38 $0.42 $1.67 $0.41 $0.41 $0.44 $0.49 $1.75Extraordinary $0.00 ($0.02) $0.00 $0.00 ($0.02) $0.00 $0.00 $0.00 $0.00 $0.00Total EPS $0.35 $0.50 $0.38 $0.42 $1.65 $0.41 $0.41 $0.44 $0.49 $1.75Change vs Year Ago 23.1% 97.8% 40.0% 23.5% 42.7% 16.6% -18.7% 16.2% 15.3% 6.1%Common & Equiv Sh (Mil) 6,994.0 7,005.0 7,010.0 7,010.0 7,004.8 7,010.0 7,015.0 7,020.0 7,025.0 7,017.5Source: Company Reports and Morgan Stanley Dean Witter Research EstimatesIntel Corp - September 22, 2000Please refer to important disclosures at the end of this report.
MORGAN STANLEY DEAN WITTERPage 5The information and opinions in this report were prepared by Morgan Stanley & Co. Incorporated (“Morgan Stanley Dean Witter”). Morgan Stanley DeanWitter does not undertake to advise you of changes in its opinion or information. Morgan Stanley Dean Witter and others associated with it may make marketsor specialize in, have positions in and effect transactions in securities of companies mentioned and may also perform or seek to perform investment bankingservices for those companies. This memorandum is based on information available to the public. No representation is made that it is accurate or complete.This memorandum is not an offer to buy or sell or a solicitation of an offer to buy or sell the securities mentioned.Morgan Stanley & Co. Incorporated, Dean Witter Reynolds Inc. and/or their affiliates make a market in the securities of Intel Corp.Morgan Stanley & Co. Incorporated, Dean Witter Reynolds Inc. and/or their affiliates or their employees have or may have a long or short position or holdingin the securities, options on securities, or other related investments of issuers mentioned herein.The investments discussed or recommended in this report may not be suitable for all investors. Investors must make their own investment decisions based ontheir specific investment objectives and financial position and using such independent advisors as they believe necessary. Where an investment is denominatedin a currency other than the investor’s currency, changes in rates of exchange may have an adverse effect on the value, price of, or income derived from theinvestment. Past performance is not necessarily a guide to future performance. Income from investments may fluctuate. The price or value of the investmentsto which this report relates, either directly or indirectly, may fall or rise against the interest of investors.To our readers in the United Kingdom: This publication has been issued by Morgan Stanley Dean Witter and approved by Morgan Stanley & Co. InternationalLimited, regulated by the Securities and Futures Authority Limited. Morgan Stanley & Co. International Limited and/or its affiliates may be providing or mayhave provided significant advice or investment services, including investment banking services, for any company mentioned in this report. Private investorsshould obtain the advice of their Morgan Stanley & Co. International Limited representative about the investments concerned.This publication is disseminated in Japan by Morgan Stanley Dean Witter Japan Limited and in Singapore by Morgan Stanley Dean Witter Asia (Singapore)Pte.To our readers in the United States: While Morgan Stanley Dean Witter has prepared this report, Morgan Stanley & Co. Incorporated and Dean WitterReynolds Inc. are distributing the report in the US and accept responsibility for it contents. Any person receiving this report and wishing to effect transactionsin any security discussed herein should do so only with a representative of Morgan Stanley & Co. Incorporated or Dean Witter Reynolds Inc.To our readers in Spain: AB Asesores Morgan Stanley Dean Witter, SV, SA, a Morgan Stanley Dean Witter group company, supervised by the SpanishSecurities Markets Commission (CNMV), hereby states that this document has been written and distributed in accordance with the rules of conduct applicableto financial research as established under Spanish regulations.To our readers in Australia: This publication has been issued by Morgan Stanley Dean Witter but is being distributed in Australia by Morgan Stanley DeanWitter Australia Limited A.C.N. 003 734 576, a licensed dealer, which accepts responsibility for its contents. Any person receiving this report and wishing toeffect transactions in any security discussed in it may wish to do so with an authorized representative of Morgan Stanley Dean Witter Australia Limited.To our readers in Canada: This publication has been prepared by Morgan Stanley Dean Witter and is being made available in certain provinces of Canada byMorgan Stanley Canada Limited. Morgan Stanley Canada Limited has approved of, and has agreed to take responsibility for, the contents of this information inCanada.Additional information on recommended securities is available on request.© Copyright 2000 Morgan Stanley Dean Witter & Co.Intel Corp - September 22, 2000Please refer to important disclosures at the end of this report.