Intel's Earnings Torpedo
Intel's Earnings Torpedo
Intel's Earnings Torpedo
Create successful ePaper yourself
Turn your PDF publications into a flip-book with our unique Google optimized e-Paper software.
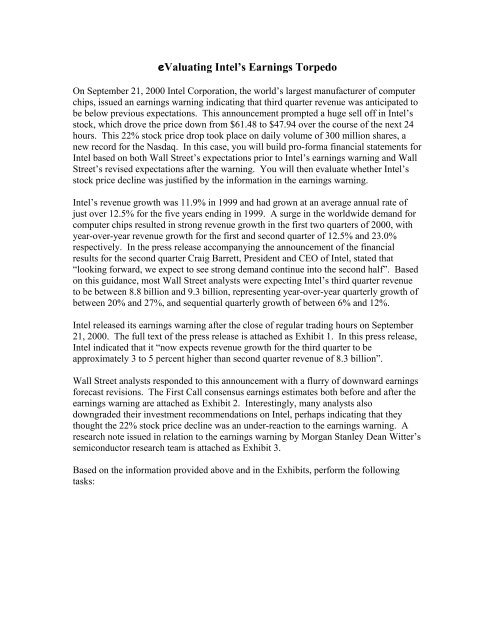
eValuating Intel’s <strong>Earnings</strong> <strong>Torpedo</strong>On September 21, 2000 Intel Corporation, the world’s largest manufacturer of computerchips, issued an earnings warning indicating that third quarter revenue was anticipated tobe below previous expectations. This announcement prompted a huge sell off in Intel’sstock, which drove the price down from $61.48 to $47.94 over the course of the next 24hours. This 22% stock price drop took place on daily volume of 300 million shares, anew record for the Nasdaq. In this case, you will build pro-forma financial statements forIntel based on both Wall Street’s expectations prior to Intel’s earnings warning and WallStreet’s revised expectations after the warning. You will then evaluate whether Intel’sstock price decline was justified by the information in the earnings warning.Intel’s revenue growth was 11.9% in 1999 and had grown at an average annual rate ofjust over 12.5% for the five years ending in 1999. A surge in the worldwide demand forcomputer chips resulted in strong revenue growth in the first two quarters of 2000, withyear-over-year revenue growth for the first and second quarter of 12.5% and 23.0%respectively. In the press release accompanying the announcement of the financialresults for the second quarter Craig Barrett, President and CEO of Intel, stated that“looking forward, we expect to see strong demand continue into the second half”. Basedon this guidance, most Wall Street analysts were expecting Intel’s third quarter revenueto be between 8.8 billion and 9.3 billion, representing year-over-year quarterly growth ofbetween 20% and 27%, and sequential quarterly growth of between 6% and 12%.Intel released its earnings warning after the close of regular trading hours on September21, 2000. The full text of the press release is attached as Exhibit 1. In this press release,Intel indicated that it “now expects revenue growth for the third quarter to beapproximately 3 to 5 percent higher than second quarter revenue of 8.3 billion”.Wall Street analysts responded to this announcement with a flurry of downward earningsforecast revisions. The First Call consensus earnings estimates both before and after theearnings warning are attached as Exhibit 2. Interestingly, many analysts alsodowngraded their investment recommendations on Intel, perhaps indicating that theythought the 22% stock price decline was an under-reaction to the earnings warning. Aresearch note issued in relation to the earnings warning by Morgan Stanley Dean Witter’ssemiconductor research team is attached as Exhibit 3.Based on the information provided above and in the Exhibits, perform the followingtasks:
Tasks:1. Load Intel’s financial statements for the five years ending fiscal 1999 into eVal.Remember that for the purpose of this case, you should set the valuation date toSeptember 22, 2000 and you should adjust the number of shares outstanding forIntel’s 2 for 1 stock split of July 31, 2000. Both of these adjustments should be madeon the ‘Valuation Parameters’ worksheet.2. For the purpose of answering this question, limit yourself to adjusting only the salesgrowth forecasting assumptions and the length of the forecast horizon in eVal’s‘Forecasting Assumptions’ worksheet. Based on Wall Street’s expectationsimmediately before Intel’s earnings warning, provide the most reasonable set of salesgrowth forecasts that justify Intel’s $61.48 pre-warning stock price.3. Compare the annual EPS forecasts implied by your forecasting assumptions inquestion 2 above with the First Call consensus EPS forecasts in Exhibit 2. Note thatyour EPS forecasts are available in eVal’s ‘EPS Forecaster’ worksheet. Try toidentify the source(s) of any major differences. Now change the forecasts in eVal toget the EPS forecast equal to the First Call forecast AND the price equal to the $61.48pre-warning stock price. Do these forecasts seem reasonable?4. For the purpose of answering this question, again limit yourself to adjusting only thesales growth forecasting assumptions and the length of the forecast horizon in eVal’s‘Forecasting Assumptions’ worksheet. Based on Wall Street’s expectationsimmediately after Intel’s earnings warning, provide the most reasonable set of salesgrowth forecasts that justify Intel’s $47.94 post-warning stock price.5. Compare the annual EPS forecasts implied by your forecasting assumptions inquestion 4 above with the Morgan Stanley Dean Witter report given in the case.Change the forecasts to in eVal to replicate the estimates in this report AND yield astock price estimate of Intel’s $47.94 post-warning stock price. Do these forecastsseem reasonable?6. Based on your analysis in questions 1 through 5, evaluate whether the 22% stockprice drop was a reasonable response to the news about valuation fundamentals inIntel’s earnings warning. To the extent that you do not think the stock price drop wasjustified, speculate as to why it occurred.
Exhibit 1Intel Third Quarter Revenue To Be Below ExpectationsDemand in Europe weaker than expectedSANTA CLARA, Calif., Sept. 21, 2000 -- <strong>Intel's</strong> third quarter revenue is anticipated to be belowthe company's previous expectations, primarily due to weaker demand in Europe, the companysaid today. The company now expects revenue for the third quarter to be approximately 3 to 5percent higher than second quarter revenue of $8.3 billion.The company expects gross margin percentage for the third quarter to be 62 percent, plus orminus a point, lower than the company's previous expectations of approximately 63 to 64 percent.Interest and other is expected to be approximately $900 million for the third quarter, up from thecompany's previous expectations of $800 million.BUSINESS OUTLOOKThe following statements are based on current expectations. These statements are forwardlooking,and actual results may differ materially. These statements do not reflect the potentialimpact of any mergers or acquisitions that may be completed after the date of this release.** The company expects revenue for the third quarter of 2000 to be approximately 3 to 5 percenthigher than second quarter revenue of $8.3 billion.** The company expects gross margin percentage for the third quarter to be 62 percent, plus orminus a point. Gross margin percentage for 2000 is expected to be 63 percent, plus or minus afew points. In the short term, <strong>Intel's</strong> gross margin percentage varies primarily with revenue levelsand product mix as well as changes in unit costs.** Expenses (R&D, excluding in-process R&D, plus MG&A) in the third quarter of 2000 areexpected to be up 7 to 9 percent from second quarter expenses of $2.2 billion, primarily due tohigher spending on marketing programs and R&D initiatives in new business areas. Expensesare dependent in part on the level of revenue.** R&D spending, excluding in-process R&D, is expected to be approximately $4.0 billion for2000.** The company expects interest and other income for the third quarter of 2000 to beapproximately $900 million. Interest and other is dependent in part on interest rates, cashbalances, equity market levels and volatility, the realization of expected gains on investments,including gains on investments acquired by third parties, and assuming no unanticipated items.** The tax rate for 2000 is expected to be approximately 31.8 percent, excluding the impact of thepreviously announced agreement with the Internal Revenue Service and acquisition-relatedcosts.** Capital spending for 2000 is expected to be approximately $6.0 billion.** Depreciation is expected to be approximately $790 million in the third quarter and $3.4 billionfor the full year 2000.** Amortization of goodwill and other acquisition-related intangibles is expected to beapproximately $400 million in the third quarter and $1.5 billion for the full year 2000.Copies of this earnings release and <strong>Intel's</strong> annual report can be obtained via the Internet athttp://www.intc.com/ or by calling <strong>Intel's</strong> transfer agent, Computershare Investor Services, L.L.C.(formerly named Harris Trust and Savings Bank), at (800) 298-0146.Intel, the world's largest chip maker, is also a leading manufacturer of computer, networking andcommunications products.The above statements contained in this outlook are forward-looking statements that involve a number of risks and uncertainties. Inaddition to factors discussed above, among other factors that could cause actual results to differ materially are the following:business and economic conditions and growth in the computing industry in various geographic regions; changes in customer orderpatterns; changes in the mixes of microprocessor types and speeds, purchased components and other products; competitivefactors, such as rival chip architectures and manufacturing technologies, competing software-compatible microprocessors andacceptance of new products in specific market segments; pricing pressures; development and timing of introduction of compellingsoftware applications; insufficient, excess or obsolete inventory and variations in inventory valuation; continued success intechnological advances, including development and implementation of new processes and strategic products for specific marketsegments; execution of the manufacturing ramp, including the transition to the 0.18-micron process technology; shortage ofmanufacturing capacity; the ability to grow new networking, communications, wireless and other Internet-related businesses andsuccessfully integrate and operate any acquired businesses; unanticipated costs or other adverse effects associated withprocessors and other products containing errata (deviations from published specifications); litigation involving antitrust, intellectualproperty, consumer and other issues; and other risk factors listed from time to time in the company's SEC reports, including butnot limited to the report on Form 10-Q for the quarter ended July 1, 2000 (Part I, Item 2, Outlook section).
Exhibit 2First Call Consensus <strong>Earnings</strong> Forecasts for Intel Before and After the <strong>Earnings</strong>WarningForecast Period Before AfterThird Quarter of 2000 $0.41 $0.38Fourth Quarter of 2000 $0.46 $0.43Fiscal 2000 $1.72 $1.67Fiscal 2001 $1.86 $1.77Long-Run Growth Rate 22.6% 20.6%
MORGAN STANLEY DEAN WITTERCommentPage 1Equity ResearchNorth AmericaUnited States of AmericaTechnology: SemiconductorsIntel CorpReuters: INTC.O Bloomberg: INTC NASDAQ: INTCMark L. Edelstone+1 (1)415 576 2381Mark.Edelstone@msdw.comJohn CrossLouis P. GerhardySonia KimotsukiChange in RecommendationDowngrading INTC ToOutperformSeptember 22, 2000OUTPERFORMPrice (September 21, 2000): $61.48Price Target: $6052-Week Range: $75.81 - 32.50WHAT'S CHANGEDRating: Strong Buy to OutperformChange of Target Price: $100 to $60<strong>Earnings</strong> (2000): $1.75 to $1.65<strong>Earnings</strong> (2001): $1.95 to $1.75• Lowering EPS estimates and rating on INTCTo reflect a 3Q shortfall and our belief that 2001 will be a morechallenging year we cut our estimates and rating on INTC• Weakness in Europe leads to shortfallEurope was well below plan but other regions were solid and webelieve that seasonal demand is improving• Inability to capitalize on near-term EPS potentialWe expected a seasonal uptick in 2H PC demand to combinewith lower cost structure to drive strong 3Q and 4Q results• Transition issues make 2001 more challengingPentium 4 transition and completion of cost reduction programsin 4Q suggest that 2001 EPS results will be less compellingPrice: Abs. and Rel. To Market & IndustryIntel Corporation (Left, U.S. Dollar)Relative to S&P 500 Stock Index (Right)Relative to MSCI O/ELECTRONIC COMPONENTS;INSTRUMENTS (Right)70350603005025040200301502010010500096 97 98 99 00Data Source: FactSet Research Systems Inc.FY ending Dec 31: 1999A 2000E 2001E 2002EEPS ($) 1.16 1.65 1.75 –Prior EPS Ests. ($) – 1.75 1.95 –P/E 53.1 37.3 35.1 –Price/Book 13.2 9.7 7.6 –Market Cap ($ m) 430,667Return on Equity (06/00) (%) 27.7L-T EPS Grth ('00 - '05) (%) 20.0P/E to Growth 1.76Shares Outstanding (m) 7,005.0E = Morgan Stanley Dean Witter Research EstimateQ'trly 1999A 2000E 2001EEPS actual curr prior curr priorQ1 0.29 0.35A – 0.41 0.46Q2 0.25 0.50A – 0.41 0.46Q3 0.27 0.38E 0.42E 0.44 0.50Q4 0.34 0.42E 0.48E 0.49 0.53Company DescriptionIntel designs, manufactures, and markets highperformancemicroprocessor units (MPUs) andrelated chips for the PC market.Please refer to important disclosures at the end of this report.
MORGAN STANLEY DEAN WITTERPage 2Downgrading INTC To OutperformSummary and Investment ConclusionAfter the market closed on September 21, Intelpreannounced a negative earnings surprise, as sales inEurope failed to meet expectations. As a result, we havelowered our earnings estimates, and since we believe that2001 earnings results will be less compelling, we havelowered our rating on INTC to Outperform from StrongBuy. Our 2000 earnings estimate has been reduced to $1.65per share from $1.75, while our 2001 earnings-per-shareestimate has been lowered to $1.75 from $1.95. Prior to thepreannouncement, consensus estimates for 2000 and 2001were $1.72 and $1.86, respectively. Based on the reductionin our margin and earnings expectations for 2001, we havereduced our target in INTC to $60 from $100.Weakness in Europe led to a Revenue Shortfall that is5% Lower than our EstimateWhile we knew that sluggish demand in Europe and overallseasonal weakness in global PC demand was causing theresults of PC-centric companies to be back-end loaded, webelieved that low channel inventories and a normal seasonaluptick in PC build rates would enable Intel to meet ourthird-quarter unit and revenue expectations. However, Intelpreannounced that third-quarter revenues would only grow3%-5% sequentially, versus our estimate of 10% growth.While we continue to believe that PC demand and buildrates have started to enjoy a seasonal improvement, webelieve that it materialized too late in the quarter for Intel toachieve our expectations. We believe that the revenueshortfall represents about 2 million units, and we hadpreviously expected Intel to increase its unit shipments to36 million from just over 32 million in the second quarter.Based on Intel’s preannouncement, we believe that Europewas solely responsible for the lower-than-expectedrevenues. In the second quarter, Europe accounted for 22%of Intel’s revenues, and summer holidays causes the regionto be significantly back-end loaded. While we do not haveall the answers yet, we suspect that economic concernsstemming from higher oil prices and weakness in the europrobably caused the seasonal snapback in demand thatnormally occurs in September to fall short of expectations.In contrast, we believe that the U.S. and Asian regionsshowed solid growth and were in line with expectations.Although we continue to believe that low microprocessorinventories throughout the PC supply chain and a seasonalIntel Corp - September 22, 2000uptick in demand will lead to strong sequential unit andrevenue growth in the fourth quarter, near-term visibility inEurope is low, and it will still need to improve to meet ourrevised expectations.Intel has had few Negative Preannouncements andGuidance is Usually ConservativeIntel has only preannounced six quarters since 1990, andtwo of them were negative preannouncements. The twonegative preannouncements occurred in the second quarterof 1997 and the first quarter of 1998, and Intel’s actualresults ended up being 13% and 10% below consensusestimates, respectively, in those quarters. In each case,Intel’s actual results met or exceeded the upper end of itspreannounced guidance, and we believe that the company’scurrent guidance for the third quarter is conservative onceagain.Intel’s Revised Expectations are still Within NormalHistorical Parameters for 3Q Growth...While the third-quarter results are clearly a disappointment,they will still end up being on par with what has historicallybeen viewed as a normal third quarter. Although theinability for Europe to show a meaningful recovery inseasonal demand thus far in September combine withconcerns surrounding the euro and oil prices, our mostrecent PC supply chain data points suggest that Intel’s ordermomentum and visibility should improve by the time thecompany reports its actual results on October 17.We believe it is inappropriate and too early to conclude thatIntel’s two million-unit shortfall will have any meaningfulimpact on intermediate-term PC demand or the overallsemiconductor cycle. However, it does help to confirm ourview that the semiconductor industry is in the second phaseof the cycle, which implies a deceleration in year-over-yearrevenue growth, an increase in the number of negativeearnings surprises, and a more difficult environment forinvestors....But when they are Combined with Transition Issues in2001 we Believe INTC Becomes less CompellingAlthough our expectations for a near-term improvement inPC demand would argue against downgrading our rating onINTC, we have believed for quite some time that Intel’smargins and earnings growth rate would slow next year.However, we believed that a seasonal increase in PCPlease refer to important disclosures at the end of this report.
MORGAN STANLEY DEAN WITTERPage 3demand and sharp uptick in margins caused by entering theeconomic sweet spot of the transition to 0.18-micronproduction and flip-chip packaging would enable INTC toadvance through the end of this year.Unfortunately, the inability to maximize revenue growthwill pressure near-term earning power, and transition issuesare still expected to adversely impact Intel’s 2001 results.Specifically, we believe that the transition to Pentium 4 andthe inability to further improve its manufacturing resultsuntil 0.13-micron production is in high volume will lead tomargin pressure and less robust EPS growth next year.Consequently, when this outlook is combined with thecompany’s projected near-term results, we believe that aStrong Buy rating is no longer appropriate.Intel Corp - September 22, 2000Please refer to important disclosures at the end of this report.
MORGAN STANLEY DEAN WITTERPage 4Intel <strong>Earnings</strong> Model(Dollar amounts in millions, except per-share data; fiscal year ends 12/31)1Q00 2Q00 3Q00E 4Q00E 2000E 1Q01E 2Q01E 3Q01E 4Q01E 2001ERevenues $8,021 $8,300 $8,700 $9,600 $34,621 $9,400 $9,500 $10,400 $11,700 $41,000Sequential Change -2.3% 3.5% 4.8% 10.3% -2.1% 1.1% 9.5% 12.5%Change vs Year Ago 12.9% 23.0% 18.7% 16.9% 17.8% 17.2% 14.5% 19.5% 21.9% 18.4%Cost of Goods 2,964.0 3,083.0 3,306.0 3,504.0 $12,857.0 3,525.0 3,610.0 4,004.0 4,504.5 $15,643.5Percent of Revenues 37.0% 37.1% 38.0% 36.5% 37.1% 37.5% 38.0% 38.5% 38.5% 38.2%Gross Margin 5,057.0 5,217.0 5,394.0 6,096.0 21,764.0 5,875.0 5,890.0 6,396.0 7,195.5 25,356.5Percent of Revenues 63.0% 62.9% 62.0% 63.5% 62.9% 62.5% 62.0% 61.5% 61.5% 61.8%R&D 951.0 971.0 1,020.0 1,060.0 $4,002.0 1,080.0 1,110.0 1,150.0 1,220.0 $4,560.0Percent of Revenues 11.9% 11.7% 11.7% 11.0% 11.6% 11.5% 11.7% 11.1% 10.4% 11.1%SG&A 1,124.0 1,223.0 1,350.0 1,590.0 $5,287.0 1,475.0 1,500.0 1,600.0 1,875.0 $6,450.0Percent of Revenues 14.0% 14.7% 15.5% 16.6% 15.3% 15.7% 15.8% 15.4% 16.0% 15.7%Operating Income 2,982.0 3,023.0 3,024.0 3,446.0 $12,475.0 3,320.0 3,280.0 3,646.0 4,100.5 $14,346.5Percent of Revenues 37.2% 36.4% 34.8% 35.9% 36.0% 35.3% 34.5% 35.1% 35.0% 35.0%Incremental Oper Margin -38% 15% 0% 47% 37% -63% -40% 41% 35% 29%Other Income (Exp) 640.0 2,341.0 900.0 900.0 $4,781.0 900.0 900.0 900.0 900.0 $3,600.0Percent of Revenues 8.0% 28.2% 10.3% 9.4% 13.8% 9.6% 9.5% 8.7% 7.7% 8.8%Profit Before Taxes 3,622.0 5,364.0 3,924.0 4,346.0 17,256.0 4,220.0 4,180.0 4,546.0 5,000.5 17,946.5Percent of Revenues 45.2% 64.6% 45.1% 45.3% 49.8% 44.9% 44.0% 43.7% 42.7% 43.8%Taxes 1,148.2 1,711.1 1,247.8 1,382.0 5,489.2 1,329.3 1,316.7 1,432.0 1,575.2 5,653.1Tax Rate 31.7% 31.9% 31.8% 31.8% 31.8% 31.5% 31.5% 31.5% 31.5% 31.5%Net Income, Ops 2,473.8 3,652.9 2,676.2 2,964.0 11,766.9 2,890.7 2,863.3 3,114.0 3,425.3 12,293.4Extraordinary Credit ($200.0) ($200.0)Total Net Income 2473.8 3452.9 2676.2 2964.0 11566.9 2890.7 2863.3 3114.0 3425.3 12293.4Percent of Revenues 30.8% 44.0% 30.8% 30.9% 34.0% 30.8% 30.1% 29.9% 29.3% 30.0%EPS Ops $0.35 $0.52 $0.38 $0.42 $1.67 $0.41 $0.41 $0.44 $0.49 $1.75Extraordinary $0.00 ($0.02) $0.00 $0.00 ($0.02) $0.00 $0.00 $0.00 $0.00 $0.00Total EPS $0.35 $0.50 $0.38 $0.42 $1.65 $0.41 $0.41 $0.44 $0.49 $1.75Change vs Year Ago 23.1% 97.8% 40.0% 23.5% 42.7% 16.6% -18.7% 16.2% 15.3% 6.1%Common & Equiv Sh (Mil) 6,994.0 7,005.0 7,010.0 7,010.0 7,004.8 7,010.0 7,015.0 7,020.0 7,025.0 7,017.5Source: Company Reports and Morgan Stanley Dean Witter Research EstimatesIntel Corp - September 22, 2000Please refer to important disclosures at the end of this report.
MORGAN STANLEY DEAN WITTERPage 5The information and opinions in this report were prepared by Morgan Stanley & Co. Incorporated (“Morgan Stanley Dean Witter”). Morgan Stanley DeanWitter does not undertake to advise you of changes in its opinion or information. Morgan Stanley Dean Witter and others associated with it may make marketsor specialize in, have positions in and effect transactions in securities of companies mentioned and may also perform or seek to perform investment bankingservices for those companies. This memorandum is based on information available to the public. No representation is made that it is accurate or complete.This memorandum is not an offer to buy or sell or a solicitation of an offer to buy or sell the securities mentioned.Morgan Stanley & Co. Incorporated, Dean Witter Reynolds Inc. and/or their affiliates make a market in the securities of Intel Corp.Morgan Stanley & Co. Incorporated, Dean Witter Reynolds Inc. and/or their affiliates or their employees have or may have a long or short position or holdingin the securities, options on securities, or other related investments of issuers mentioned herein.The investments discussed or recommended in this report may not be suitable for all investors. Investors must make their own investment decisions based ontheir specific investment objectives and financial position and using such independent advisors as they believe necessary. Where an investment is denominatedin a currency other than the investor’s currency, changes in rates of exchange may have an adverse effect on the value, price of, or income derived from theinvestment. Past performance is not necessarily a guide to future performance. Income from investments may fluctuate. The price or value of the investmentsto which this report relates, either directly or indirectly, may fall or rise against the interest of investors.To our readers in the United Kingdom: This publication has been issued by Morgan Stanley Dean Witter and approved by Morgan Stanley & Co. InternationalLimited, regulated by the Securities and Futures Authority Limited. Morgan Stanley & Co. International Limited and/or its affiliates may be providing or mayhave provided significant advice or investment services, including investment banking services, for any company mentioned in this report. Private investorsshould obtain the advice of their Morgan Stanley & Co. International Limited representative about the investments concerned.This publication is disseminated in Japan by Morgan Stanley Dean Witter Japan Limited and in Singapore by Morgan Stanley Dean Witter Asia (Singapore)Pte.To our readers in the United States: While Morgan Stanley Dean Witter has prepared this report, Morgan Stanley & Co. Incorporated and Dean WitterReynolds Inc. are distributing the report in the US and accept responsibility for it contents. Any person receiving this report and wishing to effect transactionsin any security discussed herein should do so only with a representative of Morgan Stanley & Co. Incorporated or Dean Witter Reynolds Inc.To our readers in Spain: AB Asesores Morgan Stanley Dean Witter, SV, SA, a Morgan Stanley Dean Witter group company, supervised by the SpanishSecurities Markets Commission (CNMV), hereby states that this document has been written and distributed in accordance with the rules of conduct applicableto financial research as established under Spanish regulations.To our readers in Australia: This publication has been issued by Morgan Stanley Dean Witter but is being distributed in Australia by Morgan Stanley DeanWitter Australia Limited A.C.N. 003 734 576, a licensed dealer, which accepts responsibility for its contents. Any person receiving this report and wishing toeffect transactions in any security discussed in it may wish to do so with an authorized representative of Morgan Stanley Dean Witter Australia Limited.To our readers in Canada: This publication has been prepared by Morgan Stanley Dean Witter and is being made available in certain provinces of Canada byMorgan Stanley Canada Limited. Morgan Stanley Canada Limited has approved of, and has agreed to take responsibility for, the contents of this information inCanada.Additional information on recommended securities is available on request.© Copyright 2000 Morgan Stanley Dean Witter & Co.Intel Corp - September 22, 2000Please refer to important disclosures at the end of this report.


