Individual Assignment # 2 - Bivariate Correlation (rxy)
Individual Assignment # 2 - Bivariate Correlation (rxy)
Individual Assignment # 2 - Bivariate Correlation (rxy)

You also want an ePaper? Increase the reach of your titles
YUMPU automatically turns print PDFs into web optimized ePapers that Google loves.
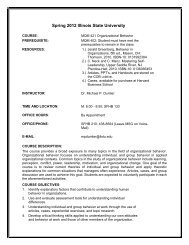
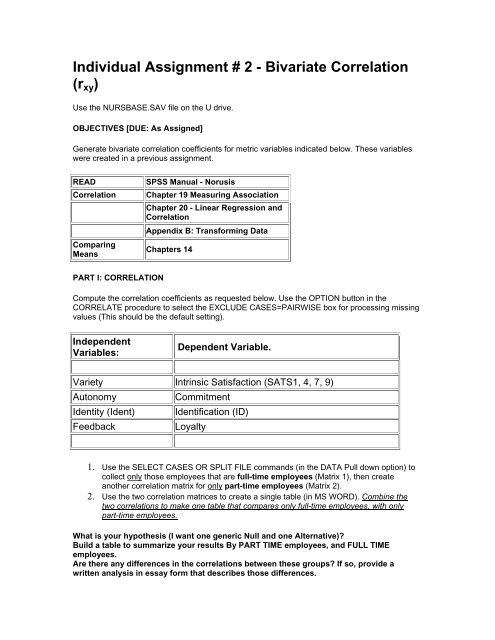
<strong>Individual</strong> <strong>Assignment</strong> # 2 - <strong>Bivariate</strong> <strong>Correlation</strong>(r xy )Use the NURSBASE.SAV file on the U drive.OBJECTIVES [DUE: As Assigned]Generate bivariate correlation coefficients for metric variables indicated below. These variableswere created in a previous assignment.READ<strong>Correlation</strong>ComparingMeansSPSS Manual - NorusisChapter 19 Measuring AssociationChapter 20 - Linear Regression and<strong>Correlation</strong>Appendix B: Transforming DataChapters 14PART I: CORRELATIONCompute the correlation coefficients as requested below. Use the OPTION button in theCORRELATE procedure to select the EXCLUDE CASES=PAIRWISE box for processing missingvalues (This should be the default setting).IndependentVariables:Dependent Variable.Variety Intrinsic Satisfaction (SATS1, 4, 7, 9)AutonomyCommitmentIdentity (Ident) Identification (ID)FeedbackLoyalty1. Use the SELECT CASES OR SPLIT FILE commands (in the DATA Pull down option) tocollect only those employees that are full-time employees (Matrix 1), then createanother correlation matrix for only part-time employees (Matrix 2).2. Use the two correlation matrices to create a single table (in MS WORD). Combine thetwo correlations to make one table that compares only full-time employees, with onlypart-time employees.What is your hypothesis (I want one generic Null and one Alternative)?Build a table to summarize your results By PART TIME employees, and FULL TIMEemployees.Are there any differences in the correlations between these groups? If so, provide awritten analysis in essay form that describes those differences.
PART II: COMPARING TWO MEANSCompare the means of the dependent variables across the dichotomized independent variable.Independent Variables: Dependent Variable.Role Conflict Intrinsic Satisfaction (SATS1, 4, 7, 9)CommitmentIdentification (ID)1. Divide ROLE CONFLICT into 2 groups at the mean (below mean/above mean).2. What is your hypothesis (I want one generic Null and one Alternative)?3. Using the T-TEST, compare each newly formed categorical IV against each DV.Written <strong>Assignment</strong> DUE: As assignedDevelop two tables (MSWORD) to graphically depict the correlations and the meancomparisons. Include a one page essay describing the content of your analysis.