Climate Change Risks to Coastal Buildings and Infrastructure
Climate Change Risks to Coastal Buildings and Infrastructure
Climate Change Risks to Coastal Buildings and Infrastructure

You also want an ePaper? Increase the reach of your titles
YUMPU automatically turns print PDFs into web optimized ePapers that Google loves.
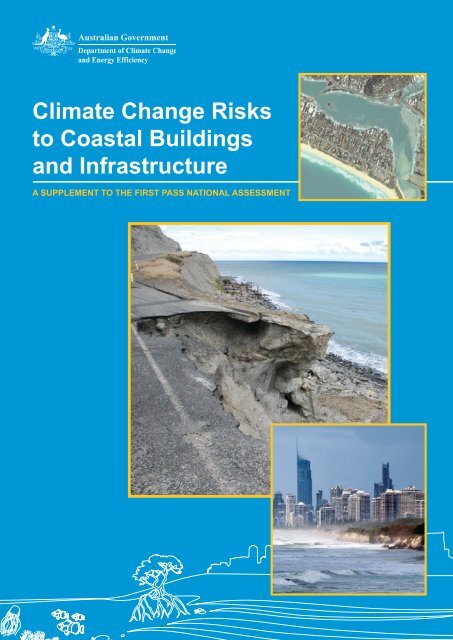
<strong>Climate</strong> <strong>Change</strong> <strong>Risks</strong><strong>to</strong> <strong>Coastal</strong> <strong>Buildings</strong><strong>and</strong> <strong>Infrastructure</strong>A Supplement <strong>to</strong> the First Pass National Assessment
About this bookletAdaptation is one of the three pillars of the AustralianGovernment’s climate change strategy.In late 2009 the Australian Government releasedthe first national assessment of climate change risks<strong>to</strong> Australia’s coastal assets. The <strong>Climate</strong> <strong>Change</strong><strong>Risks</strong> <strong>to</strong> Australia’s Coasts: a first pass nationalassessment report identified significant risks <strong>to</strong> ournatural ecosystems, beaches <strong>and</strong> l<strong>and</strong>scapes, <strong>and</strong> <strong>to</strong>our settlements. In particular, the report provided ananalysis of the location <strong>and</strong> number of residentialproperties that are at risk of inundation from rising sealevels <strong>and</strong> erosion as a consequence of climate change.This booklet supplements the analysis presentedin the <strong>Climate</strong> <strong>Change</strong> <strong>Risks</strong> <strong>to</strong> Australia’s Coastsreport. It provides additional data on the exposureof commercial buildings (e.g. retail precincts),light industrial buildings, <strong>and</strong> transport systems(road, rail, tramways) in Australia’s coastal areas.Existing data on residential properties is also reportedin the booklet, as well as subsequent modelling ofprojected population change <strong>and</strong> implications forthe exposure levels of residential properties.The analyses in <strong>Climate</strong> <strong>Change</strong> <strong>Risks</strong> <strong>to</strong> Australia’sCoasts <strong>and</strong> for this report were undertaken by GeoscienceAustralia using its National Exposure InformationSystem (NEXIS) database. Building replacement valuesin this booklet are also derived from data in NEXIS<strong>and</strong> reflect 2008 replacement values of assets.NEXIS is a relatively new dataset which is beingupdated over time. The analysis in this report was notavailable when the original report, <strong>Climate</strong> <strong>Change</strong><strong>Risks</strong> <strong>to</strong> Australia’s Coasts, was released late in 2009.The exposure of different infrastructure types ispresented at a state level, with information on the mostaffected local government areas for each state locatedat the back of the booklet.It should be noted that the analysis in this bookletconsiders the combined exposure <strong>to</strong> the hazardsof inundation <strong>and</strong> shoreline recession (erosion)associated with rising sea levels under a changingclimate. In the <strong>Climate</strong> <strong>Change</strong> <strong>Risks</strong> <strong>to</strong> Australia’sCoasts report (2009) the analyses for inundation <strong>and</strong>erosion were presented separately. There will thereforebe differences in the figures reported for residentialproperties between this booklet <strong>and</strong> the <strong>Climate</strong><strong>Change</strong> <strong>Risks</strong> <strong>to</strong> Australia’s Coasts report.The results from this assessment are useful at a nationalscale <strong>and</strong> will assist in prioritising future coastaladaptation planning needs. The available national datais insufficient <strong>to</strong> answer all questions underpinningdecision making at local <strong>and</strong> regional scales.This assessment focuses on impacts <strong>and</strong> risk at the endof this century. However, climate change impacts willnot s<strong>to</strong>p then <strong>and</strong> impacts beyond 2100 will need <strong>to</strong>be anticipated in decision making with long horizons.The report provides a plausible worst case scenario<strong>to</strong> assess risk <strong>and</strong> inform a dialogue on a nationalapproach <strong>to</strong> manage risk in the future.Nearer term impacts have also not been considered inthis assessment as finer scale modelling processes arerequired for this. Underst<strong>and</strong>ing of both the shorter <strong>and</strong>longer term implications will also be needed <strong>to</strong> informadaptation planning. Having access <strong>to</strong> this information allowsgovernments, the private sec<strong>to</strong>r <strong>and</strong> the Australiancommunity <strong>to</strong> underst<strong>and</strong> <strong>and</strong> take steps <strong>to</strong> manage risks.methodology – key points<strong>and</strong> caveats• An upper end sea level rise scenario of1.1 metres for the 2100 period was considered.• A s<strong>to</strong>rm tide allowance (1-in-100 year event)is included in the analysis for Tasmania,Vic<strong>to</strong>ria <strong>and</strong> New South Wales. For the otherstates, where state-wide s<strong>to</strong>rm tide modellingwas not available, an allowance for modelledhigh water level was used.• The inundation modelling used a relativelysimple ‘bucket fill’ approach based onmedium resolution elevation data. The upper<strong>and</strong> lower estimates help <strong>to</strong> bound the datauncertainties, particularly those associatedwith the medium resolution elevation data.• The analysis does not take account of existingcoastal protection such as seawalls, <strong>and</strong> doesnot include analysis of inundation due <strong>to</strong> riverineflooding (eg from extreme rainfall events).• The identification of ‘soft’ potentially erodibleshorelines was undertaken using the nationalSmartline dataset. <strong>Infrastructure</strong> located within110 metres of these ‘soft’ potentially erodibleshorelines was included in this analysis.• More detailed assessments may change therelative order of local government areas <strong>and</strong>the magnitude <strong>and</strong> timing of projected impacts.• Replacement values reported in this bookletare based on 2008 replacement values, asdrawn from Geoscience Australia’s NationalExposure Information System (NEXIS) database.2 <strong>Climate</strong> <strong>Change</strong> <strong>Risks</strong> <strong>to</strong> <strong>Coastal</strong> <strong>Buildings</strong> <strong>and</strong> <strong>Infrastructure</strong>
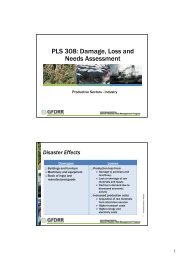
oveRvIewKey FIndIngS• The exposure of coastal assets <strong>to</strong> sea level rise associated with climate change is widespread <strong>and</strong> the hazardwill increase in<strong>to</strong> the future. Exposure will also increase as the population grows.• Greater than $226 billion in commercial, industrial, road <strong>and</strong> rail, <strong>and</strong> residential assets are potentiallyexposed <strong>to</strong> inundation <strong>and</strong> erosion hazards at a sea level rise of 1.1 metres (high end scenario for 2100).• <strong>Coastal</strong> assets at risk from the combined impact of inundation <strong>and</strong> shoreline recession include:– Between 5,800 <strong>and</strong> 8,600 commercial buildings, with a value ranging from $58 <strong>to</strong> $81 billion(2008 replacement value).– Between 3,700 <strong>and</strong> 6,200 light industrial buildings, with a value of between $4.2 <strong>and</strong> $6.7 billion(2008 replacement value).– Between 27,000 <strong>and</strong> 35,000 km of roads <strong>and</strong> rail, with a value of between $51 <strong>and</strong> $67 billion(2008 replacement value).• Decisions about future development, particularly in areas highly exposed <strong>to</strong> the impacts of climate change,should not increase risk.Governments at all levels need <strong>to</strong> be aware of thepotential future costs of climate change. In particular,climate change will impact on the frequency <strong>and</strong>intensity of natural disasters, which currently costaround $1 billion per year on average. 1 This couldmean the costs of natural disasters could double ormore in the next few decades. Intervention <strong>to</strong> constrainincreases in exposure <strong>to</strong> such hazards would be ofeconomic <strong>and</strong> social benefit.This analysis examines the exposure of coastalinfrastructure (commercial, light industrial, residential<strong>and</strong> transport) <strong>to</strong> inundation <strong>and</strong> erosion under a sealevel rise scenario of 1.1 metres (high end scenario for2100). A sea level rise of 1.1 metres was combinedwith a 1 in 100 year event for Tasmania, Vic<strong>to</strong>ria <strong>and</strong>New South Wales. For the other states it is based ona sea level rise scenario of 1.1 metres combined witha very high tide.Nationally, the combined value of commercial,light industrial, transport <strong>and</strong> residential infrastructureat risk from a sea level rise of 1.1 metres (high endscenario for 2100) is greater than $226 billion(upper estimate – 2008 replacement value; figure 1).Queensl<strong>and</strong> has the greatest combined risk, in termsof both quantity <strong>and</strong> 2008 replacement value for a sealevel rise of 1.1 metres.In this analysis only the inundation <strong>and</strong> erosionhazards associated with rising sea levels wereconsidered. However, coastal infrastructure is likely<strong>to</strong> be exposed <strong>to</strong> other climate change hazards.For example, saltwater intrusion may be of particularconcern for the numerous old dump sites <strong>and</strong> rubbishtips around the coast, <strong>and</strong> potential changes in windspeed <strong>and</strong> extreme s<strong>to</strong>rm events could cause damageor fatigue <strong>to</strong> structures.Pho<strong>to</strong> credit: Emergency Management Australia<strong>Climate</strong> <strong>Change</strong> <strong>Risks</strong> <strong>to</strong> <strong>Coastal</strong> <strong>Buildings</strong> <strong>and</strong> <strong>Infrastructure</strong> 3
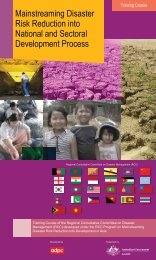
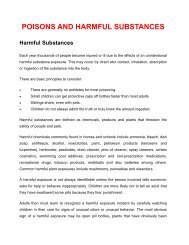
Sea level RiseIn recent decades, the rate of increase in sea levelhas been an order of magnitude faster than theaverage rate of rise over the previous severalthous<strong>and</strong> years. From 1993 <strong>to</strong> 2003 global sea levelrose by about 3.1 mm a year, compared <strong>to</strong> 1.8 mma year when averaged from 1961 <strong>to</strong> 2003. Globalaverage sea level rise during the twentieth centurywas 1.7 mm a year, which was slightly higher thanthe 1.2 mm a year relative rise recorded aroundAustralia for the period.In 2007 the Intergovernmental Panel on<strong>Climate</strong> <strong>Change</strong> (IPCC) issued projections inits Fourth Assessment Report for sea level riseof between 18–59 cm plus an allowance of10–20 cm for ice sheet dynamics (79 cm) by 2100. 2There is growing consensus in the science communitythat sea level rise at the upper end of the IPCCestimates is plausible by the end of this century,<strong>and</strong> that a rise of more than 1.0 metre <strong>and</strong> as highas 1.5 metres cannot be ruled out. It should also benoted that sea levels will continue <strong>to</strong> rise after 2100.A sea level rise of 1.1 metres was originallyselected for national risk assessment analysis basedon the plausible range of sea level rise values fromresearch published after the IPCC forth AssessmentReport. While estimates of <strong>to</strong>tal sea level riseremain uncertain, nearly all of the uncertaintiesin sea level rise projections operate <strong>to</strong> increaseestimates of sea level rise.Local sea level rise (mm/year) from the early 1990s <strong>to</strong> June 2010.Source: National Tidal Centre 2010The analysis did not include consideration of criticalinfrastructure such as hospitals, or infrastructureinvolved in the delivery of some essential services suchas wastewater systems. Since much of this infrastructureis concentrated around the coast, it can be expected thatclimate change will have implications for the deliveryof some of these essential services in<strong>to</strong> the future.The methodology used in this report is the same as thatused in <strong>Climate</strong> <strong>Change</strong> <strong>Risks</strong> <strong>to</strong> Australia’s Coast (2009).A summary of the methodology is provided in the‘Methodology – key points <strong>and</strong> caveats’ box on page 2.The analysis of exposure reported in this documentis based on existing infrastructure s<strong>to</strong>ck. The impactthat a changing, future population will have onthe exposure of coastal residential assets was alsoassessed. Based on current patterns of developmentthe magnitude of risk <strong>to</strong> coastal assets has the potential<strong>to</strong> increase significantly in<strong>to</strong> the future.Avoidance of future risk is the most cost-effectiveadaptation response in most cases. Decisions on futuredevelopment, particularly in areas highly exposed <strong>to</strong>the impacts of climate change, should not increaserisk. However, as the data presented in this bookletreveals, there will still be a large legacy risk fromexisting infrastructure in the coastal zone, which willrequire attention. Early planning can help <strong>to</strong> minimiseour future exposure.Replacement Value ($ billion)605040302010Road & RailLight IndustrialCommercialResidentialLighter bars represent lowerestimates & darker barsrepresent upper estimates0QLD SA NSW WA VICTAS NTFigure 1: The combined estimated replacement value ($ billion) for residential, commercial <strong>and</strong> transport infrastructure for a 1.1 metre sea level rise.4 <strong>Climate</strong> <strong>Change</strong> <strong>Risks</strong> <strong>to</strong> <strong>Coastal</strong> <strong>Buildings</strong> <strong>and</strong> <strong>Infrastructure</strong>
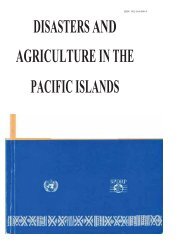
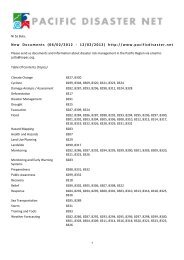
RISKS <strong>to</strong> CommeRCIAlBuIldIngSIn this analysis, a commercial building is definedas one primarily occupied by businesses engaged incommercial trade, including wholesale, retail, office,<strong>and</strong> transport activities. The following analysis ofexposure <strong>to</strong> commercial buildings uses the samemethodology as in the report <strong>Climate</strong> <strong>Change</strong> <strong>Risks</strong><strong>to</strong> Australia’s Coast (2009). A summary of thismethodology is provided on page 2.Nationally, between 5,800 <strong>and</strong> 8,600 commercialbuildings in coastal regions are exposed <strong>to</strong> the combinedimpact of inundation <strong>and</strong> shoreline recession at asea level rise of 1.1 metres (high end scenario for 2100).The value of these assets is between $58 <strong>and</strong> $81 billiondollars (2008 replacement value).The actual number of businesses exposed may begreater than the number of commercial buildings,particularly in major commercial centres where thereare large shopping complexes with many businessesunder a single roof.Vic<strong>to</strong>ria <strong>and</strong> Western Australia have the mostcommercial buildings exposed <strong>to</strong> a sea levelrise of 1.1 metres (high end scenario for 2100),with 1,500–2,000 buildings at risk in Vic<strong>to</strong>ria<strong>and</strong> 1,500–2,100 in Western Australia (Figure 2).There are also significant numbers of buildings exposedin Queensl<strong>and</strong> (900–1,400), New South Wales(700–1,200) <strong>and</strong> South Australia (900–1,500).Replacement values for these assets range from$22–$27 billion in South Australia; $12–$17 billionin Western Australia; $10–$15 billion in Queensl<strong>and</strong>;$8–$12 billion in Vic<strong>to</strong>ria; <strong>and</strong> $5–$9 billion inNew South Wales.The replacement values are calculated based oninformation held in the NEXIS database <strong>and</strong> takein<strong>to</strong> account the size of exposed buildings, as wellas average replacement values per state or localgovernment area (where available).The figures represent the <strong>to</strong>tal value of assets at risk,though it should be noted that the extent of damagedue <strong>to</strong> flooding would not always, or often, resultin a <strong>to</strong>tal replacement of all infrastructure affected.Number of Commercial <strong>Buildings</strong>25002000150010005002100 – Lower Estimate2100 – Upper Estimate0QLD NSW VIC SA WA TAS NTFigure 2: Potential risk <strong>to</strong> commercial buildings in Australia from the combined impact of inundation <strong>and</strong> shoreline recession for a 1.1 metre sea level rise.<strong>Climate</strong> <strong>Change</strong> <strong>Risks</strong> <strong>to</strong> <strong>Coastal</strong> <strong>Buildings</strong> <strong>and</strong> <strong>Infrastructure</strong> 5
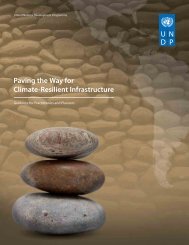
RISKS <strong>to</strong> lIght InduStRIAlBuIldIngSPho<strong>to</strong> credit: Port of Melbourne CorporationIn this analysis, a light industrial building is definedas one primarily used for warehousing, manufacturing,assembly activities <strong>and</strong> services. The followinganalysis of exposure <strong>to</strong> commercial buildings usesthe same methodology as in the report <strong>Climate</strong> <strong>Change</strong><strong>Risks</strong> <strong>to</strong> Australia’s Coast (2009). A summary of thismethodology is provided on page 2.Nationally, between 3,700 <strong>and</strong> 6,200 light industrialbuildings are exposed <strong>to</strong> the combined impact ofinundation <strong>and</strong> shoreline recession at a sea level riseof 1.1 metres (high end scenario for 2100). The valueof these assets is between $4.2 <strong>and</strong> $6.7 billion dollars(2008 replacement value).Queensl<strong>and</strong> has the most light industrial buildingsexposed <strong>to</strong> a sea level rise of 1.1 metres (high endscenario for 2100), with 1,200–1,800 buildings at risk(Figure 3).The number of buildings exposed is similar inNew South Wales (600–1,000), Vic<strong>to</strong>ria (600–1,000),South Australia (400–1,100) <strong>and</strong> Western Australia(600–900).Replacement values for these assets range from$1.3–$2.0 billion in Queensl<strong>and</strong>; $0.6–$1.2 billionin South Australia; $0.8–$1.1 billion in New South Wales;$0.7–$1.1 billion in Western Australia; <strong>and</strong> $0.5–$0.8billion in Vic<strong>to</strong>ria.The replacement values are calculated based oninformation held in the NEXIS database <strong>and</strong> takein<strong>to</strong> account the size of exposed buildings, as wellas average replacement values per state or localgovernment area (where available).The figures represent the <strong>to</strong>tal value of assets at risk,though it should be noted that the extent of damagedue <strong>to</strong> flooding would not always, or often, result ina <strong>to</strong>tal replacement of all infrastructure affected.Number of Light Industrial <strong>Buildings</strong>2000150010005002100 – Lower Estimate2100 – Upper Estimate0QLD NSW VIC SA WA TAS NTFigure 3: Potential risk <strong>to</strong> light industrial buildings in Australia from the combined impact of inundation <strong>and</strong> shoreline recession for a sea level riseof 1.1 metres.6 <strong>Climate</strong> <strong>Change</strong> <strong>Risks</strong> <strong>to</strong> <strong>Coastal</strong> <strong>Buildings</strong> <strong>and</strong> <strong>Infrastructure</strong>
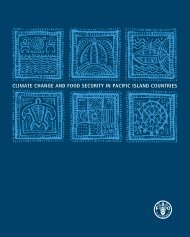
RISKS <strong>to</strong> tRAnSpoRtInFRAStRuCtuReRoadsNationally, between 26,000 <strong>and</strong> 33,000 km of roadsare potentially at risk from the combined impacts ofinundation <strong>and</strong> shoreline recession for a sea level riseof 1.1 metres (high end scenario for 2100; figures4 <strong>and</strong> 5). This figure is made up of 1,100–1,500 kmof freeway, 10,000–13,000 km of main roads <strong>and</strong>15,000–18,000 km of unsealed roads. This roadwayhas a value of between $46 <strong>and</strong> $60 billion (2008replacement value). While most of the risk is <strong>to</strong> mainroads, unsealed roads <strong>and</strong> tracks, the cost <strong>to</strong> replacefreeway will be higher than replacing the same lengthof other types of road, <strong>and</strong> disruption <strong>to</strong> freeways willhave a greater impact on transporting goods <strong>and</strong> people.Western Australia has the greatest length of roadwayat risk, with between 7,500 <strong>and</strong> 9,100 km exposed, ata replacement value of between $8.7 <strong>and</strong> $11.3 billion.Much of the exposure is <strong>to</strong> unsealed roadway.Queensl<strong>and</strong> has the greatest value of existing roadinfrastructure at risk, with between $9.7 <strong>and</strong> $12.9billion for between 3,600 <strong>and</strong> 4,700 km of roadway.Queensl<strong>and</strong>’s higher value relates <strong>to</strong> the greater percentageof freeway <strong>and</strong> main roads at risk in Queensl<strong>and</strong>.All states, with exception of Tasmania <strong>and</strong> theNorthern Terri<strong>to</strong>ry, have an estimated replacementvalue of greater than $7 billion.Length (km)400350300250200150100500Freeway – LowerFreeway – UpperQLD NSW VIC SA WA TAS NTFigure 4: Estimated length of freeway at risk from the combinedimpact of inundation <strong>and</strong> shoreline recession for a 1.1 metresea level rise.1000090008000Main RoadsUnsealed RoadsTotal length7000Length (km)6000500040003000200010000Lower Upper Lower Upper Lower Upper Lower Upper Lower Upper Lower Upper Lower UpperQLD NSW VIC SA WA TAS NTFigure 5: Estimated length of road infrastructure at risk from the combined impact of inundation <strong>and</strong> shoreline recession for a 1.1 metre sea level rise.<strong>Climate</strong> <strong>Change</strong> <strong>Risks</strong> <strong>to</strong> <strong>Coastal</strong> <strong>Buildings</strong> <strong>and</strong> <strong>Infrastructure</strong> 7
Rail <strong>and</strong> tramwaysNationally, between 1,200 <strong>and</strong> 1,500 km of raillines <strong>and</strong> tramways are potentially at risk frominundation <strong>and</strong> shoreline recession from a sea levelrise of 1.1 metres (high end scenario for 2100;figure 6). These assets have a value of between$4.9 <strong>and</strong> $6.4 billion (2008 replacement value).Queensl<strong>and</strong> has the greatest length (between 420 <strong>and</strong>570 km) <strong>and</strong> highest estimated replacement value(between $1.7 <strong>and</strong> $2.3 billion) for rail <strong>and</strong> tramwayinfrastructure. New South Wales, South Australia<strong>and</strong> Tasmania have a replacement value of between$0.6 <strong>and</strong> $1.3 billion each. Assets exposed in Vic<strong>to</strong>ria,Western Australia <strong>and</strong> the Northern Terri<strong>to</strong>ry have areplacement value of between $0.1 <strong>and</strong> $0.5 billion.6005002100 – Lower Estimate2100 – Upper Estimate400Length (km)3002001000QLD NSW VIC SA WA TAS NTFigure 6: Estimated length of existing rail <strong>and</strong> tramway infrastructure at risk from the combined impact of inundation <strong>and</strong> shoreline recession for a1.1 metre sea level rise.The analysis of exposure <strong>to</strong> road <strong>and</strong> rail uses the same methodology as in the report <strong>Climate</strong> <strong>Change</strong> <strong>Risks</strong><strong>to</strong> Australia’s Coast (2009). A summary of this methodology is provided on page 2.The <strong>to</strong>tal value <strong>and</strong> length of road <strong>and</strong> rail infrastructure indicates a high level of exposure <strong>to</strong> future climate changeimpacts. Impacts <strong>to</strong> transport networks will also have flow on effects – for emergency evacuation, ability <strong>to</strong> efficientlymove goods <strong>and</strong> people <strong>and</strong> for access <strong>to</strong> service facilities, such as hospitals. Analysing the implications of disruption<strong>to</strong> transport networks <strong>and</strong> associated services will be an important part of preparing local <strong>and</strong> regional responses <strong>to</strong> theimpacts of climate change.The replacement values are calculated based on information held in the NEXIS database <strong>and</strong> are based on averagereplacement values per state or local government area (where available).The figures represent the <strong>to</strong>tal value of assets at risk, though it should be noted that the extent of damage due<strong>to</strong> flooding would not always, or often, result in a <strong>to</strong>tal replacement of all infrastructure affected.8 <strong>Climate</strong> <strong>Change</strong> <strong>Risks</strong> <strong>to</strong> <strong>Coastal</strong> <strong>Buildings</strong> <strong>and</strong> <strong>Infrastructure</strong>
RISKS <strong>to</strong> ReSIdentIAlBuIldIngSPho<strong>to</strong> credit: Tobias LanchenauerIn this analysis, a residential building is defined as afixed structure consisting of one or more residencesprimarily for housing people. The following analysisof exposure <strong>to</strong> residential buildings uses the samemethodology as in the report <strong>Climate</strong> <strong>Change</strong> <strong>Risks</strong><strong>to</strong> Australia’s Coast (2009). A summary of thismethodology is provided on page 2.It should be noted that this analysis considers thecombined exposure <strong>to</strong> the hazards of inundation <strong>and</strong>shoreline recession. In the <strong>Climate</strong> <strong>Change</strong> <strong>Risks</strong> <strong>to</strong>Australia’s Coasts report the analyses for inundation<strong>and</strong> erosion were presented separately. The figuresreported here for residential properties will thereforebe different from the figures reported in <strong>Climate</strong><strong>Change</strong> <strong>Risks</strong> <strong>to</strong> Australia’s Coasts.Nationally, between 187,000 <strong>and</strong> 274,000 residentialbuildings are exposed <strong>to</strong> the combined impact ofinundation <strong>and</strong> shoreline recession at a sea level riseof 1.1 metres (high end scenario for 2100). The valueof these assets is between $51 <strong>and</strong> $72 billion dollars(2008 replacement value). The upper estimate figure isgreater than the $63 billion reported in <strong>Climate</strong> <strong>Change</strong><strong>Risks</strong> <strong>to</strong> Australia’s Coasts, which did not include thevalue of buildings potentially exposed <strong>to</strong> erosion.Queensl<strong>and</strong> <strong>and</strong> New South Wales have the mostresidential buildings exposed <strong>to</strong> a sea level rise of1.1 metres (high end scenario for 2100), with between44,000 <strong>and</strong> 68,000 residential buildings at risk in eachstate (Figure 7).There are also significant numbers of buildingsexposed in Vic<strong>to</strong>ria <strong>and</strong> South Australia(31,000–48,000 in each state), Western Australia(20,000–30,000), <strong>and</strong> Tasmania (12,000–15,000).Replacement values for these assets range from$15–$20 billion in Queensl<strong>and</strong>; $14–$20 billionin New South Wales; $8–$11 billion in Vic<strong>to</strong>ria;$5–$8 billion in each of South Australia <strong>and</strong>Western Australia; <strong>and</strong> $4 billion in Tasmania(2008 replacement values).The replacement values are calculated based oninformation held in the NEXIS database <strong>and</strong> arebased on average replacement values per state orlocal government area (where available).The figures represent the <strong>to</strong>tal value of assets at risk,though it should be noted that the extent of damagedue <strong>to</strong> flooding would not always, or often, result ina <strong>to</strong>tal replacement of all infrastructure affected.Total Number of Residential <strong>Buildings</strong>80000700006000050000400003000020000100002100 – Lower Estimate2100 – Upper Estimate0QLD NSW VIC SA WA TAS NTFigure 7: The range of potential risk <strong>to</strong> residential buildings in Australia for a sea level rise of 1.1 metres.<strong>Climate</strong> <strong>Change</strong> <strong>Risks</strong> <strong>to</strong> <strong>Coastal</strong> <strong>Buildings</strong> <strong>and</strong> <strong>Infrastructure</strong> 9
projecting risk against a changingpopulationAustralia’s population is projected <strong>to</strong> increasesignificantly between now <strong>and</strong> 2100. The AustralianBureau of Statistics (ABS) has forecast an increasefrom 21 million in 2007 <strong>to</strong> between 30.9 <strong>and</strong> 42.5 millionpeople by 2056, <strong>and</strong> <strong>to</strong> between 33.7 <strong>and</strong> 62.2 millionpeople by 2101 (see Figure 8). 3 The ABS projectionsare based on differing assumptions of fertility, mortality,internal migration <strong>and</strong> overseas migration.More recently, the Intergenerational Report 2010projects that Australia’s population will grow by65 per cent, <strong>to</strong> more than 35 million people in 2049. 4Based on current trends much of this growth would beaccommodated in coastal settlements <strong>and</strong> cities.Figure 8: Population growth projections for Australia 2008–2101.Series B largely reflects current trends in fertility, life expectancyat birth, net overseas migration <strong>and</strong> net interstate migration.Source: ABSAn analysis of the risk <strong>to</strong> infrastructure shows howexposure <strong>to</strong> climate change impacts for residentialbuildings can change as the population grows (basedon current settlement patterns). Figure 9 shows thenumber of residential buildings exposed <strong>to</strong> inundation<strong>and</strong> erosion under a 1.1 metre sea level rise scenarioagainst the 2008 population, the ABS Series A (high),B (business as usual) <strong>and</strong> C (low) population scenarios.The exposure is significantly increased by the ABSSeries A & B population projections. At higherprojected population growth (Series A), the increasein population has a greater impact on the numberof buildings at risk than the increase in sea level.Number of <strong>Buildings</strong> at Risk250000200000150000100000500002008 PopulationSeries C (low)Series B (business as usual)Series A (high)0Lower Upper Lower Upper Lower Upper Lower Upper Lower Upper Lower Upper Lower UpperQLD NSW VIC SA WA TAS NTFigure 9: The range of potential risk <strong>to</strong> residential buildings in Australia for a sea level rise of 1.1 metres for the 2008 population <strong>and</strong> also for theABS Series A, B & C population projections.References1 Bureau of Transport Economics 2001, Economic costs of natural disastersin Australia. Report 103, Canberra.2 Intergovernmental Panel on <strong>Climate</strong> <strong>Change</strong> Fourth Assessment Report(AR4, 2007).3 Australian Bureau of Statistics (ABS) 2008, Population Projections, Australia,2006-2101, catalogue no. 3222.0.4 Commonwealth Treasury 2010, Intergenerational Report 2010, Australia<strong>to</strong> 2050: future challenges, http://www.treasury.gov.au/igr/igr2010/report/html/00_Preliminaries.asp.10 <strong>Climate</strong> <strong>Change</strong> <strong>Risks</strong> <strong>to</strong> <strong>Coastal</strong> <strong>Buildings</strong> <strong>and</strong> <strong>Infrastructure</strong>
Analysis by local government area – western AustraliaCommercial <strong>Buildings</strong>light Industrial <strong>Buildings</strong>No. of Commercial <strong>Buildings</strong>6005004003002001000BunburyM<strong>and</strong>urahBussel<strong>to</strong>nBroomeEsperanceLowerUpperCanningFigure 10: Potential risk <strong>to</strong> commercial buildings in Western Australiafrom the combined impact of inundation <strong>and</strong> shoreline recession bylocal government area for a 1.1 metre sea level rise scenario.No. of Light Industrial <strong>Buildings</strong>300250200150100500Port Hedl<strong>and</strong>Bussel<strong>to</strong>nBroomeWyndham-East KimberleyBunburyLowerUpperCoorowFigure 11: Potential risk <strong>to</strong> light industry in Western Australia fromthe combined impact of inundation <strong>and</strong> shoreline recession by localgovernment area for a 1.1 metre sea level rise scenario.western AustraliaBetween 333 <strong>and</strong> 496 commercial buildings in thelocal government area of Bunbury may be affectedby a 1.1 metre sea level rise (high end scenario for2100). The number of exposed commercial buildingsin M<strong>and</strong>urah (between 242 <strong>and</strong> 400) <strong>and</strong> Bussel<strong>to</strong>n(between 209 <strong>and</strong> 260) is also high compared <strong>to</strong> otherWestern Australian local government areas. The graphshows the location of more than 85% of the potentiallyaffected commercial buildings in Western Australia,as identified in this analysis.RoadsBetween 176 <strong>and</strong> 252 light industrial buildings inthe local government areas of Port Hedl<strong>and</strong> <strong>and</strong>Bussel<strong>to</strong>n may be affected by a 1.1 metre sea levelrise (high end scenario for 2100). The number ofbuildings in Broome (between 149 <strong>and</strong> 183) is alsohigh. The graph shows the location of more than 90%of the potentially affected light industrial buildingsin Western Australia, as identified in this analysis.Rail2,500Lower30Lower2,000Upper25UpperLength (km)1,5001,0005000BroomeCarnarvonPort Hedl<strong>and</strong>Shark BayAshbur<strong>to</strong>nWyndham-East KimberleyRoebourneBussel<strong>to</strong>nExmouthDerby-West KimberleyFigure 12: Potential risk <strong>to</strong> roads in Western Australia from thecombined impact of inundation <strong>and</strong> shoreline recession by localgovernment area for a 1.1 metre sea level rise scenario.Length (km)20151050Port Hedl<strong>and</strong>RoebourneKwinanaBunburyFigure 13: Potential risk <strong>to</strong> rail in Western Australia from thecombined impact of inundation <strong>and</strong> shoreline recession by localgovernment area for a 1.1 metre sea level rise scenario.Roads in the local government areas of Broome (between 1,903 <strong>and</strong> 2,056 km at risk), Carnarvon (between794 <strong>and</strong> 929 km) <strong>and</strong> Port Hedl<strong>and</strong> (between 562 <strong>and</strong> 685 km) have a significant exposure with a sea level riseof 1.1 metres (high end scenario for 2100). Between 285 <strong>and</strong> 348 km of roads in the local government areasof Ashbur<strong>to</strong>n, Wyndham-East Kimberley <strong>and</strong> Bussel<strong>to</strong>n are also exposed with a sea level rise of 1.1 metres.Port Hedl<strong>and</strong> has the greatest length of rail exposed, with between 23 <strong>and</strong> 28 km of rail line at risk. The graphsshow the location of about 80% of the potentially affected roads <strong>and</strong> about 80% of the potentially affected railin Western Australia, as identified in this analysis.<strong>Climate</strong> <strong>Change</strong> <strong>Risks</strong> <strong>to</strong> <strong>Coastal</strong> <strong>Buildings</strong> <strong>and</strong> <strong>Infrastructure</strong> 11
Analysis by local government area – South AustraliaCommercial <strong>Buildings</strong>light Industrial <strong>Buildings</strong>South AustraliaNo. of Commercial <strong>Buildings</strong>6005004003002001000Port Adelaide EnfieldPort Pirie City <strong>and</strong> DistsCharles SturtPort AugustaGrantPort LincolnKings<strong>to</strong>nLowerUpperOnkaparingaFigure 14: Potential risk <strong>to</strong> commercial buildings in South Australiafrom the combined impact of inundation <strong>and</strong> shoreline recession bylocal government area for a 1.1 metre sea level rise scenario.No. of Light Industrial <strong>Buildings</strong>8007006005004003002001000Port Adelaide EnfieldHoldfast BayPort Pirie City <strong>and</strong> DistsCharles SturtLowerUpperSalisburyFigure 15: Potential risk <strong>to</strong> light industry in South Australia fromthe combined impact of inundation <strong>and</strong> shoreline recession by localgovernment area for a 1.1 metre sea level rise scenario.Between 265 <strong>and</strong> 506 commercial buildings in the localgovernment area of Port Adelaide Enfield may be affectedby a 1.1 metre sea level rise (high end scenario for 2100).The number of exposed commercial buildings in PortPirie (between 92 <strong>and</strong> 171), Charles Sturt (between 87<strong>and</strong> 141) <strong>and</strong> Port Augusta (between 60 <strong>and</strong> 134) is alsohigh compared <strong>to</strong> other South Australian local governmentareas. The graph shows the location of about 80%of the potentially affected commercial buildingsin South Australia, as identified in this analysis.RoadsBetween 200 <strong>and</strong> 692 light industrial buildings in thelocal government area of Port Adelaide Enfield maybe affected by a 1.1 metre sea level rise (high endscenario for 2100). The number of exposed buildingsin Holdfast Bay (between 118 <strong>and</strong> 121) is also highcompared <strong>to</strong> other South Australian local governmentareas. The graph shows the location of about 95%of the potentially affected light industrial buildingsin South Australia, as identified in this analysis.RailLength (km)9008007006005004003002001000Yorke PeninsulaThe CoorongLowerUpperUnincorporated SAKings<strong>to</strong>nPort Pirie City <strong>and</strong> DistsPort Adelaide EnfieldCedunaCharles SturtStreaky BayRobeFigure 16: Potential risk <strong>to</strong> roads in South Australia from thecombined impact of inundation <strong>and</strong> shoreline recession by localgovernment area for a 1.1 metre sea level rise scenario.Length (km)6050403020100Port Adelaide EnfieldPort Pirie City <strong>and</strong> DistsPort AugustaMount RemarkableUnincorporated SALowerUpperSalisburyFigure 17: Potential risk <strong>to</strong> rail in South Australia from the combinedimpact of inundation <strong>and</strong> shoreline recession by local governmentarea for a 1.1 metre sea level rise scenario.Roads in the local government areas of Yorke Peninsula (between 670 <strong>and</strong> 765 km at risk) <strong>and</strong> The Coorong (between595 <strong>and</strong> 730 km) have a significant exposure with a sea level rise of 1.1 metres (high end scenario for 2100). Between160 <strong>and</strong> 269 km of roads in the local government areas Port Adelaide Enfield <strong>and</strong> Charles Sturt are also exposed witha sea level rise of 1.1 metres. Port Adelaide Enfield has the greatest length of rail exposed, with between 38 <strong>and</strong> 48 kmof rail line at risk. The graphs show the location of about 75% of the potentially affected roads <strong>and</strong> about 80% of thepotentially affected rail in South Australia, as identified in this analysis.12 <strong>Climate</strong> <strong>Change</strong> <strong>Risks</strong> <strong>to</strong> <strong>Coastal</strong> <strong>Buildings</strong> <strong>and</strong> <strong>Infrastructure</strong>
Analysis by local government area – tasmaniaCommercial <strong>Buildings</strong>light Industrial <strong>Buildings</strong>70Lower80LowerNo. of Commercial <strong>Buildings</strong>605040302010UpperNo. of Light Industrial <strong>Buildings</strong>70605040302010Upper0Huon ValleyHobartBurnieGeorge TownFigure 18: Potential risk <strong>to</strong> commercial buildings in Tasmania fromthe combined impact of inundation <strong>and</strong> shoreline recession by localgovernment area for a 1.1 metre sea level rise scenario.0BurnieLaunces<strong>to</strong>nHobartCentral CoastFigure 19: Potential risk <strong>to</strong> light industry in Tasmania from thecombined impact of inundation <strong>and</strong> shoreline recession by localgovernment area for a 1.1 metre sea level rise scenario.tasmaniaBetween 35 <strong>and</strong> 65 commercial buildings in the localgovernment area of Huon Valley <strong>and</strong> between 56 <strong>and</strong>58 commercial buildings in Hobart may be affected bya 1.1 metre sea level rise (high end scenario for 2100).The graph shows the location of nearly 80% of thepotentially affected commercial buildings in Tasmania,as identified in this analysis.RoadsBetween 63 <strong>and</strong> 71 light industrial buildings in the localgovernment area of Burnie may be affected by a 1.1 metresea level rise (high end scenario for 2100). The numberof exposed buildings in Launces<strong>to</strong>n (between 33 <strong>and</strong>62) is also high. The graph shows the location ofabout 80% of the potentially affected light industrialbuildings in Tasmania, as identified in this analysis.RailLength (km)300250200150100500FlindersGlamorgan/Spring BayCircular HeadClarenceBreak O'DayHuon ValleyKingboroughLowerUpperLength (km)50454035302520151050BurnieDevonportCentral CoastWaratah/WynyardLowerUpperFigure 20: Potential risk <strong>to</strong> roads in Tasmania from the combinedimpact of inundation <strong>and</strong> shoreline recession by local governmentarea for a 1.1 metre sea level rise scenario.Figure 21: Potential risk <strong>to</strong> rail in Tasmania from the combinedimpact of inundation <strong>and</strong> shoreline recession by local governmentarea for a 1.1 metre sea level rise scenario.Roads in the local government areas of Flinders (between 222 <strong>and</strong> 266 km at risk) <strong>and</strong> Glamorgan/Spring Bay(between 211 <strong>and</strong> 243 km) have a significant exposure with a sea level rise of 1.1 metres (high end scenario for2100). Burnie has the greatest length of rail exposed, with between 42 <strong>and</strong> 46 km of rail line at risk. The graphsshow the location of about 70% of the potentially affected road <strong>and</strong> about 85% of the potentially affected rail inTasmania, as identified in this analysis.<strong>Climate</strong> <strong>Change</strong> <strong>Risks</strong> <strong>to</strong> <strong>Coastal</strong> <strong>Buildings</strong> <strong>and</strong> <strong>Infrastructure</strong> 13
Analysis by local government area – vic<strong>to</strong>riaCommercial <strong>Buildings</strong>light Industrial <strong>Buildings</strong>vic<strong>to</strong>riaNo. of Commercial <strong>Buildings</strong>450400350300250200150100500Surf CoastEast Gippsl<strong>and</strong>MaribyrnongKings<strong>to</strong>nFranks<strong>to</strong>nGreater GeelongMorning<strong>to</strong>n PeninsulaPort PhillipMelbourneLowerUpperHobsons BayFigure 22: Potential risk <strong>to</strong> commercial buildings in Vic<strong>to</strong>ria fromthe combined impact of inundation <strong>and</strong> shoreline recession by localgovernment area for a 1.1 metre sea level rise scenario.No. of Light Industrial <strong>Buildings</strong>400350300250200150100500Greater GeelongFranks<strong>to</strong>nKings<strong>to</strong>nMorning<strong>to</strong>n PeninsulaHobsons BayLowerUpperFigure 23: Potential risk <strong>to</strong> light industry in Vic<strong>to</strong>ria from thecombined impact of inundation <strong>and</strong> shoreline recession by localgovernment area for a 1.1 metre sea level rise scenario.Between 347 <strong>and</strong> 417 commercial buildings in the localgovernment area of Surf Coast may be affected bya 1.1 metre sea level rise (high end scenario for 2100).The number of exposed commercial buildings in EastGippsl<strong>and</strong> (between 374 <strong>and</strong> 384) <strong>and</strong> Maribyrnong(between 242 <strong>and</strong> 347) is also high compared <strong>to</strong> otherlocal government areas in Vic<strong>to</strong>ria. The graph shows thelocation of 95% of the potentially affected commercialbuildings in Vic<strong>to</strong>ria, as identified in this analysis.RoadsBetween 290 <strong>and</strong> 374 light industrial buildings inthe local government area of Greater Geelong maybe affected by a 1.1 metre sea level rise (high endscenario for 2100). The number of exposed buildingsin Franks<strong>to</strong>n (between 152 <strong>and</strong> 280) <strong>and</strong> Kings<strong>to</strong>n(between 79 <strong>and</strong> 132) is also high compared <strong>to</strong> otherlocal government areas in Vic<strong>to</strong>ria. The graph showsthe location of more than 90% of the potentiallyaffected light industrial buildings in Vic<strong>to</strong>ria, asidentified in this analysis.RailLength (km)9008007006005004003002001000LowerUpperWelling<strong>to</strong>nGreater GeelongEast Gippsl<strong>and</strong>Kings<strong>to</strong>nCardiniaSouth Gippsl<strong>and</strong>CaseyHobsons BayMoyneGlenelgFigure 24: Potential risk <strong>to</strong> roads in Vic<strong>to</strong>ria from the combinedimpact of inundation <strong>and</strong> shoreline recession by local governmentarea for a 1.1 metre sea level rise scenario.Length (km)454035302520151050MelbourneCardiniaHobsons BayCaseyLowerUpperFigure 25: Potential risk <strong>to</strong> rail in Vic<strong>to</strong>ria from the combined impac<strong>to</strong>f inundation <strong>and</strong> shoreline recession by local government area for a1.1 metre sea level rise scenario.Roads in the local government areas of Welling<strong>to</strong>n (between 640 <strong>and</strong> 775 km at risk), Greater Geelong (between382 <strong>and</strong> 457 km) <strong>and</strong> East Gippsl<strong>and</strong> (between 376 <strong>and</strong> 417 km) have a significant exposure with a sea level riseof 1.1 metres (high end scenario for 2100). Between 165 <strong>and</strong> 226 km of roads in the local government areas ofKings<strong>to</strong>n <strong>and</strong> Cardinia are also exposed with a sea level rise of 1.1 metres. The City of Melbourne has the greatestlength of rail exposed, with between 27 <strong>and</strong> 39 km of rail line at risk. The graphs show the location of about 80%of the potentially affected road <strong>and</strong> about 75% of the potentially affected rail in Vic<strong>to</strong>ria, as identified in this analysis.14 <strong>Climate</strong> <strong>Change</strong> <strong>Risks</strong> <strong>to</strong> <strong>Coastal</strong> <strong>Buildings</strong> <strong>and</strong> <strong>Infrastructure</strong>
Analysis by local government area – Queensl<strong>and</strong>Commercial <strong>Buildings</strong>light Industrial <strong>Buildings</strong>Queensl<strong>and</strong>No. of Commercial <strong>Buildings</strong>300250200150100500Gold CoastMore<strong>to</strong>n BayFraser CoastTownsvilleMackayBundabergLowerUpperSunshine CoastFigure 30: Potential risk <strong>to</strong> commercial buildings in Queensl<strong>and</strong>from the combined impact of inundation <strong>and</strong> shoreline recession bylocal government area for a 1.1 metre sea level rise scenario.No. of Light Industrial <strong>Buildings</strong>6005004003002001000MackayMore<strong>to</strong>n BayLowerUpperBrisbaneGold CoastTownsvilleBundabergRockhamp<strong>to</strong>nFraser CoastSunshine CoastWhitsundayFigure 31: Potential risk <strong>to</strong> light industry in Queensl<strong>and</strong> from thecombined impact of inundation <strong>and</strong> shoreline recession by localgovernment area for a 1.1 metre sea level rise scenario.Commercial buildings in the local government areas ofGold Coast (between 166 <strong>and</strong> 243), More<strong>to</strong>n Bay (between155 <strong>and</strong> 226) <strong>and</strong> Fraser Coast (between 167 <strong>and</strong> 213) maybe affected by a 1.1 metre sea level rise (high end scenariofor 2100). The number of exposed commercial buildings inTownsville (between 117 <strong>and</strong> 199) <strong>and</strong> Mackay (between95 <strong>and</strong> 193) is also high compared <strong>to</strong> other local governmentareas in Queensl<strong>and</strong>. The graph shows the locationof nearly 90% of the potentially affected commercialbuildings in Queensl<strong>and</strong>, as identified in this analysis.RoadsBetween 336 <strong>and</strong> 502 light industrial buildings in the localgovernment area of Mackay may be affected by a 1.1 metresea level rise (high end scenario for 2100). The numberof exposed buildings in More<strong>to</strong>n Bay (between 156 <strong>and</strong>250) <strong>and</strong> Brisbane (between 160 <strong>and</strong> 247) is also highcompared <strong>to</strong> other local government areas in Queensl<strong>and</strong>.The graph shows the location of more than 95% ofthe potentially affected light industrial buildings inQueensl<strong>and</strong>, as identified in this analysis.RailLength (km)500450400350300250200150100500MackayFraser CoastLowerUpperGold CoastRockhamp<strong>to</strong>nMore<strong>to</strong>n BayBurdekinBundabergTownsvilleCarpentariaSunshine CoastFigure 32: Potential risk <strong>to</strong> roads in Queensl<strong>and</strong> from the combinedimpact of inundation <strong>and</strong> shoreline recession by local governmentarea for a 1.1 metre sea level rise scenario.Length (km)120100806040200LowerUpperBurdekinMackayBundabergRockhamp<strong>to</strong>nWhitsundaySunshine CoastTownsvilleIsaacCairnsHinchinbrookFigure 33: Potential risk <strong>to</strong> rail in Queensl<strong>and</strong> from the combinedimpact of inundation <strong>and</strong> shoreline recession by local governmentarea for a 1.1 metre sea level rise scenario.Roads in the local government areas of Mackay <strong>and</strong> Fraser Coast (between 352 <strong>and</strong> 475 km at risk in each area),Gold Coast (between 301 <strong>and</strong> 408 km), <strong>and</strong> Rockhamp<strong>to</strong>n (between 305 <strong>and</strong> 395 km) have a significant exposurewith a sea level rise of 1.1 metres (high end scenario for 2100). Burdekin has the greatest length of rail exposed,with between 78 <strong>and</strong> 104 km of rail line at risk. Between 33 <strong>and</strong> 69 km of rail lines in the local governmentareas of Mackay, Bundaberg, Rockhamp<strong>to</strong>n <strong>and</strong> Whitsunday are also exposed. The graphs show the locationof more than 90% of the potentially affected roads <strong>and</strong> nearly 90% of the potentially affected rail in Queensl<strong>and</strong>,as identified in this analysis.16 <strong>Climate</strong> <strong>Change</strong> <strong>Risks</strong> <strong>to</strong> <strong>Coastal</strong> <strong>Buildings</strong> <strong>and</strong> <strong>Infrastructure</strong>