1 Quiz Practice Questions 7 (Attendance 14) for Statistics 514 ...
1 Quiz Practice Questions 7 (Attendance 14) for Statistics 514 ...
1 Quiz Practice Questions 7 (Attendance 14) for Statistics 514 ...

Create successful ePaper yourself
Turn your PDF publications into a flip-book with our unique Google optimized e-Paper software.
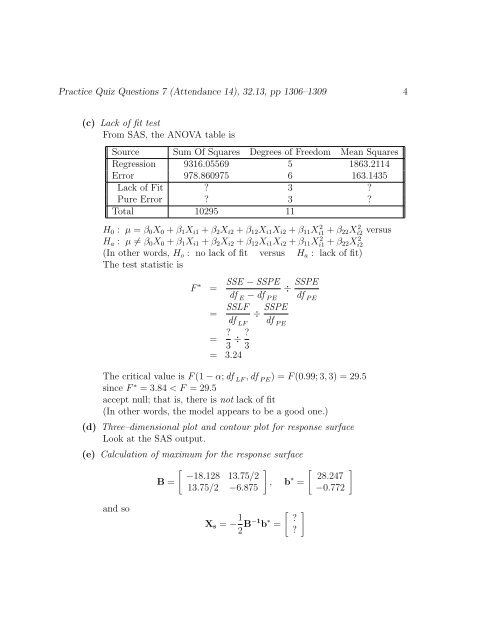
<strong>Practice</strong> <strong>Quiz</strong> <strong>Questions</strong> 7 (<strong>Attendance</strong> <strong>14</strong>), 32.13, pp 1306–1309 4(c) Lack of fit testFrom SAS, the ANOVA table isSource Sum Of Squares Degrees of Freedom Mean SquaresRegression 9316.05569 5 1863.21<strong>14</strong>Error 978.860975 6 163.<strong>14</strong>35Lack of Fit ? 3 ?Pure Error ? 3 ?Total 10295 11H 0 : µ = β 0 X 0 + β 1 X i1 + β 2 X i2 + β 12 X i1 X i2 + β 11 Xi1 2 + β 22 Xi2 2 versusH a : µ ≠ β 0 X 0 + β 1 X i1 + β 2 X i2 + β 12 X i1 X i2 + β 11 Xi1 2 + β 22 Xi22(In other words, H o : no lack of fit versus H a : lack of fit)The test statistic isF ∗ =SSE − SSPEdf E − df P E÷ SSPEdf P E= SSLFdf LF= ? 3 ÷ ? 3= 3.24÷ SSPEdf P EThe critical value is F (1 − α; df LF , df P E ) = F (0.99; 3, 3) = 29.5since F ∗ = 3.84 < F = 29.5accept null; that is, there is not lack of fit(In other words, the model appears to be a good one.)(d) Three–dimensional plot and contour plot <strong>for</strong> response surfaceLook at the SAS output.(e) Calculation of maximum <strong>for</strong> the response surfaceB =[−18.128 13.75/213.75/2 −6.875], b ∗ =[28.247−0.772]and soX s = − 1 [?2 B−1 b ∗ =?]