A Probability Distribution and Its Uses in Fitting Data
A Probability Distribution and Its Uses in Fitting Data
A Probability Distribution and Its Uses in Fitting Data

Create successful ePaper yourself
Turn your PDF publications into a flip-book with our unique Google optimized e-Paper software.
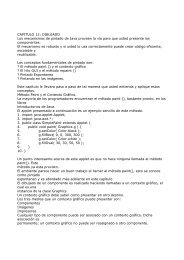
A PROBABILITY DISTRIBUTION AND ITS USES IN FITTING DATA2051.00.75III: approximation us<strong>in</strong>g tabledparameter valuesII: approximation with X3 = 0Cnz0.50.25-1.0 0.0 1.0 2.0 3.0 4.0 5.0 6.0XFIGURE 2e. Two densities with approximately the same first four moments as the exponentialdistribution.whereA = 1/(1 + A)-,/3 = (C- 3AB + 2A3)/A23,4, = (D - 4AC + 6A2B -1/(1 + X4),B = 1/(1 + 2X3)+ 1/(1 + 2A4)- 2j(1 + A3, 1 + A4),C = 1/(1 + 3A3)- 3/(1 + 23X, 1 + A4)3A')/24,+ 3/(1 + A3, 1 + 2A) - 1/(1 + 3X4),D = 1/(1 + 4X3)-4/(1+ 6/(1 + 2A3, I + 2X4)+ 3A3, 1 + X,)- 4f(1 + A3, 1 + 3A4) + 1/(1 + 4X4).The skewness <strong>and</strong> kurtosis, as given by<strong>and</strong>a3 =a4 =a3/a3A4/0'4,are functions of A3 <strong>and</strong> A4, but do not depend upon XA<strong>and</strong> X2.3. PARAMETER ESTIMATION ANDDISTRIBUTION FITTING(4)(5)In this section we show how to determ<strong>in</strong>e the parametersof the distribution us<strong>in</strong>g the first four moments<strong>and</strong> how to fit the result<strong>in</strong>g distribution. <strong>Its</strong>hould be recognized that sample moments are sensitiveto extreme observations <strong>and</strong> that the sampl<strong>in</strong>gvariability of the third <strong>and</strong> fourth moments can belarge. (See, for example, Dudewicz, Johnson <strong>and</strong>Ramberg [4].) However, we elected to use momentsbecause of their widespread use <strong>in</strong> practice; for someproperties of moments, see pp. 174ff of [2].The values of XA, A2, ,A <strong>and</strong> 34 are given <strong>in</strong> Table 4for selected values of a3 <strong>and</strong> a4 with Au = 0 <strong>and</strong> a = 1.(The construction <strong>and</strong> accuracy of this table is discussed<strong>in</strong> Section 4.) If the values of u, a, as <strong>and</strong> a4are known, the lambda values are determ<strong>in</strong>ed fromTable 4 us<strong>in</strong>g as entry po<strong>in</strong>ts the a3 <strong>and</strong> a4 values.One simply picks the values of A3 <strong>and</strong> A4 <strong>in</strong> Table 4 forwhich the a3 <strong>and</strong> a4 are closest to the desired values.If a3 is negative, one uses its absolute value, <strong>and</strong> afterf<strong>in</strong>d<strong>in</strong>g the values of 3, <strong>and</strong> A4, <strong>in</strong>terchanges theirvalues <strong>and</strong> changes the sign of A1. (The density with askewness of -a3 is the mirror image of the densitywith a skewness of a3.)S<strong>in</strong>ce the XA <strong>and</strong> A2 values given <strong>in</strong> Table 4 are for avariate with a mean of zero <strong>and</strong> a variance of one,multiply<strong>in</strong>g the result<strong>in</strong>g variate by a <strong>and</strong> add<strong>in</strong>g ,u toit achieves the desired result. This reduces to comput<strong>in</strong>gTABLE I-Lambda values for Figure 2 densities (see Table 4 fordef<strong>in</strong>ition of + <strong>and</strong> $ symbols).a3 Ia40 1.750 90.2 1.800.3 1.850.5 4X1 X2 3.5943 1.4501 1.4501.1974 .1349.0262 .01480 -.0870 - .04430 -.3203 -.1359.1349.0148-.0443-.1359.166 .5901 1.7680 1.1773.246 .5852 1.934-.290 .0604 .0259-.886 .1333 .01931.062.0447.1588-.379 -.0562 -.0187 -.0388-.215 -.2356 -.0844 -.1249.007 -.1081+ -.0407$ -.1076+-.0580+ 0 -.0580+TECHNOMETRICS ?, VOL. 21, NO. 2, MAY 1979