Volume 1 Volume 1 - Commonwealth Games Federation
Volume 1 Volume 1 - Commonwealth Games Federation
Volume 1 Volume 1 - Commonwealth Games Federation
You also want an ePaper? Increase the reach of your titles
YUMPU automatically turns print PDFs into web optimized ePapers that Google loves.
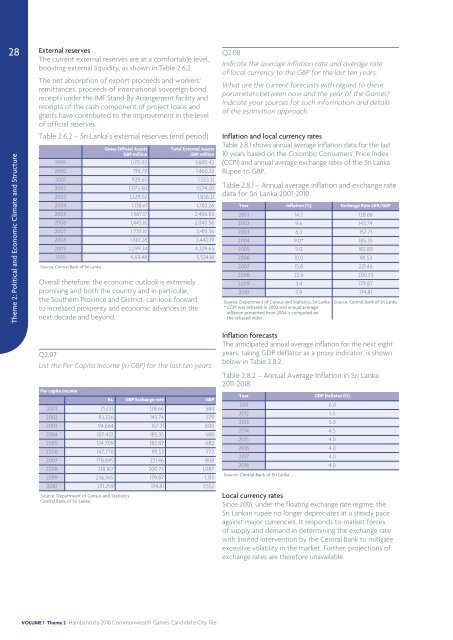
28 External reservesThe current external reserves are at a comfortable level,boosting external liquidity, as shown in Table 2.6.2.The net absorption of export proceeds and workers’remittances, proceeds of international sovereign bond,receipts under the IMF Stand-By Arrangement facility andreceipts of the cash component of project loans andgrants have contributed to the improvement in the levelof official reserves.Table 2.6.2 – Sri Lanka’s external reserves (end period)Theme 2: Political and Economic Climate and StructureGross Official AssetsGBP millionTotal External AssetsGBP million1999 1,015.92 1,600.422000 718.79 1,460.322001 928.65 1,553.312002 1,072.60 1,574.202003 1,329.02 1,836.312004 1,138.61 1,783.262005 1,567.17 2,406.922006 1,445.16 2,040.562007 1,735.10 2,451.362008 1,610.28 2,440.192009 3,299.34 4,329.652010 4,611.48 5,524.16Source: Central Bank of Sri LankaOverall therefore, the economic outlook is extremelypromising and both the country and in particular,the Southern Province and District, can look forwardto increased prosperity and economic advances in thenext decade and beyond.Q2.08Indicate the average inflation rate and average rateof local currency to the GBP for the last ten years.What are the current forecasts with regard to theseparameters between now and the year of the <strong>Games</strong>?Indicate your sources for such information and detailsof the estimation approach.Inflation and local currency ratesTable 2.8.1 shows annual average inflation data for the last10 years based on the Colombo Consumers’ Price Index(CCPI) and annual average exchange rates of the Sri LankaRupee to GBP.Table 2.8.1 – Annual average inflation and exchange ratedata for Sri Lanka 2001-2010Year Inflation (%) Exchange Rate LKR/GBP2001 14.2 128.662002 9.6 143.742003 6.3 157.712004 9.0* 185.352005 11.0 182.892006 10.0 191.532007 15.8 221.462008 22.6 200.732009 3.4 179.872010 5.9 174.81Source: Department of Census and Statistics, Sri Lanka Source: Central Bank of Sri Lanka* CCPI was rebased in 2002 and annual averageinflation presented from 2004 is computed onthe rebased index.Q2.07List the Per Capita Income (in GBP) for the last ten years.Per capita incomeRs. GBP Exchange rate GBP2001 75,133 128.66 5842002 83,226 143.74 5792003 94,664 157.71 6002004 107,432 185.35 5802005 124,709 182.87 6822006 147,776 191.53 7722007 178,845 221.46 8082008 218,167 200.73 1,0872009 236,445 179.87 1,3152010 271,259 174.81 1,552Source: Department of Census and StatisticsCentral Bank of Sri LankaInflation forecastsThe anticipated annual average inflation for the next eightyears, taking GDP deflator as a proxy indicator, is shownbelow in Table 2.8.2.Table 2.8.2 – Annual Average Inflation in Sri Lanka2011-2018Year GDP Deflator (%)2011 6.02012 5.52013 5.02014 4.52015 4.02016 4.02017 4.02018 4.0Source: Central Bank of Sri LankaLocal currency ratesSince 2001, under the floating exchange rate regime, theSri Lankan rupee no longer depreciates at a steady paceagainst major currencies. It responds to market forcesof supply and demand in determining the exchange ratewith limited intervention by the Central Bank to mitigateexcessive volatility in the market. Further, projections ofexchange rates are therefore unavailable.VOLUME 1 Theme 2 Hambantota 2018 <strong>Commonwealth</strong> <strong>Games</strong> Candidate City File


