SUUNTO t6c RUNNING GUIDE
SUUNTO t6c RUNNING GUIDE
SUUNTO t6c RUNNING GUIDE

You also want an ePaper? Increase the reach of your titles
YUMPU automatically turns print PDFs into web optimized ePapers that Google loves.
1.2.3.4.5.6.7.INTRODUCTION .............................................................................................. 4HOW TO USE THIS <strong>GUIDE</strong> ............................................................................ 6HOW TO3.1. Get Started................................................................................................ 73.2. Set Activity class and Max performance capability by Level ofactivity, Activity time and running performance over 1500 m,5000 m, 10000 m, half marathon and a marathon ......................................... 133.3. Set Activity class and Max performance capability by Level ofactivity, Activity time and a Cooper running test ........................................... 183.4. Use the Automatic Updating of Activity Class and TrainingEffect levels function ................................................................................. 213.5. Use the Training Effect Calculator ............................................................... 22UNDERSTANDING THE TRAINING MANAGER GRAPHS ............................ 23WHAT DOES IT ALL MEAN? .......................................................................... 285.1. General Guidelines .................................................................................... 285.2. A running example.................................................................................... 315.3. Training Effect 5........................................................................................ 365.4. How do I know if I am improving or declining? ........................................... 385.5. Should I improve all the time? ................................................................... 405.6. Other Tests For Runners ............................................................................ 42GLOSSARY6.1. How does the Suunto <strong>t6c</strong> work? ................................................................ 446.2. How easy is it to collect the data? ............................................................... 446.3. How accurate is the Suunto <strong>t6c</strong> analysis? ..................................................... 456.4. Heart Rate Variability ................................................................................ 466.5. Excess Post-Exercise Oxygen Consumption (EPOC) ........................................ 476.6. Training Effect and Recovery Time .............................................................. 486.7. Oxygen consumption ................................................................................ 526.8. Respiratory and Ventilation Rate ................................................................ 536.9. Vital Capacity ........................................................................................... 536.10. Resting Heart Rate..................................................................................... 536.11. Maximum Heart Rate ................................................................................ 53References ................................................................................................... 543
NOTE: If you change your Activity class atany point do not forget to click ‘Calculatetraining effect levels’ so that the correct UserEPOC levels are displayed.You have now set the initial personal information.The software will use this information to analyzeevery running session you download. Remember, thecalculated values are only estimates and may result inan incorrect Training Effect and overall performanceanalysis.It is therefore important to establish your ownindividual Personal settings.your maximum heart rate and of course with trainingyou should improve. When you retest or do maximumintensity sessions watch for a new values.‘Max respiration rate’ and ‘Max ventilation’ arebackground calculations which the software willautomatically update from your training sessions.If you have had a lung function test enter your actual‘Vital capacity’.You also need to enter your personal settings intoyour Suunto <strong>t6c</strong> in the PERSONAL mode. Many of thecalculations use these settings, so it is important thatyou are as accurate as possible when defining the valuesrequired.Measure your resting heart rate and enter thecorrect value into the ‘Rest HR’ box. If you know yourmaximum heart rate enter the correct value into the‘Max HR’ box.You can establish some of your Personal settings byusing running performance (Section 3.2) or a Cooperrunning test (Section 3.3).Also remember to amend the personal information asit changes – your resting heart rate may go down asyou get fitter and the tests may not have brought out9
time and average heart rate needed for the desiredphysiological training effect.IMPORTANT NOTE - At this early stage it isimportant to understand how to set yourLevel of activity (Activity class) and howthe software allocates a Max performancecapabilityRead the descriptions of the Activity classes in Table3.1a carefully and choose the level that adequatelydescribes your current Level of activity. The Activityclass range is 0 – 10 with 0 equating to a sedentarylifestyle through to Activity class 9.5 to 10 describedas ‘World or International Class’. Activity classes7.5 to 10 are intended for experienced enduranceathletes so be careful in your choice of Activity class.If you have allocated an Activity class in the 0-7range Max performance capability (METs) will becalculated from your age, height and weight. In theendurance athlete Activity classes 7.5 to 10 eachlevel has an automatic software Max performancecapability (METs) as shown below.Male and Female Software Activity class and Max performance capability (METs)Activity class(male)Max performancecapability (METs)Activity class(female)Max performancecapability (METs)7.588.599.51017.418.619.720.92223.17.588.599.51015.716.91819.120.321.4Using the automatic software settings may producea mismatch between the Activity class and Maxperformance capability (METs). In addition age, sex andheritage might limit your VO2max despite very hardtraining.Normally the more active you are the fitter you may beand harder exercise is needed to reach any particularTraining Effect/EPOC level. It is logical therefore to setthe Activity class and Training Effect/EPOC levels basedon weekly training hours (Activity time) – Table 3.1a andto personalise your Max performance capability (METs)by running performance or Cooper running test (seesections 3.2-3.3).The duration of a training session required toreach a particular Training Effect is limited byyour Activity class and the session heart rate– section 5.1 includes tables 5a and 5b whichdetail the maximum duration in minutes and% of maximum heart rate range applicable toeach Activity class and Training Effect Level.Study these tables carefully to make sure you are trainingwithin the correct durations and intensities for yourActivity class.However, if you don’t want to use running performanceor one of the tests to establish your settings you cansimply identify your Activity class by its description anduse the function in the software which monitors youractivity level and automatically updates the Activityclass as necessary. The Activity class will change eitherupwards or downwards, depending on whether youtrain more or less in relation to your current Activityclass (see section 3.4).11
Suunto Running GuideTable 3.1a Activity classes 0-10Activity Description Activity time Activity ClassNo regular participation in recreationalsports or heavy physical activityNo regular participation inrecreational sports or heavyphysical activityRegular participation in recreation or workrequiring modest physical activity, such as yardwork, Nordic walking or moderate intensityrunningRegular participation in recreation or workrequiring modest physical activity, such as yardwork, Nordic walking or moderate intensityrunningRegular participation in heavy physical exercise,such as running, aerobic classes or high intensityrunningAlways avoid exertion wherever possibleWalk for pleasure, routinely use stairs,occasionally exercise sufficient to causeheavy breathing or perspiration10-60 minutes per weekOver 1 hour per weekLess than 30 minutes per week01234Regular participation in recreation or workrequiring modest physical activity, such as yardwork, Nordic walking or moderate intensityrunning30-60 minutes per week5Regular participation in recreation or workrequiring modest physical activity, such as yardwork, Nordic walking or moderate intensityrunning1-3 hours per week6Regular participation in recreation or workrequiring modest physical activity, such as yardwork, Nordic walking or moderate intensityrunningOver 3 hours per week7Endurance athlete (Club/Regional level)Endurance athlete (Club/Regional level)Endurance athlete (National level)Endurance athlete (National level)Endurance athlete (International level)Endurance athlete (International level)5-7 hours per week7-9 hours per week9-11 hours per week11-13 hours per week13-15 hours per weekMore than 15 hours per week7.588.599.51012
3.2 Set Activity class and Max performancecapability by Level of activity, Activity timeand running performance over 1500 m,5000 m, 10000 m, half marathon and amarathonTo use this method you need to know twothings:_The number of hours you train per week(Activity time)_Your time over 1500 m or 5000 m or 10000 mor half marathon or a full marathonEndurance athletes in Activity classes 7.5-10 can setActivity class and Max performance capability (METs) bycomparing 1500 m, 5000 m, 10,000 m, half marathon ormarathon time shown in table 3.2a and 3.2b below andadjusting by Level of activity or weekly training hours(Activity time) using Table 3.1a.A male runner with a 5000 m personal best time of16:50 (Table 3.2a) would have a Max performancecapability of 17.4 METs equal to the software Activityclass of 7.5. However weekly training hours (Activitytime) may be 9-11 hours per week which would convertto an Activity class of 8.5 (Table 3.1a).Table 3.2a - Male – Activity class software allocation by running performance (mins:secs)– Activity class 7.5-10ActivityclassMETS1500m5000m10000mHalf MarathonMarathon7.588.599.51017.418.619.720.92223.14:354:154:053:503:403:3516:5015:5515:1014:2513:4513:1034:5533:0031:2529:5528:4027:3077:0073:0070:0066:0063:0061:00161:00153:00145:00138:00132:00127:00A female runner with a 10000 m personal best timeof 36:00 (Table 3.2b) would have a Max performancecapability of 16.9 METs equal to the software Activityclass of 8. However weekly training hours (Activity time)may be 11-13 hours per week which would convert toan Activity class of 9 (Table 3.1a).Table 3.2b - Female – Activity class software allocation by running performance (mins:secs)– Activity class 7.5-10ActivityclassMETS1500m5000m10000mHalf MarathonMarathon7.588.599.51015.716.918.019.120.321.45:054:454:304:154:053:3518:3517:3516:3515:3515:0014:4038:3036:0034:0032:3031:0030:0085:0080:0076:0072:0069:0067:00175:00165:00160:00155:00150:00140:0013
Suunto Running GuideThe software generated Max performance capability forActivity classes 7.5 to 10 may not reflect your runningperformance precisely. You can personalise your settingby using the running performance Tables 3.2c (male)and 3.2d (females).Select the distance and your individual time and readoff the Max performance capability value then enterthis figure in the Max performance capability box in thePersonal settings.Using the automatic software settings may producea mismatch between the Activity class and Maxperformance capability (METs). In addition age, sex andheritage might limit your VO2max despite very hardtraining.It is logical therefore to set the Activity class and EPOClevel (Training Effect) based on weekly training hours(Activity time) – Table 3.1a and to personalise your Maxperformance capability (METs) by running performanceusing Tables 3.2c (male) or 3.2d (female).If your running performance gives you anActivity class of 7.5-10 by METs you shoulduse this setting even if your Activity time islower. If your Activity time produces a higherActivity class do not increase it by more than2 classes above its normal valueThe allocation of Activity class by running performancebecomes more complex for Activity classes 0 -7 as Maxperformance capability (METs) will be calculated fromyour age, height and weight in addition to the Activityclass you initially enter.To overcome this problem simply use Tables 3.2c (male)and Table 3.2d (females) to identify Max performancecapability and Table 3.1a to assess Activity class by yourLevel of activity or weekly training hours (Activity time).NOTEIF YOU USE ACTIVITY TIME TO CALCULATEYOUR ACTIVITY CLASS AND <strong>RUNNING</strong>PERFORMANCE TO SET MAX PERFORMANCECAPABILITY YOU SHOULD DISABLE THEAUTOMATIC UPDATE FUNCTIONYOU CAN DISABLE AND ENABLE AUTOMATICUPDATES IN THE ‘PERSONAL’ ‘EDIT’ MENUREMEMBER TO REVIEW YOUR SETTINGSAT REGULAR INTERVALS TO ENSURE THEYREFLECT CURRENT ACTIVITY TIME AND MAXPERFORMANCE CAPABILITY14
Table 3.2c Male Running Performance (mins:secs)METS VO2max Distanceml/kg 1500 5000 10000 HM M5.5 19.25 12:30 44:00 91:30 200 4006 21 11:30 41:00 86:00 190 3806.5 22.75 10:45 38:45 80:30 175 3607 24.5 10:10 36:15 75:00 165 3407.5 26.25 09:30 34:15 71:30 160 3208 28 09:00 32:30 67:30 150 3058.5 29.75 08:35 31:00 64:15 140 2909 31.5 08:10 29:30 61:15 135 2809.5 33.25 07:45 28:15 58:30 130 27010 35 07:25 27:00 56:00 125 26010.5 36.75 07:05 26:00 53:45 120 25011 38.5 06:50 25:00 51:45 115 24011.5 40.25 06:35 24:00 49:45 110 23012 42 06:20 23:00 48:00 105 22012.5 43.75 06:05 22:15 46:15 105 21513 45.5 05:50 21:30 44:45 100 20513.5 47.25 05:40 21:00 43:15 95 20014 49 05:30 20:15 42:00 95 19514.5 50.75 05:20 19:45 40:45 90 19015 52.5 05:10 19:15 39:45 90 18515.5 54.25 05:00 18:30 38:30 85 18016 56 04:55 18:00 37:30 85 17516.5 57.75 04:45 17:35 36:30 80 17017 59.5 04:35 17:10 35:30 80 16517.5 61.25 04:30 16:45 34:45 77 16018 63 04:25 16:20 34:00 75 15718.5 64.75 04:20 15:55 33:15 73 15319 66.5 04:10 15:35 32:30 72 15019.5 68.25 04:05 15:15 31:45 70 14620 70 04:00 14:55 31:00 68 14420.5 71.75 03:55 14:35 30:30 67 14021 73.5 03:50 14:20 29:45 66 13721.5 75.3 03:45 14:00 29:15 64 13522 77.0 03:40 13:45 28:30 63 13222.5 78.8 03:37 13:30 28:00 62 13023 80.5 03:33 13:15 27:30 61 12823.5 82.3 03:29 13:00 27:00 60 12524 84.0 03:26 12:45 26:30 59 12315
Suunto Running GuideTable 3.2d Female Running Performance (mins:secs)16METS VO2max Distanceml/kg 1500 5000 10000 HM M5.5 19.25 12:30 44:00 91:30 200 4006 21 11:30 41:00 86:00 190 3806.5 22.75 10:45 38:45 80:30 175 3607 24.5 10:10 36:15 75:00 165 3407.5 26.25 09:30 34:15 71:30 160 3208 28 09:00 32:30 67:30 150 3058.5 29.75 08:35 31:00 64:15 140 2909 31.5 08:10 29:30 61:15 135 2809.5 33.25 07:45 28:15 58:30 130 27010 35 07:25 27:00 56:00 125 26010.5 36.75 07:05 26:00 53:45 120 25011 38.5 06:50 25:00 51:45 115 24011.5 40.25 06:35 24:00 49:45 110 23012 42 06:20 23:00 48:00 105 22012.5 43.75 06:05 22:15 46:15 105 21513 45.5 05:50 21:30 44:45 100 20513.5 47.25 05:40 21:00 43:15 95 20014 49 05:30 20:15 42:00 95 19514.5 50.75 05:20 19:45 40:45 90 19015 52.5 05:10 19:15 39:45 90 18515.5 54.25 05:00 18:30 38:30 85 18016 56 04:55 18:00 37:30 85 17516.5 57.75 04:45 17:35 36:30 80 17017 59.5 04:35 17:10 35:30 80 16517.5 61.25 04:30 16:45 34:45 77 16018 63 04:25 16:20 34:00 75 15718.5 64.75 04:20 15:55 33:15 73 15319 66.5 04:10 15:35 32:30 72 15019.5 68.25 04:05 15:15 31:45 70 14620 70 04:00 14:55 31:00 68 14420.5 71.75 03:55 14:35 30:30 67 14021 73.5 03:50 14:20 29:45 66 137
Suunto Running Guide3.3 Set Activity class and Max performancecapability by Level of activity, Activity timeand a Cooper running testTo use this method you need to know twothings:_The number of hours you train per week(Activity time)_The distance you can run in 12 minutesThe Cooper running test is very easy to do. It is a 12minute running test which can be repeated at regularintervals to check your endurance level and Personalsettings.Select a running course which is flat and which you canmeasure to within 10 m. It is easiest to do this test on arunning track. Run at an even pace for 12 minutes andrecord the distance.Record the test on your watch and download into thesoftware – note the maximum heart rate and enter thisfigure in the ‘Max HR’ box in the Personal settings. Thismay not be your absolute maximum, if in doubt use thesoftware calculated value.You can then use Table 3.1a to look up your Activityclass by Level of activity or weekly training hours(Activity Time) and Table 3.3b to work out your Maxperformance capability (METS).If you want to calculate exact figures that match metresrun in the 12 minutes the formulas are (only valid for1600 m or more):It is unlikely that anyone running under1600 m should enter an Activity time greaterthan Activity class 7Men: MET = 0.005 x metresVO2max = 0.0175 x metresWomen: MET = 0.00514 x metresVO2max = 0.018 x metres(Leger, Mercier 1984)If you run less than 1600 m use the Activity Classdescriptions to set Activity Class and allow the softwareto calculate your Max performance capability usingActivity class, age, height, weight and gender. Makesure in this case that you have enabled ‘Update activityclass automatically’, ‘Update personal parametersautomatically’ and ‘Confirm automatic update ofactivity class’.Endurance athletes in Activity classes 7.5-10 can setActivity class and Max performance capability (METs)by comparing their Cooper running test result shownin table 3.3a below and adjusting by Level of activity orweekly training hours (Activity time) using Table 3.1a.A male runner with a Cooper running test of 3720 m(Table 3.3a) would have a Max performance capabilityof 18.6 METs equal to the software Activity class of 8.However Activity time (training hours) may be 9-11hours per week which would convert to an Activity classof 8.5 (Table 3.1a).A female runner with a Cooper running test of 3290 m(Table 3.3a) would have a Max performance capabilityof 16.9 METs equal to the software Activity class of 8.However Activity time (training hours) may be 11-13hours per week which would convert to an Activity classof 9 (Table 3.1a).18
Table 3.3a - Male and Female Software Cooper Running Test distance, Activity class and Maxperformance capability (METs) – Activity class 7.5-10Cooper TestDistance(male)Activityclass(male)Maxperformancecapability (METs)Cooper TestDistance(female)Activityclass(female)Maxperformancecapability (METs)3480372039404180440046207.588.599.51017.418.619.720.92223.13050329035003720395041607.588.599.51015.716.91819.120.321.4The software generated Max performance capabilityfor Activity classes 7.5 to 10 may not reflect your Cooperrunning test result precisely. You can personalise yoursetting by using the formulas above or Table 3.3b. Selectthe distance achieved, read off the Max performancecapability value and enter this figure in the Maxperformance capability box in the Personal settings.Using the automatic software settings may producea mismatch between the Activity class and Maxperformance capability (METs). In addition age, sex andheritage might limit your VO2max despite very hardtraining.It is logical therefore to set the Activity class and EPOClevel (Training Effect) based on weekly training hours(Activity time) - Table 3.1a and to personalise your Maxperformance capability (METs) by Cooper running testresult using Table 3.3b.NOTEIF YOU USE ACTIVITY TIME TO CALCULATEYOUR ACTIVITY CLASS AND A COOPER<strong>RUNNING</strong> TEST TO SET MAX PERFORMANCECAPABILITY YOU SHOULD DISABLE THEAUTOMATIC UPDATE FUNCTIONYOU CAN DISABLE AND ENABLE AUTOMATICUPDATES IN THE ‘PERSONAL’ ‘EDIT’ MENUREMEMBER TO REVIEW YOUR SETTINGSAT REGULAR INTERVALS TO ENSURE THEYREFLECT CURRENT ACTIVITY TIME AND MAXPERFORMANCE CAPABILITYIf your Cooper running test gives you anActivity class of 7.5-10 you should use thissetting even if your Activity time is lower. Ifyour Activity time produces a higher Activityclass do not increase it by more than 2 classesabove its normal valueThe allocation of Activity class using a Cooper runningtest becomes more complex for Activity classes 0 -7 asMax performance capability (METs) will be calculatedfrom your age, height and weight in addition to theActivity class you initially enter.To overcome this problem simply use Table 3.3b toidentify Max performance capability and Table 3.1a toassess your Activity class by Level of activity or weeklytraining hours (Activity Time).19
Suunto Running GuideTable 3.3b Cooper running testCooper test MaleCooper test FemaleMETS VO2max Distance METS VO2max Distanceml/kgml/kg8 28.0 1600 8 28.0 15608.5 29.8 1700 8.5 29.8 16509 31.5 1800 9 31.5 17509.5 33.3 1900 9.5 33.3 185010 35.0 2000 10 35.0 195010.5 36.8 2100 10.5 36.8 204011 38.5 2200 11 38.5 214011.5 40.3 2300 11.5 40.3 224012 42.0 2400 12 42.0 234012.5 43.8 2500 12.5 43.8 243013 45.5 2600 13 45.5 253013.5 47.3 2700 13.5 47.3 263014 49.0 2800 14 49.0 272014.5 50.8 2900 14.5 50.8 282015 52.5 3000 15 52.5 292015.5 54.3 3100 15.5 54.3 302016 56.0 3200 16 56.0 311016.5 57.8 3300 16.5 57.8 321017 59.5 3400 17 59.5 331017.5 61.3 3500 17.5 61.3 341018 63.0 3600 18 63.0 350018.5 64.8 3700 18.5 64.8 360019 66.5 3800 19 66.5 370019.5 68.3 3900 19.5 68.3 379020 70.0 4000 20 70.0 389020.5 71.8 4100 20.5 71.8 399021 73.5 4200 21 73.5 409021.5 75.3 4300 21.5 75.3 418022 77.0 4400 22 77.0 428022.5 78.8 450023 80.5 460023.5 82.3 470024 84.0 480020
3.4 Use the Automatic Updating of ActivityClass and Training Effect Levels functionThe Suunto <strong>t6c</strong> Training Manager Software has afunction which monitors your activity level andautomatically updates the Activity class as necessary. TheActivity class will change either upwards or downwards,depending on whether you train more or less in relationto your current Activity class.The Activity class can change, at most, one class perweek. The update is affected by the number of trainingsessions during the last month and the EPOC valuesreached in those training sessions. Increasing the Activityclass requires training that is regular and includessufficiently high EPOC values. When the software isused for the first time, the automatic updates will workwhen a minimum of one week’s worth of logs has beencollected.The program analyses your training from the logs thathave been transferred to it, and, based on this, updatesthe Activity class and, at the same time, personalparameters such as the Max performance capability(METs) value.The Activity class influences the personal Training Effectlimits and therefore the Training Effect calculated froma training session based on the EPOC value. Takingcare that the Activity class is correct is therefore veryimportant when using the program as a training tool.Setting the Activity class to match yourmaximum performance capabilityEnter the Activity class that best describes you. If theMax performance capability calculated based on theActivity class differs from a known value, you may haveover or underestimated your Activity class. You canraise your Max performance capability by increasingthe Activity class, and correspondingly lower it bydecreasing the Activity class. Adjust the Activity classso that it matches your measured Max performancecapability.Update Activity class automatically_The program will automatically update theActivity class if it has changed when comparedto the current Activity class stored in the program(your performance has improved/deteriorated)_A changed Activity class will also update theMax performance capability (METs) value inthe personal parameters if ‘Update personalparameters automatically’ is selected in the‘Settings’ menu_If you want to retain a certain Activity class,disable this selectionUpdate Personal parameters automatically_The program will automatically update themax performance capability (METs) value inthe personal parameters, when the Activityclass changes_If you know your values in more detail andwish to use them, disable this selectionConfirm automatic update of Activity class_The program will ask for a confirmation beforeupdating the Activity class after the logshave been transferred, if the class has changed_Confirmation will only be requested if the‘Update activity class automatically’selection is enabledUnless you have personal calculations of Activity timeand Max performance capability it may be easiest tohave both ‘Update activity class automatically’ and‘Update personal parameters automatically’ selectionsenabled. The software then calculates checks and, ifnecessary, updates values, automatically analyzing thedevelopment of your performance.Remember that the relation between the MET valuesand maximum oxygen consumption used in theprogram is METs = VO2max / 3.5. Sections 3.2-3.3describe test and tables to help calculate your VO2maxalthough in practical terms unless you have a laboratorymeasured value you should always use the softwarecalculation.21
Suunto Running Guide3.5 Use the Training Effect CalculatorYou can use the Training Effect Calculator (in the Actionsmenu) to estimate how the duration, intensity (by heartrate) and EPOC value of a running session are related.You can lock the duration, average heart rate or EPOCvalue to get the desired effect. By modifying any oneof the values you can plan a running session that meetsyour objective.For instance if you set a certain EPOC value to achieve adesired Training Effect the calculator will show you theaverage heart rate and duration required.This is important as you can now manipulatethe training variables to create the trainingeffect required rather than looking atduration, intensity and training effectseparatelyThe Training Effect Calculator’s theoretical trainingsession assumes the running session is completelyeven paced/even HR and continuous which of courseis never the case in practice. The EPOC value given bythe calculator may therefore differ from the actualtraining result. Because EPOC increases faster at a highheart rate than at low heart rate the measured EPOC isusually slightly higher than the value suggested by thecalculator.22
4. Understanding the Training Manager GraphsDownloading a recorded training session is reasonablysimple – see the Quick Guide and User Manual for detailsof how to do this. The software automatically analyzesthe data for you as it downloads.The screen view you see when a session has been analyzedand the ‘Graph’ mode has been selected, is ‘Details 1’.23
Suunto Running GuideThe ‘Details 1’ and ‘Details 2’ screens show the heartrate and other body parameters results for the session.The main graph is your heart rate and the TrainingEffect/EPOC development.Click on ‘Edit’ and use the drop down menu to enter‘Running’ as the ‘Activity’. You can also enter a ‘Feeling’number 1 for Bad through to 5 for Excellent, the day’s‘Resting HR’, ‘Weight’ and ‘Distance’ run. In the ‘Notes’box type in details of the session for future reference –try to use this box every time for session details so thatyou can go back and repeat a session using the samesettings.If you click on ‘Data’ you will see your session data every2 or 10 seconds (see User Manual for details of how toset your watch).24
The data is shown in graphical form in the top partof the screen. The software automatically shows ‘HR’and ‘EPOC’ (Training Effect) graphs. You can showother graphs by clicking the appropriate buttonsat the top of the screen in the ‘Graph’ mode. Youcan display graphs for Oxygen Consumption (VO2),Ventilation (VE), Respiration rate (RespR) and R - RIntervals.You can also overlay graphs for different sessions byhighlighting the first session then hold down ‘Ctrl’on your keyboard and highlight the other sessionsto be compared. Click on ‘Graph’ to see the sessionscompared.25
Suunto Running GuideFor any one log you can check that your Personalinformation is correct by selecting ‘Actions’ on themenu bar and ‘Reanalyze’ – if incorrect amend wherenecessary and ‘Reanalyze’.Following an analysis you may see a dialog boxwhich asks ‘Do you want to update the activity classautomatically’. If you are using automatic updateclick ‘Yes’. Be aware that if you say ‘Yes’ the softwarewill amend your Activity Class (and therefore EPOC/Training Effect levels) and your Max performancecapability. If you have personalised these valuesdisable the automatic update facility.26
Suunto Running Guide5. What does it all mean?A reminder_Training Effect is created from a combination of duration and intensity. The level of TrainingEffect indicates the time period needed for recovery before the next training session_Training Effect levels should therefore also be considered in the context of Recovery TimeRemember also the relationship between the Training Effect level an recovery period:Training EffectRecovery time in hours/days1-2 Minor/Maintaining 3 hours to 1 day2-3 Maintaining/Improving 1 to 2 days3-4 Improving/Highly Improving 1 to 4 days4-5 Highly Improving/Over-reaching 2 to 7 days5 Over-reaching 7 days +5.1 General Guidelines_It is important to note that the numerical TrainingEffect values do not mean that a workoutwith a lower numerical value is somehow worseor less significant than a workout witha high value. Both are needed in balancedtraining._Highly trained and younger runners may recovermore quickly than untrained and older runners_The effectiveness of training in terms ofphysiological adaptation, fatigue, and thereforethe need for rest and recovery is duration andintensity dependent._High-intensity training is by its nature short induration and low-intensity training is longerduration._A shorter session at high intensity can produce thesame effect as a long session at low intensity.This does not mean that you can always use theshortest duration and highest intensity toachieve your training goals._The duration and intensity of a session willdepend on the specific physiological benefits youare trying to achieve. In particular do not ignorethe useful benefits that come with low intensitylonger duration sessions._The maximum time (duration) you are able tospend at each Training Effect level depends onthe Activity class and the intensity of the sessionas a % of maximum heart rate HR, as shown inTables 5a and 5b._Exceeding the duration and/or intensity for anysession will increase the Training Effect andrecovery time._Tables 5a and 5b are generic tables. Duration,intensity and recovery will vary from runner torunner. They will depend on training status, ageand other physiological and psychologicalfactors in addition to being event specific –obviously durations and intensities will bedifferent for a 1500 m runner compared to amarathon or indeed ultra distance runner.28
Suunto Running GuideTable 5a Maximum Training time (duration) in minutes for each Training Effect level by Activity classActivityclass012345677.588.599.510Level 1-1.91010151520253545606060606060Level 2-2.91520253045606075759090120120120Level 3-3.9101020303045456060759090120120Level 4-4.91010152025303045456060607575Level 51010101515202025253035354545Table 5 b % of maximum heart rate by Training Effect LevelTraining Effect% of max heart rate1-1.955-602-2.961-703-3.971-804-4.981-90590+Example:A runner with an Activity class of 8 running for up to75 minutes at 71-80% of maximum heart rate wouldachieve a Training Effect of 3-3.9 indicating a recoveryperiod of 1 to 4 days – 75 minutes at 71% of maximumheart rate would be near to level 3 whilst 75 minutes at80% of maximum heart rate would be closer to 3.9Level 8 Duration-Intensity-RecoveryDuration = up to 75 minutes, Intensity71-80%, Recovery 1-4 daysLevel 3 Duration-Intensity-RecoveryDuration = up to 30 minutes, Intensity71-80%, Recovery 1-4 daysThis is an important concept to understandrunning further than your Activity classallows will significantly increase the TrainingEffect and Recovery period and may result ininjury, illness or the risk of over trainingA runner with an Activity class of 3 running for up to 30minutes at 71-80% of maximum heart rate would alsoachieve a Training Effect of 3-3.9 indicating a recoveryperiod of 1 to 4 days – 30 minutes at 71% of maximumheart rate would be near to level 3 whilst 30 minutes at80% of maximum heart rate would be closer to 3.930
5.2 A running exampleThis female runner/triathlete is an established welltrained athlete and was tested by the author toestablish Personal settings and the duration andintensity (by heart rate) profile shown below:Activity time 11-13 hours per week = Activity class 9Duration (mins)Training Effect% of max heart rateHeart rate (bpm)Pace mins: secs per kmkph601-1.955-62.589-10010:50-7:305.5-81202-2.962.5-69100-1107:30-6:208-9.5903-3.969-78110-1256:20-5:139.5-11.5604-4.978-88125-1415:13-4:0911.5-14.535588+141-1604:09-3:3214.5-17Training comprised 9 sessions per week, 3 runs inaddition to 3 cycling and 3 swim sessions. Periodisationwas by increasing/decreasing duration and/or increasing/decreasing intensity on a four week cycle. Weeks 1 and4 were ‘light’ weeks, with weeks 2 and 3 increasing induration/intensity.This was the first 4 week phase of a preparation trainingprogram – instruction was to run each session as evenpaced as possible and as close to the HR value. Each runwas separated by 48 hours within each week and 72hours between weeks although, cycling and swimmingin between plus 1 full day off per week to meet therecovery requirements.The aim was to train at mid Improving Training Effectthrough to mid Highly Improving Training Effect for thisperiod.WeekSession 1Training EffectSession 2Training EffectSession 3Training Effect160’@ HR 1253.545’@ HR 1414.560’@ HR 1253.5260’@ HR 1253.545’@ HR 1414.570’@ HR 1253.5360’@ HR 125-133450’@ HR 1414.575’@ HR 1254460’@ HR 1253.545’@ HR 1414.560’@ HR 125-133431
Suunto Running GuideWeek 1 result – Training Effects 3.6, 4.6 and 3.2 – note the even HR and discipline by the athlete.Average HRs of 125, 141 and 124Week 2 result – Training Effects 3.5, 4.5 and 3.5 again note the even HR and discipline by the athlete.Average HRs of 125, 140 and 12532
Week 3 result – Training Effects 4, 4.8 and 4.1 once again note the even HR and discipline by the athlete. AverageHRs of 129, 140 and 131 – Training Effect on session 2 was a little high as we approach the duration limit (60’for this HR – Table 14 Activity class 9 Level 4-4.9) and heart rate was a little high on session 3 (129 against sessionrequirement of 125)Week 4 result – Training Effects 4, 4.3 and 3.4 – in this final week again note the even HR and discipline of theathlete. Average HRs of 130, 138 and 12333
Suunto Running GuideTraining Effect 2.7 - Average HR 113Training Effect 2.7 - Average HR 11934
During a recovery week run sessions were 45 mins and60 mins respectively at HR of 110-118 and 118 to keepTE in the 1 and 2 levels.NOTE: A Training Effect level of 2-2.9 forthis athlete is 120 minutes at HR of 100-110.As these sessions were of shorter durationthe intensity was increased to generate therequired Training Effect.Comment from the athlete after recovery sessions:‘Hardest week yet in terms of mental effort. Sufficeto say that my body feels great’The hardest task for runners to achieve isrunning slowly for effective recovery35
Suunto Running Guide5.3 Training Effect 5Training Effect level 5 is described as ‘over-reaching’. Ithas a recovery period of 7 days plus. Training in level 5should be a rarity reserved for mock race pace sessionsfollowed by a suitable recovery period or Training Effectlevel 1 and 2 recovery runs.Level 5 training is not a weekly occurrenceYou should only see significant level 5 Training Effectduring a race. It is important to understand the lengthof recovery that is needed following a race effort.Consider the half marathon chart below – this is a maleActivity class 8 runner with a maximum heart rate of188. Average heart rate for the race was 163, 87% ofmaximum with a peak at 176, and 94% of maximum.Based on Table 5a and 5b we know that theoreticallyhe could spend up to 60 minutes before Training Effectreaches 4.9 at 90% of maximum heart rate. At the60 minute point during this race HR was at 88% ofmaximum and he had crossed into Training Effect level 5.EPOC continued to rise with another 37 minutes spentin level 5. Recovery following this effort is not measuredin the 7 day category but in weeks – about 4-8 weeks.To aid recovery post half marathon training should be inTraining Effect levels 1 up to 2.9.Half marathon36
Another example from the same runner over a 10k race.Significantly he was at 95% of maximum heart rate inthe first 10 minutes before reducing pace and heart rateslightly. Average heart rate was 172, 91% of maximumwith peak heart rate at 178, 95% of maximum.Again by looking at Tables 5a and 5b we know thattheoretically he could spend between 30 and 60minutes before Training Effect reaches level 5 at 90%of maximum heart rate. At the 40 minute point duringthis race HR was at 92% of maximum and he had justcrossed into Training Effect level 5.As he was only in level 5 for 2.5 minutes recovery time isreasonably short and should occur within 2-7 days.10k road race37
Suunto Running Guide5.4 How do I know if I am improving ordeclining?General GuidelinesThe best way to train using Training Effect is by runningat even heart rate over a set time or distance trackingprogress from improvement or deterioration in paceor time. It is important not to misinterpret the data –you must expect day to day variation in pace, distancecovered, heart rate and Training Effect. What you arelooking for is a trend – a period of improvement ordeterioration.Small fluctuations in pace or distance covered arenormal. For some sessions – AND THIS IS IMPORTANT– pace or distance covered is unimportant. If runninga Training Effect level 1 or 2 recovery session it is theTraining Effect that is paramount.The signsThere are a number of key signs that indicateimprovement or deterioration:Improvement_Increasing pace or distance covered for thesame Training Effect_Reducing Training Effect for the same pace ordistanceDeterioration• _Reducing pace or distance for the sameTraining Effect• _Increasing Training Effect for the same pace ordistanceThe +/- 0.2 Training Effect RuleIf the intention of a session is a Training Effect of 3.5 arange of 3.3 to 3.7 is acceptable. However if every runof 3.5 comes out at 3.7 then you need to reduce eitherduration or intensity to get the correct Training Effect.Similarly if they all come out at 3.3 then you need toincrease the duration or intensity to get the correctbalance. Use this +/- 0.2 rule for all sessions.Re-testRepeat the Cooper test running test at regular intervalsto confirm the software settings and to monitor yourtraining progress (at least once every 3 months). Ifrunning 1500m to marathon time trials or races use yourrunning time to review performance.Under recoveryUnder recovery is the main reason why runners underperform or deteriorate. The traditional view has been‘if it’s not ‘hard’ it hasn’t done any good’. Continual‘hard’ training leads to under recovery, illness, injury,over training and under performance. A good trainingprogram balances duration, intensity and recoveryto maximise physiological adaptation and raceperformance.Automatic update facilityIf using the automatic update facility the software willautomatically prompt you if an up date is needed – ifthis involves reducing the Activity class you should usethis an as opportunity to review both your settings andtraining programme. A recommended reduction inActivity class may simply mean that you have entered aninsufficient number of training hours (Activity time).Heat/Cold/HumidityDon’t misinterpret sessions in extreme environmentalconditions. Heat and/or high humidity in particular willhave a marked influence on your performance. Heartrate will be elevated significantly and pace or distancewill be reduced. Do not take this as an indication ofdeterioration – adapt your running session to theconditions.IllnessTraining whilst ill is not recommended. Sometimesdeterioration in performance is a precursor to illness- STOP TRAINING – You will recover quicker with rest.When you restart ease back into training with someTraining Effect level 1 & 2 runs.Rest and RecoveryYou can only train as hard as you can restRest is good. If you feel tired you probably are tired.Recovery between sessions is not all about the duration,intensity and Training Effect of your running sessions.Recovery is influenced by many other factors. Simpleinfluences may be diet, hydration and sleep. Morecomplex issues concern work and family stress.You need to be aware of the influence of yourindividual lifestyle on your recovery. If it is clear that38
you not over training then look at lifestyle issues forthe cause of any deterioration. If you are in a periodof heavy work or family stress reduce the number oftraining sessions and both the duration and intensity ofthe sessions.A maximum of 3 sessions per week with a full 24 hoursbetween each one is recommended. A Training Effectnot exceeding level 2 (1-1.9) should be sufficient tomaintain fitness in the short term and help managerecovery and reduce stress.The Training Effect level 2 RuleIn periods of illness, injury or stress never exceedTraining Effect level 2 (1-1.9) for any session. UsingTable 5a this will limit exercise to 15 minutes forActivity class level 0 runners up to 60 minutes forActivity class level 10 runners. This is a short termrule only. 3 sessions per week at this TrainingEffect level is insufficient Activity time to maintaina high Activity class so if recovery is prolonged areassessment of Activity class may be necessary.39
Suunto Running Guide5.5 Should I improve all the time?The simple answer is NO. There are limits and it isimportant to know your limits to get the most out ofyour training and to prevent over training. There arethree questions to consider:_Have you reached your physiological limits?_Are you fighting age decline?_Is your training ineffective?Physiological LimitsNot everyone can be a top athlete, so much depends ongenetics. It is true that you can improve aspects of bodycomposition, strength, endurance and maximal oxygenuptake but only so far.For example if you are a male 5000 m runner with apersonal best of 16:50 (Activity class 7.5, METs 17.4 =VO2max of 60.9 ml/kg) and have been training for anumber of years it is unrealistic to expect to improvethat time to 14:25 (Activity class 9, METs 20.9 = VO2max73.2 ml/kg). However it may still be possible to geta significant improvement with the correct level ofduration-intensity-recovery training.Untrained individuals may be able to improve theirVO2max by as much as 25% with training whereasexperienced runners improvement may only be 2-3%.Manage your expectations to get the best out of yourtraining and the use of Training Effect to monitortraining sessions.Age declineThe science of aging predicts a gradual decline in thebody’s ability to function as we get older. The precisemechanisms underlying the aging process are not fullyunderstood, but the rate of decline in the generalpopulation of biological and physiological functions isknown to be progressive and age related.The reduction in exercise capacity in older individualsstems from a decrease in muscle mass, cardiovascularfunction and respiratory function. One age-relatedalteration to respiratory function is decreasedrespiratory muscle strength and endurance and declinein respiratory muscle strength may lead to breathlessnessduring activities of daily living and exercise.General evidence_Biological and physical peak is reachedbetween ages 20-35_During middle age 35-45 physical activityusually declines with a 5-10kg accumulation ofbody fat_In later middle age (45-65) women reachmenopause and men reduce substantially theiroutput of sex hormones. The decline in physicalcondition continues and may accelerate_Early old age (65-75) modest increase inphysical activity following retirement butby middle old age (75-85) many people havedeveloped some physical disability and in veryold age, (over 85) totally dependency may set in_Typical expectation is 8-10 years of partialdisability and a year of total dependencyPhysiological evidence_Maximum heart rate declines with age_Maximal oxygen uptake (VO2max) decreases by10% per decade in men and women regardlessof age and exercise activity although otherstudies have shown no decline in aerobiccapacity during a 10 year period in peoplemaintaining constant training_Factors other than physical activity are alsocrucial to the decline of maximal oxygenuptake – heredity, increase in fat, decrease inskeletal muscle massHowever, it’s not all bad news; several studies haveshown that for athletes the decrease in maximumheart rate from age 50-70 is smaller than non-athletes.Additionally exercise training for older people mayincrease aerobic capacity to the same relative extent(15-30%) as in younger adults.Indeed, the endurance performance of older athletesprovides good evidence of the benefits of maintainingregular exercise to preserve cardiovascular function.The overall conclusion is that exercise training improvesphysiologic response at any age and improvementsoften occur at a rate and magnitude independent of aperson’s age.A key point for older runners is to remember that theolder body needs more recovery time than the youngerbody.The following panel summarises the general and specificage related evidence for biological and physiologicaldecline.40
Effective TrainingA common mistake is to always train at high intensityand long duration. This tends to develop ‘one pacerunning’ usually characterised by a gradual decline inperformance over time. Such runners tend to have ahigh propensity to illness and over training (usuallyundiagnosed).By reducing the duration and intensity of training andallowing sufficient recovery there may be significantshort term improvement even for older athletes simplybecause training is more effective. In general ‘more isless’ and ‘less is more’.If you find that your Training Effect is mostly in levels4-4.9 and over into 5 you are most certainly overtraining and under recovering. The majority of yourtraining should be in levels 1-3.9 with fewer sessions inlevel 4-4.9 and rare excursions into level 5.If I don’t see improvement why use TrainingEffect to monitor my training?It depends on your definition of improvement. Whenyou first start using Training Effect you may seesignificant improvement in the time or distance for thesame heart rate and Training Effect.After a while the time, distance, heart rate and TrainingEffect will plateau into consistency i.e. minimal variationin any of the parameters. This is because there areinvisible improvements (physiological adaptation)happening. These improvements may take months oreven years to develop. Building base endurance is thekey to running faster at the higher intensities.By using Training Effect to monitor your training youcan manage your expectations, track each session forthe correct level of duration-intensity-recovery, preventillness and over training and make your running all themore enjoyable.Summary_Set realistic goals within the framework ofyour own physiology and performance_Be aware of aging and adjust expectations andthe volume of training accordingly – rememberan older body needs more recovery time than ayounger one_Develop an effective training program, onethat balances duration-intensity-recovery41
Suunto Running Guide5.6 Other Tests for RunnersDepending on facilities available there are a numberof more specific tests that runners can undertakerecord on their <strong>t6c</strong> and send to Fletcher Sport Sciencefor analysis by their specialist analysis software. Thesetests produce reasonably accurate Personal settingsfor use with the Training manager Software or offerRecovery status updates.Remember that tests are a means of collecting dataupon which subsequent performance evaluations anddecisions are made but in any analysis there are manyfactors that may influence the results. Additionally alltests have their limitations and care must be used inthe interpretation of the results.Walk TestFor those just starting out it may be better to do atwo-kilometer walk test to establish a base fitness test.As fitness improves a retest using the Cooper test (seesection 3.3) or one of the more specific running testsshown below can be carried out.Sub maximal TestsIf you are a recreational runner or just staring out it isnot advisable to do a maximal heart rate test – a submaximal test, as the name suggests does not take youto maximum heart rate but collects sufficient data forreasonable assumptions to be made your fitness leveland correct Personal settings. There are a numberof appropriate sub maximal test which depend onindividual circumstances. Email Fletcher Sport Sciencefor details.Maximal TestsMaximal tests as the name suggests take you to yourmaximum heart rate. They should only be attemptedby experienced and competitive runners. As withsub maximal tests there are a number of appropriatemaximal tests that can be carried out – two tests thatare appropriate for HRV analysis are the 20 metreshuttle running test and the Conconi test.The 20 metre shuttle running test is made up of anumber of Levels where each Level lasts approximatelyone minute. Each Level comprises a series of 20mshuttles where the starting speed is 8.5km/hr andincreases by 0.5km/hr at each Level. Many gyms andfitness centres have facilities to carry out this test. Thetest was developed by Leger, L.A. & Lambert, J. (1982).The Conconi test (Conconi et al, 1982) is a simplemethod for measuring the approximate values ofan individual’s maximum, anaerobic and aerobicthreshold rates. Whilst this test has its flaws it isexcellent for extracting reasonably accurate Personalsettings.In a Conconi test the runner increases their speedevery 200 metres and the heart rate and time, at each200 metre point, are recorded by the <strong>t6c</strong>. This gradualincrease in speed every 200 metres is maintained untilthe runner is unable to maintain the pace. Startingpace is usually 8.0kph with the speed increasing every200 metres by 0.5kph – it is best conducted on a flattreadmill for accurate speed control.Overnight Recovery TestsThere are many benefits to measuring recovery:_Detect early signs of overtraining or illness• _Optimize training load by finding thebalance between training load and recovery• _Evidence based support for critical coachingdecisions_Record individual reference values e.g.during off-season when the body isrecovered• _Check the recovery status during hardtraining periods• _Check recovery status when subjectivefeelings and fitness level indicates poorrecovery_Make sure that the body is recoveredsufficiently before a new hard trainingperiodThe heart responds automatically and immediately toany increase or decrease in stress level. This heart rateresponse can be used to manage and mitigate the riskof over training, under recovery, illness or injury, to thebody.By monitoring the influence of psychological stress andphysiological workload it is possible to use an analysisof heart rate to monitor overnight recovery and tomoderate the duration and intensity of training tomatch the extent of recovery.A recovery analysis simply needs an overnight sleeprecording on the <strong>t6c</strong> with a minimum of the first 4hours of sleep recorded.Contact www.fletchersportscience.co.uk,info@fletchersportscience.co.uk for test prices and fulldetails.42
Suunto Running Guide6. GLOSSARY6.1 How does the Suunto <strong>t6c</strong> work?The human heart is a wonderful barometer ofthe overall physiological and psychological stressexperienced by the body. The heart is a muscle, it getstired and like any other muscle requires time to recoverif optimum training and race performance is to bemaintained.The heart responds automatically and immediately toan increase in stress and physical workload. This heartrate response can be used to assess Training Effect, therisk of over training, under recovery, illness or injury tothe body.By monitoring the overall psychological andphysiological stress it is possible to use an analysis ofheart rate to moderate the duration and intensity oftraining and to balance the need for recovery.Tracking Training Effect and Recovery needs only onephysiological signal – beat-by-beat heart rate data (theR-R interval) which is collected by your Suunto <strong>t6c</strong>.Although the data collection procedure is simple, theanalysis methodology produces accurate Training Effectand Recovery information.Under resting conditions, healthy athletes show aperiodic variation in the R-R interval. This rhythmicfluctuation is caused by breathing. Heart rate increaseswhilst inhaling and decreases when exhaling.By accurately measuring the time interval betweenheartbeats (known as Heart Rate Variability) it ispossible to use the detected variation in time tomeasure the psychological and physiological stressand fatigue on the body. Generally speaking the morerelaxed and free from fatigue the body is, the morevariable the time between heartbeats.Increased Heart Rate Variability is linked to good health;decreased Heart Rate Variability is linked to stress orfatigue.6.2 How easy is it to collect the data?Very easy, simply wear a Suunto <strong>t6c</strong> or Suunto MemoryBelt during your training sessions and download thedata into the Suunto Training Manager Software fordetailed analysis.44
6.3 How accurate is the Suunto <strong>t6c</strong> analysisACCURACY OF <strong>SUUNTO</strong> <strong>t6c</strong> PHYSIOLOGICAL MEASUREMENT VALUESMeasuredvariableBreathing frequencyOxygen ConsumptionVentilationEnergy ConsumptionEPOC PEAKUnit1/minml/kg/minl/minkcal/minml/kgTypicalValue20-3020-4530-758-1740-150Averageerror± 1.3± 1.5± 6.8± 0.5± 10.7Accuracy Accuracy8/1093% 96%88% 91%86% 1 88% 189% 91%93% 2 93% 21: When ventilation > 30 l/min. 2: Relative accuracy for an individual person.Accuracy 8/10 means accuracy for eight people out of ten.Example: An average-sized male trains for 45 minutes. Suunto Training Manager displays a total energyconsumption of 540 kcal. Calculated from this, the margin of error for the energy consumption is ±0.5 kcal/min*45 min = ±22.5 kcal = ±4.1%.45
Suunto Running Guide6.4 Heart Rate VariabilityThe Suunto <strong>t6c</strong> accurately measures the time intervalbetween heartbeats (known as the R-R interval) usingthe detected variation to measure the psychological andphysiological stress and fatigue on your body.R-R intervalRPTQSThis variation in the time intervals is measured inmilliseconds. When you put your body under a trainingload the Heart Rate Variability becomes more uniform.The Training Manager Software uses this variation tocalculate information about your body during trainingto a high degree of accuracy.Your Heart Rate Variability data represents the overallfatigue of your body due to current and prior trainingsessions, hydration levels, stress, performance anxiety ornervousness or other external stressful influences.The Training Manager Software is able to identifyand quantify your fatigue so that you can begin tounderstand the reasons for your running performance.This will enable you to adjust or periodise your trainingprogramme more effectively.You may recover from a running session rapidly (shortterm fatigue) but carry accumulated (long term) fatiguefrom running session to running session. This long termfatigue builds up over time and is one reason whyyou need a periodised training programme that hasbuilt in recovery sessions. When comparing sessionsusing the Suunto <strong>t6c</strong> you will be able to see how muchaccumulated fatigue is influencing each session bylooking at the difference in fatigue readings.46
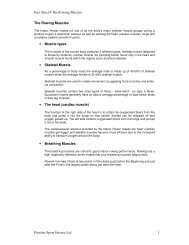
6.5 Excess Post-Exercise Oxygen Consumption(EPOC)The measure of this ‘fatigue’ or physiological trainingload is known as EPOC – Excess Post-Exercise OxygenConsumption and is calculated from your Heart RateVariability data. Simply defined EPOC is the amountof oxygen your body needs to recover after a runningsession and is measured in millilitres of oxygen perkilogram of body weight (ml/kg).EPOC is most useful to describe the stress caused to yourbody, especially to the respiratory and cardiovascularsystem from an endurance activity like running. Duringa run your body consumes more oxygen than at rest.The higher the intensity of your training, the greaterthe fatigue and consumption of oxygen becomes duringand immediately after your running session.Simply put, as EPOC rises fatigue increases and thelonger it takes to recover.EPOC accumulates faster with high intensity trainingbut not necessarily when you increase the duration. Lowintensity running may not result in a high EPOC valueeven if the duration of the training is exceptionallylong. With high intensity running you can reach a highEPOC value even in a short period of time.The effect of training duration and intensity (%VO2max) on EPOC accumulation250225200175100% VO 2max 90% VO 2max 80% VO 2max70% VO 2maxEPOC (ml/kg)150125100755025060% VO 2max50% VO 2max40% VO 2max30% VO 2max5 10 15 20 25 30 35 40 45 50 55 60Time (minutes)To recap, EPOC is the physiological load or ‘fatigue’ caused by training and is used to determine the individualTraining Effect of each running session.47
Suunto Running Guide6.6 Training Effect and Recovery TimeEPOC is a measure of the Training Effect of your runningsession. The Training Manager Software provides youwith data to measure the Training Effect of a runningsession based on its duration and intensity.EPOC is given a numerical value (e.g. 159 ml/kg – millilitres per kilogram of body weight). Thesoftware relates the EPOC value to your own personalphysiological data from which it calculates the TrainingEffect Level for each running session.Training Effect Level is an objective measure of theeffect of your running session – was the session ofsufficient level to maintain or improve your fitness.The software divides the Training Effect into five levels:Training Effect (TE)1MinorTraining EffectInterpretationThis workout advances recuperation, and with a longer duration (of over one hour) improvesbasic endurance. Does not significantly improve aerobic performance.2345MaintainingTraining EffectTraining EffectImprovingTraining EffectOver-reachingTraining EffectThis workout maintains aerobic performance. It builds a foundation for a better respiratory andcardiovascular condition and higher intensity training in the future.This workout improves aerobic performance if repeated 2 to 4 times per week. Training at thislevel does not yet place special recuirements for recuperation.This workout, repeat 1 to 2 times per week, highly improves aerobic performance. In order toachieve optimal development, it requires 2 to 3 recuperative workouts (TE 1-2) per week.This workout has extremely high effect on aerobic performance, but only if followed by asufficient recuperation period. This workout has an extremely highexertion level and should not be performed often.48
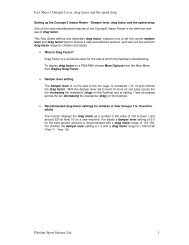
The divisions of these levels are shown as EPOC valuesand are individualised dependent upon your fitnesslevel and prior training history. So for a novice runneran EPOC value that indicates a highly improving levelmay only be a recovery level for a more experiencedrunner.CORRECT TRAINING LOAD ENSURES OPTIMAL PROGRESSEPOC250225200175150TRAINING TOO HARDToo hard to current shapeRisk of overtrainingNeed to adjust trainingOPTIMAL TRAINING LOAD AREAImproving training effectNo need to change the trainingmethodsOptimaltrainingload areaTargetedtrainingprogress125100Trainingsession755025TRAINING TOO EASYWhen getting into bettershape, training loadshould increase to createimproving training effect.Need to adjust training00 2 4 6 8 10 12 14 16 18 20 22 TIME (Weeks)49
Suunto Running GuideIt is important to recognise that TrainingEffect is also an indication of the Rest andRecovery period needed before the nexttraining session_Well timed rest is one of the most importantfactors of your trainingThe effectiveness of a training session can benegligible or even detrimental if you do notinclude sufficient rest and recovery andperiodisation into your training programme._Your body needs time for recovery after a singlehigh intensity session or a hard training period ofseveraldays or even after a low intensity butlong running sessionWithout rest your body’s adaptation to thetraining stimulus will not occur. In the worstcase training will lead to exhaustion and a stateof overstress otherwise known as overtraining orunder recovery._Training Effect displays the general exertion levelof your trainingIf your EPOC value is often in the highlyimproving or over reaching level (levels 4 and 5)the risk of illness, injury or overtraining increases.The diagram below illustrates the Training Effect causedby five training sessions with different levels of intensity.The training sessions correspond to Training Effect levels1 to 5. During training, Training Effect level temporarilydecreases but begins to rise during recovery. Aftera certain amount of time performance rises abovethe pre-training level because the body is preparingto handle the next training stimulus better thanbefore.EXERTION, RECOVERY AND TRAINING EFFECTPerformanceStartingLevelTraining1-2 days0,5-1 days3h-1 day11-4 days2-7 daysTraining Effect (1-5)Time23Recovery4Exertion550
If your body does not receive the next training stimuluswithin a certain period of time the achieved TrainingEffect begins to slowly decrease. However, if the nexthigh intensity session is held BEFORE your body hasrecovered from the previous one the Training Effectwill remain lower than it would have been after fullrecovery.Continuous hard training with insufficient recovery willslowly lead to lower performance and a long term stateof overtraining. When over trained even a long periodof recovery may not be enough to return performanceto the original level.Training Effect levels should also beconsidered in the context of Recovery TimeScale of Recovery Time(Depends on the time spent at each level):Training Effect1-22-33-44-55Recovery time in hours/days3 hours to 1 day1 to 2 days1 to 4 days2 to 7 days7 days +It should be noted that Training Effect measuresthe cardiovascular effects of training – it does notmeasure neuromuscular fatigue or muscle sorenessand stiffness. Whilst training sessions in TrainingEffect levels 3 and 4 will promote race specificneuromuscular adaptations Training Effect is not adirect measure of the neuromuscular fatigue. Whenconsidering your recovery needs and planning thebalance of your training program these additionalrecovery issues need to be included.Neuromuscular fatigue can be defined as ‘fatiguerepresenting the decline in muscle tension capacitywith repeated stimulation’. Commonly thismanifests itself in an inability to achieve a submaximal or maximal exercise or training response.The exact causes of neuromuscular fatigue areunclear.Muscle and stiffness can persist for several hourswhereas muscle soreness (DOMS – delayed-onsetmuscle soreness) can appear later and last for anumber of days. There are a number of directcauses of DOMS such as minute tears in muscle tissueand overstretching.Neuromuscular fatigue and muscle soreness andstiffness extend the recovery period required beforethe body is ready for the next training session.Longer more sustainable running may leave you lessexhausted but will cause more total fatigue resulting ina higher EPOC value.EPOC values correlate strongly with the lactic acid levelof your body although for long-endurance training thecorrelation is not as strong. As a general rule a highTraining Effect (4-5) can only be reached in training thatalso causes high lactate. Base endurance training withlow lactate also has low Training Effect (1-2).Some of your running sessions will be interval trainingrather than continuous running where periods of highheart rates are followed by recovery periods. If theintervals are long and the recovery periods are shortEPOC may reach a sufficiently high level to give you aTraining Effect level.However, for short intervals even with short recoveryperiods your EPOC may not accumulate sufficientlyto calculate a realistic Training Effect. Heart rate mayrise to high levels but differs from runner to runner.The objective measures which can be used to assessthe intensity of these shorter sessions are OxygenConsumption, Respiration and Ventilation Rate.51
Suunto Running Guide6.7 Oxygen ConsumptionHeart rate indicates the transfer of blood and oxygento muscles. Oxygen consumption indicates how themuscles use the oxygen for work. Oxygen consumptionincreases in a more linear manner as exertion increasesand is considered to be the most reliable variable toestimate running intensity.%VO 2max< 30% – daily physical activities, very lightaerobic training< 50% – light to moderate pace, basicendurance training< 75% – moderate to hard pace, hardendurance training> 75% – very hard, VO 2max trainingOxygen consumption (VO2 ml/kg/min – millilitresper kilogram of body weight per minute) is directlydependent on the amount of work your body does.Maximum oxygen uptake (VO2max) is a personal value,affected by your training history and genes and forrunning is measured in millilitres per kg of body weight(ml/kg).A common misconception is that maximum oxygenuptake directly describes a runner’s performancelevel. Performance is determined by how close tothe maximum level a runner is able to maintainperformance throughout a running session and by theeconomy of the performance. Economy means howmuch of the oxygen consumed by the runner’s bodyconverts into performance.Oxygen consumption remains more or less the sameor slightly decreases for a set standard running session,while maximum oxygen consumption may increase asrunning fitness improves.The Suunto <strong>t6c</strong> estimates your MET value (metabolicequivalent) also shown as Max performance capabilityin the Training Manager Software. One METcorresponds to the oxygen consumption of a person’sbasic metabolism so the maximum performance levelin METs represents the ratio of energy and oxygenconsumption during maximum performance comparedto the consumption at rest.One MET, the oxygen consumption at rest, is 3.5 ml/kg/min – millilitres per kilogram of body weight.Based on the Training Manager Software calculatedMET value you can estimate your maximum oxygenuptake (VO2max ml/kg – millilitres per kilogram ofbody weight) by multiplying your MET value by 3.5. Ofcourse if you have had your maximum oxygen uptakemeasured you should use that value or you can estimateit from the Tables in Section 3 and enter a MET figurecloser to its real value.52
6.8 Respiratory and Ventilation RateFor every running session the Suunto <strong>t6c</strong> also calculatesRespiratory Rate – the number of breaths you take perminute (bpm) and Ventilation Rate (l/min) – the amountof air you breathe per minute in litres. Changes in thesebreathing values also indicate changes in your body’sphysiological state.As you run your muscles consume more oxygen than atrest, increasing the body’s oxygen demand. The increasein Respiratory and Ventilation Rate is non-linear whenrunning from rest to maximum intensity – the higherthe intensity the faster the increase. Respiratory andVentilation Rate can also be used as additional measuresof intensity.RESPIRATORY RATE SCALE DURING EXERCISErespirations/min< 15 rest< 20 low training intensity< 35 moderate training intensity< 50 hard training intensity> 50 very hard training intensityVENTILATION SCALE DURING EXERCISEThese values depend on body size, sex andfitness level and include ranges in thetable below.6.10 Resting heart rateResting heart rate is the lowest number of beats perminute when you are at complete rest. Resting heartrate will change as a result of regular training so this isa variable to update periodically – runners who havetrained over long periods tend to have exceptionallylow heart rates – low 50s, 40s and even into the 30s.The best way to establish your resting heart rate is tocheck first thing in the morning as soon as you wake up.Check it for a few days to get a settled reading.6.11 Maximum Heart RateMaximum heart rate is the highest possible heart rateyour heart can achieve. The software uses a formula tocalculate your maximum heart rate based on your age.However actual maximum heart rate may vary as muchas 20-30 beats from formula calculated value.The Suunto <strong>t6c</strong> Training Manager Software is extremelysensitive to maximum heart rate. It is a critical variablein the background analysis so a running specific test isthe only realistic way of assessing this value.Remember maximum heart rate tests are extremelydemanding and should only be attempted byexperienced and competitive runners. If you are aninexperienced runner you should use the softwarecalculation until you are fit enough to carry out amaximum heart rate test.l/min< 10-15 rest< 30-50 low training intensity< 60-100 moderate training intensity< 80-150 hard training intensity> 80-150 very hard training intensity6.9 Vital capacityThe Suunto <strong>t6c</strong> also estimates your Vital capacitygenerally known as forced vital capacity (FVC) whichis the total amount of air in litres that is breathed outafter completely filling the lungs. Vital capacity is usedin the calculation of the Ventilation Rate. If you havehad a recent lung function test you have the option ofpersonalising the calculation by entering your measuredvalue.53
Suunto Running Guide7. REFERENCESWhite Papers by Firstbeat Technologies Ltd.1. VO2 Estimation Method Based on Heart Ratemeasurement2. Indirect EPOC Prediction Method Based on HeartRate Measurement3. EPOC Based Training Effect Assessment4. An Energy Expenditure Estimation Method Based onHeart Rate MeasurementCopies are available fromwww.firstbeattechnologies.comScientific Sources:Pulkkinen, A., Kettunen, J., Martinmäki, K., Saalasti S., &Rusko, H.K. (2004). On- and off dynamics and respirationrate enhance the accuracy of heart rate based VO 2estimation. ACSM Congress, Indianapolis, June 2-5, 2004.Abstract: Medicine and Science in Sports and Exercise 36(5).Rusko, H.K. (Eds.) 2003. Cross Country Skiing. Handbook ofSports Medicine and Science. Massachusetts: Blackwell.Rusko, H.K., Pulkkinen, A., Saalasti, S., Hynynen, E. &Kettunen, J. 2003. Pre-prediction of EPOC: A tool formonitoring fatigue accumulation during exercise? ACSMCongress, San Francisco, May 28-31, 2003. Abstract:Medicine and Science in Sports and Exercise 35(5): Suppl:S183.Rusko, H.K., Pulkkinen, A., Martinmäki K., Saalasti S.& Kettunen, J. (2004). Influence of increased durationor intensity on training load as evaluated by EPOC andTRIPMS. ACSM Congress, Indianapolis, June 2-5, 2004.Abstract: Medicine and Science in Sports and Exercise 36(5).Saalasti, S., Kettunen, J., Pulkkinen, A. & Rusko, H. (2002).Monitoring respiratory activity in field: Applications forexercise training. Science for Success conference. Jyväskylä,October 2-4, 2002.ACSM – American College of Sports Medicine. (2001).ACSM’s Guidelines for Exercise Testing and Prescription.Philadelphia: Lippincot Williams & Wilkins.Leger, L., Mercier, D. 1984. Cross Energy Cost of HorizontalTreadmill and Track Running. Sport Medicine 1 : 270 - 277.Shvartz, E., Reibold, RC. 1990. Aerobic fitness norms formales and females aged 6 to 75 years: a review. Aviat SpaceEnviron Med 1990; 61:3-11.Oja, P., Elovainio, R., Vuori, I., Raivio, M. 1979.Kuntotestisuositus. Vammalan Kirjapaino Oy.54
_____________________________________________________________________