Inversion of magnetotelluric data for 2D structure with sharp ...
Inversion of magnetotelluric data for 2D structure with sharp ...
Inversion of magnetotelluric data for 2D structure with sharp ...

Create successful ePaper yourself
Turn your PDF publications into a flip-book with our unique Google optimized e-Paper software.
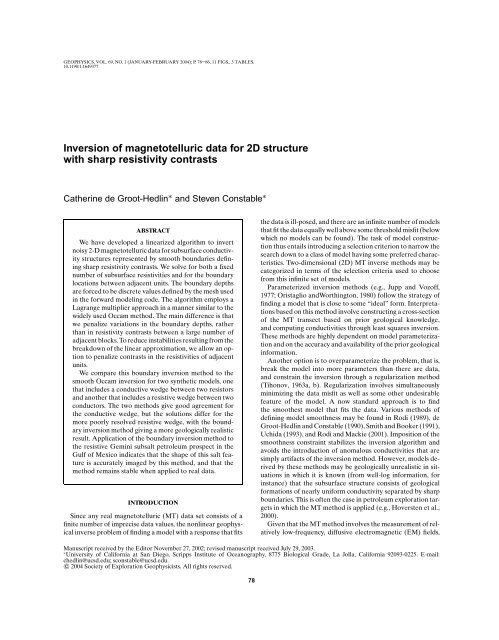
GEOPHYSICS, VOL. 69, NO. 1 (JANUARY-FEBRUARY 2004); P. 78–86, 11 FIGS., 3 TABLES.10.1190/1.1649377<strong>Inversion</strong> <strong>of</strong> <strong>magnetotelluric</strong> <strong>data</strong> <strong>for</strong> <strong>2D</strong> <strong>structure</strong><strong>with</strong> <strong>sharp</strong> resistivity contrastsCatherine de Groot-Hedlin ∗ and Steven Constable ∗ABSTRACTWe have developed a linearized algorithm to invertnoisy 2-D <strong>magnetotelluric</strong> <strong>data</strong> <strong>for</strong> subsurface conductivity<strong>structure</strong>s represented by smooth boundaries defining<strong>sharp</strong> resistivity contrasts. We solve <strong>for</strong> both a fixednumber <strong>of</strong> subsurface resistivities and <strong>for</strong> the boundarylocations between adjacent units. The boundary depthsare <strong>for</strong>ced to be discrete values defined by the mesh usedin the <strong>for</strong>ward modeling code. The algorithm employs aLagrange multiplier approach in a manner similar to thewidely used Occam method. The main difference is thatwe penalize variations in the boundary depths, ratherthan in resistivity contrasts between a large number <strong>of</strong>adjacent blocks. To reduce instabilities resulting from thebreakdown <strong>of</strong> the linear approximation, we allow an optionto penalize contrasts in the resistivities <strong>of</strong> adjacentunits.We compare this boundary inversion method to thesmooth Occam inversion <strong>for</strong> two synthetic models, onethat includes a conductive wedge between two resistorsand another that includes a resistive wedge between twoconductors. The two methods give good agreement <strong>for</strong>the conductive wedge, but the solutions differ <strong>for</strong> themore poorly resolved resistive wedge, <strong>with</strong> the boundaryinversion method giving a more geologically realisticresult. Application <strong>of</strong> the boundary inversion method tothe resistive Gemini subsalt petroleum prospect in theGulf <strong>of</strong> Mexico indicates that the shape <strong>of</strong> this salt featureis accurately imaged by this method, and that themethod remains stable when applied to real <strong>data</strong>.INTRODUCTIONSince any real <strong>magnetotelluric</strong> (MT) <strong>data</strong> set consists <strong>of</strong> afinite number <strong>of</strong> imprecise <strong>data</strong> values, the nonlinear geophysicalinverse problem <strong>of</strong> finding a model <strong>with</strong> a response that fitsthe <strong>data</strong> is ill-posed, and there are an infinite number <strong>of</strong> modelsthat fit the <strong>data</strong> equally well above some threshold misfit (belowwhich no models can be found). The task <strong>of</strong> model constructionthus entails introducing a selection criterion to narrow thesearch down to a class <strong>of</strong> model having some preferred characteristics.Two-dimensional (<strong>2D</strong>) MT inverse methods may becategorized in terms <strong>of</strong> the selection criteria used to choosefrom this infinite set <strong>of</strong> models.Parameterized inversion methods (e.g., Jupp and Voz<strong>of</strong>f,1977; Oristaglio andWorthington, 1980) follow the strategy <strong>of</strong>finding a model that is close to some “ideal” <strong>for</strong>m. Interpretationsbased on this method involve constructing a cross-section<strong>of</strong> the MT transect based on prior geological knowledge,and computing conductivities through least squares inversion.These methods are highly dependent on model parameterizationand on the accuracy and availability <strong>of</strong> the prior geologicalin<strong>for</strong>mation.Another option is to overparameterize the problem, that is,break the model into more parameters than there are <strong>data</strong>,and constrain the inversion through a regularization method(Tihonov, 1963a, b). Regularization involves simultaneouslyminimizing the <strong>data</strong> misfit as well as some other undesirablefeature <strong>of</strong> the model. A now standard approach is to findthe smoothest model that fits the <strong>data</strong>. Various methods <strong>of</strong>defining model smoothness may be found in Rodi (1989), deGroot-Hedlin and Constable (1990), Smith and Booker (1991),Uchida (1993), and Rodi and Mackie (2001). Imposition <strong>of</strong> thesmoothness constraint stabilizes the inversion algorithm andavoids the introduction <strong>of</strong> anomalous conductivities that aresimply artifacts <strong>of</strong> the inversion method. However, models derivedby these methods may be geologically unrealistic in situationsin which it is known (from well-log in<strong>for</strong>mation, <strong>for</strong>instance) that the subsurface <strong>structure</strong> consists <strong>of</strong> geological<strong>for</strong>mations <strong>of</strong> nearly uni<strong>for</strong>m conductivity separated by <strong>sharp</strong>boundaries. This is <strong>of</strong>ten the case in petroleum exploration targetsin which the MT method is applied (e.g., Hoversten et al.,2000).Given that the MT method involves the measurement <strong>of</strong> relativelylow-frequency, diffusive electromagnetic (EM) fields,Manuscript received by the Editor November 27, 2002; revised manuscript received July 29, 2003.∗University <strong>of</strong> Cali<strong>for</strong>nia at San Diego, Scripps Institute <strong>of</strong> Oceanography, 8775 Biological Grade, La Jolla, Cali<strong>for</strong>nia 92093-0225. E-mail:chedlin@ucsd.edu; sconstable@ucsd.edu.c○ 2004 Society <strong>of</strong> Exploration Geophysicists. All rights reserved.78
80 de Groot-Hedlin and ConstableThe n r × (n r + 1) matrix S rho operates only on the resistivityparameters, and is defined by⎛⎞c −c 0 0 ...S rho =0 c −c 0 ...⎜⎝ ...⎟⎠ , (3)... c −cwhere c is a constant that controls the relative weighting betweenlayer roughness and resistivity contrasts. The penaltymatrix S dep acts only on the depth parameters, and is given by⎛⎞S 1 0 ...S dep =0 S 2 0 ...⎜⎝ ...⎟⎠ , (4)... 0 S n rwhere 0 is an (n c − 1) × n c matrix <strong>of</strong> zeros and S i is the(n c − 1) × n c roughening matrix <strong>for</strong> the bottom <strong>of</strong> the ith layer,i.e.,⎛⎞1 −1 0 ...S i =0 1 −1 0 ...⎜⎝ ...⎟⎠ . (5)... 0 1 −1Thus S i differences the model depth parameters between laterallyadjacent columns in layer i.We simultaneously minimize model roughness and <strong>data</strong> misfitby finding a stationary point <strong>for</strong> the functionalU =‖Sm‖ 2 + µ −1[ ‖W(d − F[m])‖ 2 − χ 2 ∗]. (6)The trade-<strong>of</strong>f between the <strong>data</strong> misfit, given by the second term,and the model roughness is controlled by the Lagrange multiplierµ −1 . In equation (6), d represents the <strong>magnetotelluric</strong><strong>data</strong>, F[m] is a nonlinear <strong>for</strong>ward functional F acting uponthe model m to produce the model response, χ∗ 2 is the desiredlevel <strong>of</strong> fit, and W is a diagonal matrix <strong>with</strong> entries inverselyproportional to the <strong>data</strong> errors.Since the <strong>for</strong>ward functional F[m] is nonlinear <strong>with</strong> respectto perturbations in resistivity or boundary depth, we linearizeabout a starting model m i . The first two terms <strong>of</strong> the Taylorapproximation yieldF[m i + m] = F[m i ] + J i m, (7)where J i is the Jacobian matrix <strong>of</strong> partial derivatives <strong>of</strong> F[m i ]<strong>with</strong> respect to the model parameters. The stability <strong>of</strong> any linearizedinversion method is controlled largely by the accuracy<strong>of</strong> this approximation. In MT, equation (7) is a good approximation<strong>for</strong> models <strong>with</strong> limited conductivity contrasts; thus,linearized inversion methods tend to be highly robust <strong>for</strong> inversionsthat limit conductivity variability. With the large conductivitycontrasts that are characteristic <strong>of</strong> inversions <strong>for</strong> boundarylocations, this approximation becomes less accurate, andthe iterations may reach local, rather than global, minima inthe solution space. In the next two sections, we discuss methodsto avoid converging to a local minimum.We use the <strong>2D</strong> finite element code <strong>of</strong> Wannamaker et al.(1987) to derive <strong>for</strong>ward responses, and the adjoint method,described in deLugao and Wannamaker (1996), to computepartial derivatives <strong>of</strong> F[m i ] <strong>with</strong> respect to conductivity. Use <strong>of</strong>the adjoint method allows us to obtain the model sensitivities<strong>with</strong> respect to conductivity at minimal computational cost.To take advantage <strong>of</strong> the computational time saving <strong>of</strong>feredby use <strong>of</strong> the adjoint method, we use a chain rule method toconvert derivatives <strong>with</strong> respect to conductivity to derivatives<strong>with</strong> respect to depth. This is described in greater detail in theAppendix.As derived in Constable et al. (1987), the model m i+1 is givenby the stationary points <strong>of</strong> U, i.e.,m i+1 = [ µ(S T S) + (WJ i ) T (WJ i ) ] −1(WJi ) T W ˆd i , (8)where ˆd i is given by d − F[m i ] + J i m i . Note that we need S T S,not S itself. We use sparse matrix multiplication to computeS T S efficiently. Boundary depths computed from equation (8)are adjusted to the value <strong>of</strong> the nearest block boundary, asindicated in Figure 1, prior to computation <strong>of</strong> the <strong>for</strong>ward response.Given that model sensitivities <strong>with</strong> respect to depth aremuch smaller than the derivatives <strong>with</strong> respect to unit conductivity,this does not significantly alter the model responses. Ateach iteration, we vary µ to find the model which generates theminimum misfit, and use this model as the starting point in thenext iteration. If the misfit is less than χ ∗ , we increase µ to findsmoother models until the desired misfit is attained.Unlike <strong>for</strong> the Occam method (de Groot-Hedlin and Constable,1990), the starting model <strong>for</strong> this algorithm must possesssome resistivity contrasts. One reason is that our method<strong>of</strong> computing derivatives <strong>with</strong> respect to resistivity (describedin the Appendix) requires that some conductivity contrast ispresent in adjacent units. Another reason is that we initializeboundary depths in terms <strong>of</strong> where conductivity contrasts existin the initial model. For subsequent inversions, intermediatemodel solutions that feature very low resistivity contrasts betweenadjacent layers can also yield instability in the algorithm,since the model response is insensitve to perturbations in theboundary depth between two adjacent units <strong>with</strong> almost identicalresistivity. In this case, the two units can be merged intoone <strong>for</strong> further iterations. Also note that, because boundariesare parameterized in terms <strong>of</strong> the logarithm <strong>of</strong> the depth ratherthan thickness, the solution <strong>of</strong> equation (8) allows layer boundariesto cross over. When this occurs, we set the depth <strong>of</strong> the“lower” boundary equal to that <strong>of</strong> the “upper” boundary, thuspinching out a portion <strong>of</strong> the intermediate layer. Layers thatare completely pinched out in an inversion must be removed<strong>for</strong> further iterations to maintain stability.In application, we found that the algorithm converged slowlyunless we chose a fairly good starting model. One option, usedin the real <strong>data</strong> example, is to find the best layered model fittingthe <strong>data</strong> <strong>with</strong> a 1D inversion algorithm, and use this layeredsolution as a starting model <strong>for</strong> the <strong>2D</strong> algorithm. Anotheroption is to use results from the smooth Occam method tobuild a starting model. We note that different starting modelsmay yield different model solutions, especially when solving<strong>for</strong> a model <strong>with</strong> many layers. We attribute this to the inherentnonlinearity <strong>of</strong> the MT problem in the presence <strong>of</strong> <strong>sharp</strong>resistivity contrasts; the solution space <strong>of</strong> a nonlinear problemmay possess many local minima in which a linearized algorithm
MT <strong>Inversion</strong> <strong>for</strong> Resistivity Boundaries 81may become trapped. The inversion algorithm is terminatedwhen the inversion models show little variation after severaliterations.SYNTHETIC TESTSWe test the algorithm on two models <strong>of</strong> the type shown inFigure 2, <strong>with</strong> resistivity values <strong>of</strong> each model listed in Table 1.Model A features a conductive wedge underlying a highly resistivesurface layer and overlying a basement <strong>of</strong> intermediateresistivity, representative <strong>of</strong> sediments below basalts. The secondmodel (B) represents a resistive wedge-shaped body <strong>with</strong>ina more conductive matrix, typical <strong>of</strong> salt <strong>structure</strong>s found inthe Gulf <strong>of</strong> Mexico. For each model, apparent resistivity andphase <strong>data</strong> <strong>for</strong> both the transverse electric (TE) and transversemagnetic (TM) modes were generated at 21 stations, spaced at0.5-km intervals. The frequency ranges were chosen such thatthe penetration depth corresponds to the top unit at the highestfrequency and to the bottom unit at the lowest frequency.Responses were computed at five frequencies per decade (i.e.,at 24 frequencies from 400 to 0.01 Hz <strong>for</strong> the model featuringthe conductive wedge, and <strong>for</strong> 20 frequencies from 4 to0.0063 Hz <strong>for</strong> the resistive wedge model). To simulate noisy<strong>data</strong>, 5% random Gaussian noise was added to the resistivityand 1.4 ◦ to phase <strong>data</strong> prior to inversion. Since <strong>data</strong> errorsare Gaussian distributed, and the diagonals <strong>of</strong> W are the reciprocals<strong>of</strong> standard deviations in the apparent resistivity andphase, the desired level <strong>of</strong> misfit is rms 1.0.For each inversion, the models were represented by a grid<strong>of</strong> 68 columns and 36 rows <strong>of</strong> blocks. Although the 5.7 ◦ slopeat the upper boundary <strong>of</strong> the wedge and the 16.6 ◦ slope at thelower boundary were modeled precisely using triangles in thefinite-element <strong>for</strong>mulation <strong>of</strong> the <strong>for</strong>ward modeling algorithm,Table 1. Synthetic model resistivities (in ohm-meters).Unit number Model A Model B1 1000 12 10 1003 100 1the inversion procedure only allows <strong>for</strong> slopes to be modeledusing a stairstep approximation. Furthermore, the grid used <strong>for</strong>the inversion is not the same one used <strong>for</strong> the <strong>for</strong>ward computations;that is, the grid we used does not allow depth values to beassigned their “true” values used in the synthetic model. Thisprovides a realistic test <strong>of</strong> the algorithm as the locations <strong>of</strong> conductiveboundaries are rarely known in advance. We computedresponses <strong>for</strong> models discretized on this grid that most closelyresemble the starting models <strong>of</strong> Figure 2 and Table 1 to determinethe effect <strong>of</strong> gridding on the <strong>data</strong> misfit. We found thatthe rms misfit <strong>for</strong> the gridded model was 1.55 <strong>for</strong> the conductivewedge model and 1.5 <strong>for</strong> the resistive wedge model; thus,a finer grid discretization would be needed to represent themodel more accurately. However, note that these are not necessarilythe best-fitting models <strong>for</strong> this level <strong>of</strong> discretization,as resistivities and boundary depths can be adjusted slightly inorder to yield a model that fits the <strong>data</strong> slightly better.The number <strong>of</strong> discrete resistivity units must be specifiedin the starting model. We used a three-layer starting model<strong>for</strong> each inversion <strong>of</strong> the synthetic <strong>data</strong>, <strong>with</strong> resistivities anddepths as listed in Table 2. The boundary depth values <strong>for</strong> thestarting model were set by dividing the model into three layers,each consisting <strong>of</strong> 12 rows <strong>of</strong> blocks; initial resistivities werebased on values shown in the relevant pseudosections <strong>of</strong> theapparent resistivity <strong>data</strong>.Model A: Conductive wedgeThe noisy synthetic <strong>data</strong> <strong>for</strong> model A are shown in pseudosectionin Figure 3. The <strong>data</strong> were inverted <strong>with</strong> no penalty onTable 2. Starting model <strong>for</strong> each inversion.Boundary depth Model A Model B(km) (ohm-m) (ohm-m)1.102 631 1.32.590 31.6 3.2half-space 63.1 1.6FIG. 2. The <strong>2D</strong> resistivity model <strong>for</strong> the inversions <strong>of</strong> synthetic<strong>data</strong>, shown at 2:1 vertical exaggeration. The model featurestwo sloping boundaries and a blunt termination <strong>for</strong> the middlelayer. Unit resistivities are given in Table 1. Triangles indicatestation locations.FIG. 3. Pseudosections <strong>of</strong> the responses <strong>of</strong> model A, whichfeatures a conductive wedge. (a) TE apparent resistivitieslog 10 (ρ a ). (b) TM apparent resistivities log 10 (ρ a ). (c) TE phaseresponses. (d) TM phase responses.
82 de Groot-Hedlin and Constablethe differences in resistivity (i.e., only lateral variability in layerdepths were penalized). The best-fitting model achieved by thisinversion was attained after 13 iterations and has an rms misfit<strong>of</strong> 1.26. Comparison <strong>of</strong> the solution (shown in Figure 4) <strong>with</strong> theoriginal wedge shape shown superimposed on the model, indicatesthat both the unit conductivities and boundary locationshave been well imaged. In particular, the shape <strong>of</strong> both thetop and bottom wedge boundaries are well recovered <strong>with</strong>inthe limits af<strong>for</strong>ded by the stairstep approximation. However,instead <strong>of</strong> a blunt termination <strong>of</strong> the wedge to the left, the recoveredconductor pinches out gradually, and several isolatedconductors appear to the left <strong>of</strong> where the wedge terminationshould occur. These artifacts result from the smoothing constraints<strong>for</strong>ced on the layer-depth parameters, and indicate thatblunt terminations may be poorly imaged by this method.Comparison <strong>of</strong> the synthetic <strong>data</strong> and model responses indicatesthat the fit is poorest <strong>for</strong> the five stations at the left end<strong>of</strong> the model. The poor fit at these stations is due to the thepresence <strong>of</strong> the isolated conductors there, which result fromthe smoothing constraint on the layer boundaries. The adequatefit at the remainder <strong>of</strong> the stations suggests that slopingboundaries are adequately represented by the stairstepapproximation.For comparison, we inverted these <strong>data</strong> using the Occam <strong>2D</strong>MT algorithm (de Groot-Hedlin and Constable, 1990), whichsolves <strong>for</strong> the smoothest possible model (Figure 5). Again, werepresented the model by a grid <strong>of</strong> 68 columns and 36 rows.We specified an rms misft equal to that achieved by the boundarylayer inversion. We note that much lower misfits couldhave been achieved by the smooth inversion method, becausethere are (68 × 36) free parameters using this method, whilethe boundary layer inversion has only (3 + 68 × 2) degrees <strong>of</strong>freedom. The solution to this inversion was attained after sixiterations. The shape <strong>of</strong> the wedge is reproduced quite well,but the resistivities are less well recovered. Also, it is not clearwhere one would choose to place the lower boundary <strong>of</strong> thewedge <strong>structure</strong>.Model B: Resistive wedgeThe noisy synthetic <strong>data</strong> <strong>for</strong> model B are shown in pseudosectionin Figure 6. The model response is much weaker <strong>for</strong> thismodel than <strong>for</strong> model A, which is expected as the MT method isless sensitive to resistive anomalies than to conductive anomalies.Again, the <strong>data</strong> were inverted <strong>with</strong> no penalty on the resistivities,<strong>with</strong> the starting model listed in Table 2. The truemodel was poorly recovered in a straight<strong>for</strong>ward application<strong>of</strong> the boundary location inversion to these synthetic <strong>data</strong> (i.e.,although the final misfit was only 1.19, the solution was unrealisticallyrough). Relaxing the target misfit to 1.25 still resulted inan overly rough model, suggesting that the inversion achieveda local, rather than global, minimum. We attribute this to theFIG. 5. Model recovered from smooth inversion <strong>of</strong> <strong>data</strong> shownin Figure 3. The model is shown at 2:1 vertical exaggeration. Thewedge boundaries are shown superimposed on the model. Thestation locations are indicated by the triangles at the top <strong>of</strong>the pr<strong>of</strong>ile.FIG. 4. Model recovered from boundary location inversion <strong>of</strong><strong>data</strong> shown in Figure 3. The model is shown at 2:1 vertical exaggeration.The wedge boundaries are shown superimposed onthe model. The station locations are indicated by the trianglesat the top <strong>of</strong> the pr<strong>of</strong>ile.FIG. 6. Pseudosections <strong>of</strong> the responses <strong>of</strong> model B, which featuresa resistive wedge. (a) TE apparent resistivities log 10 (ρ a ).(b) TM apparent resistivities log 10 (ρ a ). (c) TE phase responses.(d) TM phase responses.
MT <strong>Inversion</strong> <strong>for</strong> Resistivity Boundaries 83fact that the inverse problem becomes increasingly nonlinear<strong>with</strong> increasing roughness; thus, the Jacobian sensitivities arean inaccurate estimate <strong>of</strong> the gradient in the solution space.To obtain a better model, we split the inversion into severalsteps in which we sequentially lower the target χ 2 . At each step,we reach the target misfit and per<strong>for</strong>m several more iterationsto smooth the model further. This ensures that the startingmodel at each iteration is reasonably smooth, so that a globallysmooth model can be found. The best smoothed model wecould achieve has an rms misfit <strong>of</strong> <strong>of</strong> 1.15 and was reachedafter a total <strong>of</strong> 22 iterations.This model, shown in Figure 7, shows that both the resistivitiesand boundary locations are reasonably well recovered;the resistivity <strong>of</strong> the wedge is 74 ohm-m in this model, andthe overlying and underlying layers each have a resistivity <strong>of</strong>1 ohm-m. The blunt termination <strong>of</strong> the wedge at the left is accuratelyimaged, but the flattening out <strong>of</strong> the wedge at the rightis poorly imaged. Indeed, the <strong>data</strong> residuals indicate that thefit is poorest <strong>for</strong> the stations at the right.We applied the Occam inversion method to these <strong>data</strong>, <strong>with</strong>a target rms <strong>of</strong> 1.15; the model shown in Figure 8 was attainedafter nine iterations. Obviously, this model does not resemblethe model recovered from the boundary inversion method, althoughthe response yields an equal misfit to the <strong>data</strong>. This issymptomatic <strong>of</strong> the nonuniqueness inherent in the MT method.The fact that highly dissimilar models can yield equivalent responsesindicates that the model solution is highly dependenton the choice <strong>of</strong> norm imposed on the model <strong>with</strong>in the regularizationprocedure. It also indicates the importance <strong>of</strong> a reasonablechoice <strong>of</strong> starting model <strong>for</strong> the <strong>sharp</strong> boundary inversion.Thus, application <strong>of</strong> geologically realistic constraintsis particularly important <strong>for</strong> imaging resistive targets using theMT method.INVERSION OF REAL DATAA marine MT(MMT) survey was carried out in the Gulf <strong>of</strong>Mexico in 1997 to test the feasibility <strong>of</strong> using sea-floor MT <strong>data</strong>to image the base <strong>of</strong> salt <strong>structure</strong>s (Constable et al., 1998;Hoversten et al., 2000). Imaging these <strong>structure</strong>s is <strong>of</strong> interestto the petroleum industry as salt <strong>structure</strong>s are associated<strong>with</strong> hydrocarbon traps. The high acoustic contrast between saltbodies and the surrounding matrix makes it difficult and costlyto image the shape <strong>of</strong> these bodies seismically. On the otherhand, the high resistivity contrast between salt bodies and thesurrounding water-saturated sediments (salt bodies are highlyresistive) makes it a good target <strong>for</strong> MMT exploration.The 1997 MMT survey was conducted over the Gemini subsaltpetroleum prospect located at 28 ◦ 46 ′ N, 88 ◦ 36 ′ W. Its shapewas previously determined using 3D seismic prestack depth migration,along <strong>with</strong> depth constraints provided by well logs. Inthis section, we use the boundary inversion method to examinewhether MMT <strong>data</strong> can be used to independently constrain theshape <strong>of</strong> a salt body. Bathymetry along the transect consideredhere is minor; there is less than 200-m relief along the line. Furthermore,the skin depths in the conductive sea-floor sedimentsare small, so field distortions due to bathymetric variations arequickly dissipated. There<strong>for</strong>e, bathymetric corrections may beneglected in the following analysis.The Gemini salt <strong>structure</strong> is a 3D body; thus, the electric andmagnetic fields do not decouple into two modes, as they would<strong>for</strong> an ideal prism. The survey line was along a perpendicularto a subsection <strong>of</strong> this <strong>structure</strong> that is 3–4 times longer than itis wide, approximately along its middle. TM mode impedanceswere calculated using the electric (E) field perpendicular to thelong axis <strong>of</strong> the body (local strike) and magnetic (H) field parallelto the strike. Previous numerical modeling studies (e.g.,Wannamaker et al., 1984) show that the response <strong>for</strong> a centrallylocated pr<strong>of</strong>ile across an elongate 3D body agrees <strong>with</strong>the TM response <strong>for</strong> a <strong>2D</strong> body <strong>with</strong> identical cross-section.Thus, we invert the TM mode <strong>data</strong> to image the cross-section<strong>of</strong> the 3D body. The TM <strong>data</strong>, shown at left in Figure 9, arerelatively noisy. Error estimates <strong>for</strong> the apparent resistivitiesand phases are as high as 50%; the minimum error is taken tobe 10%. Data from 15 sites at an average spacing <strong>of</strong> 0.9 km areconsidered.FIG. 7. Model recovered from boundary location inversion <strong>of</strong><strong>data</strong> shown in Figure 6. The model is shown at 2:1 vertical exaggeration.The wedge boundaries are shown superimposed onthe model. The station locations are indicated by the trianglesat the top <strong>of</strong> the pr<strong>of</strong>ile.FIG. 8. Model recovered from smooth inversion <strong>of</strong> <strong>data</strong> shownin Figure 6. The model is shown at 2:1 vertical exaggeration.The wedge boundaries are shown superimposed on the model.The station locations are indicated by the triangles at the top<strong>of</strong> the pr<strong>of</strong>ile.
84 de Groot-Hedlin and ConstableWe started the inversion <strong>of</strong> these <strong>data</strong> <strong>with</strong> a best-fittingseven-layer model determined from a 1D inversion <strong>of</strong> the <strong>data</strong>.The resistivities and depths <strong>with</strong> respect to the sea floor as listedin Table 3. For the first several iterations, no penalty was appliedto resistivity contrasts between layers. A single layer waspinched out in the first iteration and the inversion was restarted<strong>with</strong> six units. After several iterations, the models feature largeconductivity contrasts between units, and the algorithm convergespoorly due to breakdowns in the linear approximations.There<strong>for</strong>e, the inversion was restarted <strong>with</strong> a small penalty appliedto differences between the resistivities <strong>of</strong> adjacent units[i.e., the value c in equation (3) is given a small nonzero value].The final model, attained after a total <strong>of</strong> 18 iterations has anrms misfit <strong>of</strong> 1.2 and is shown in Figure 10. The shape <strong>of</strong> the bodydetermined by 3D seismic prestack migration is shown superimposed.The model results indicate that the shape <strong>of</strong> the lowersalt boundary is quite well resolved. Further tests <strong>with</strong> otherstarting models confirmed that the shape <strong>of</strong> the salt <strong>structure</strong>is consistently recovered in the inversion <strong>for</strong> boundary depths;however, the resistivity <strong>of</strong> this <strong>structure</strong> is less well resolved.The salt resistivities recovered ranged from 10 to 100 ohm-m.The TM mode response <strong>of</strong> the model in Figure 10 is shown atright in Figure 9. Comparison <strong>with</strong> the original <strong>data</strong> indicatesthat the broad features <strong>of</strong> this noisy <strong>data</strong> set are reproduced;the resistive salt body is manifested as a “pull-up” <strong>of</strong> the lowresistivities in the middle <strong>of</strong> the TM resistivity <strong>data</strong>, and as anisolated region <strong>of</strong> low values in the phase <strong>data</strong>. Thin resistivelayers at 1 km below the sea floor to the northeast <strong>of</strong> the saltbody are not represented in the seismic model, but have beenconfirmed by controlled source EM sounding.For comparison, we inverted these <strong>data</strong> using the Occam inversion,<strong>with</strong> a target misfit <strong>of</strong> 1.2. The algorithm converged tothe model shown in Figure 11 in three iterations. The top <strong>of</strong> thesalt <strong>structure</strong> is reasonably well resolved by this smooth inversionmethod, but the bottom is very poorly resolved althoughthe residuals indicate that the broad features <strong>of</strong> the <strong>data</strong> areadequately recovered. These results indicate that a contrastin resistivities at the top <strong>of</strong> the salt boundary is required bythe <strong>data</strong>, but that little contrast is required at the bottomboundary at this misfit level. However, the existence <strong>of</strong> a <strong>sharp</strong>Table 3.Boundary depth(km)Starting model <strong>for</strong> inverting Gemini <strong>data</strong>.Resistivity(ohm-m)0.446 0.731.023 1.231.918 1.253.298 1.475.424 1.168.704 3.89half-space 5.96FIG. 10. Model recovered from boundary location inversion <strong>of</strong>the Gemini <strong>data</strong>. The shape <strong>of</strong> the salt body recovered from3D seismic prestack migration is shown superimposed on themodel. Station locations are indicated by the triangles at thetop <strong>of</strong> the pr<strong>of</strong>ile. The station locations are indicated by the trianglesat the top <strong>of</strong> the pr<strong>of</strong>ile.FIG. 9. Gemini <strong>data</strong>. (a) TM mode log 10(ρ a ) <strong>data</strong>. (b) Pseudosection<strong>of</strong> the response <strong>of</strong> the model shown in Figure 10log 10 (ρ a ). (c) TM mode phase <strong>data</strong>. (d) Pseudosection <strong>of</strong> theTM phase response <strong>of</strong> the model shown in Figure 10.FIG. 11. Model recovered from Occam inversion <strong>of</strong> Gemini<strong>data</strong>. The station locations are indicated by the triangles at thetop <strong>of</strong> the pr<strong>of</strong>ile.
MT <strong>Inversion</strong> <strong>for</strong> Resistivity Boundaries 85conductivity contrast at the bottom boundary is a reasonablegeological constraint. Thus, given the geological constraint thatthe subsurface consists <strong>of</strong> regions <strong>with</strong> <strong>sharp</strong> resistivity contrasts,the inversion <strong>for</strong> boundary depths yields the most realisticmodel that fits the <strong>data</strong> at a given misft level. (Note thatthe bottom boundary can be recovered by the smooth Occamroutine by decreasing the misfit, but in this paper we want tocompare models <strong>with</strong> similar misfits.)DISCUSSION AND CONCLUSIONSGiven that there are a multiplicity <strong>of</strong> resistivity <strong>structure</strong>sthat can fit a noisy MT <strong>data</strong> set equally well, the choice <strong>of</strong>MT inversion method should be guided by the type <strong>of</strong> subsurface<strong>structure</strong> present. For instance, some smooth inversionmethods, such as the Occam method used in the examples, donot discriminate between vertical and horizontal <strong>structure</strong>, andare thus useful in regions where little is known a priori aboutthe subsurface. The boundary inversion method described herefavors layered <strong>structure</strong>s <strong>with</strong> possibly large conductivity contrastsbetween adjacent layers, and is useful where the geological<strong>for</strong>mations are relatively flat lying.For <strong>structure</strong>s that are very well resolved by the <strong>data</strong>, likethe conductive wedge, there is little difference in the features<strong>of</strong> the final models obtained using the Occam method and theboundary inversion method. However, a <strong>sharp</strong> boundary inversionallows depths <strong>of</strong> interfaces to be found directly <strong>with</strong>outinterpreting gradients in resistivity. For <strong>structure</strong>s that arepoorly resolved by the <strong>data</strong>, like the resistive wedge, the type<strong>of</strong> regularization has a much greater impact on the final model.Thus, the boundary inversion method is a good choice if thetarget anomaly is known to be resistive and to have a strongconductivity contrast <strong>with</strong> the surrounding medium.Due to inaccuracy <strong>of</strong> the linear approximation in the presence<strong>of</strong> strong conductivity contrasts, the boundary inversionmethod can be unstable, and somewhat prone to finding localminima. One solution, used in the application <strong>of</strong> this methodto the Gemini <strong>data</strong> set, is to apply a small penalty to the differencesin resistivity between adjacent layers. This prevents thecontrast from becoming large in the initial iterations, so that thelinear approximation remains sufficiently accurate. Anotherapproach, demonstrated in the resistive wedge example, is toapply the boundary inversion method in several steps so thatwe find the smoothest model at a particular misfit at each step.In this way, the algorithm’s search is directed toward models<strong>with</strong> smooth boundaries.ACKNOWLEDGMENTSWe thank Kerry Key <strong>for</strong> processing the Gemini <strong>data</strong> anddiscussions on its analysis, David Bartel <strong>of</strong> Chevron Texaco <strong>for</strong>providing us the shape <strong>of</strong> the Gemini salt volume as determinedby seismic <strong>data</strong>, and Phil Wannamaker <strong>for</strong> providing us <strong>with</strong> theadjoint method <strong>of</strong> solving <strong>for</strong> Jacobian sensistivities, which spedup the inversion algorithm considerably. We are also gratefulto Pamela Lezaeta, Colin Farquharson, and an anonymous reviewer<strong>for</strong> careful reviews. This work was supported by theScripps Seafloor Electromagnetic Methods Consortium.REFERENCESConstable, S. C., Parker, R. L., and Constable, C. G., 1987, Occam’sinversion: A practical algorithm <strong>for</strong> generating smooth models fromEM sounding <strong>data</strong>: Geophysics, 52, 289–300.Constable, S. C., Orange, A., Hoversten, G. M., and Morrison, H. F.,1998, Marine <strong>magnetotelluric</strong>s <strong>for</strong> petroleum exploration, Part 1: Asea-floor equipment system: Geophysics, 63, 816–825.de Groot-Hedlin, C., and Constable, S., 1990, Occam’s inversion to generatesmooth, two-dimensional models from <strong>magnetotelluric</strong> <strong>data</strong>:Geophysics, 55, 1613–1624.de Lugao, P. P., and Wannamaker, P. E., 1996, Calculating the twodimensional<strong>magnetotelluric</strong> Jacobian in finite elements using reciprocity:Geophysical Journal International, 127, 806–810.Gill, P. E., Murray, W., and Wright, M. H., 1981, Practical optimization:Academic Press.Hoversten, G. M., Constable, S. C., and Morrison, H. F., 2000, Marine<strong>magnetotelluric</strong>s <strong>for</strong> base-<strong>of</strong>-salt mapping: Gulf <strong>of</strong> Mexico field testat the Gemini <strong>structure</strong>: Geophysics, 65, 1476–1488.Jupp, D. L. B., and Voz<strong>of</strong>f, K., 1977, Two-dimensional <strong>magnetotelluric</strong>inversion: Geophysical Journal <strong>of</strong> the Royal Astronomical Society,50, 333–352.Marcuello-Pascual, A., Kaikkonen, P., and Pous, J., 1992, 2-D <strong>Inversion</strong><strong>of</strong> MT <strong>data</strong> <strong>with</strong> a variable model geometry: Geophysical Journal International,110, 297–304.Mehanee, S., and Zhdanov, M., 2002, Two-dimensional <strong>magnetotelluric</strong>inversion <strong>of</strong> blocky geoelectrical <strong>structure</strong>s: Journal <strong>of</strong> GeophysicalResearch, 107, EPM1-11.Oristaglio, M. L., and Worthington, M. H., 1980, <strong>Inversion</strong> <strong>of</strong> surfaceand borehole electromagnetic <strong>data</strong> <strong>for</strong> two-dimensional electricalconductivity models: Geophysical Prospecting, 28, 633–657.Rodi, W., 1989, Regularization and Backus-Gilbert estimation in nonlinearinverse problems: Applications to <strong>magnetotelluric</strong>s and surfacewaves: Ph.D. dissertation, Pennsylvania State University.Rodi, W., and Mackie, R. L., 2001, Nonlinear conjugate gradients algorithm<strong>for</strong> 2-D <strong>magnetotelluric</strong> inversion: Geophysics, 66, 174–187.Smith, T., Hoversten, M., Gasperikova, E., and Morrison, F., 1999,Sharp boundary inversion <strong>of</strong> <strong>2D</strong> <strong>magnetotelluric</strong> <strong>data</strong>: GeophysicalProspecting, 47, 469–486.Smith, T., and Booker, J. R., 1991, Rapid inversion <strong>of</strong> two- and threedimensional<strong>magnetotelluric</strong> <strong>data</strong>: Journal <strong>of</strong> Geophysical Research,96, 3905–3922.Tihonov, A. N., 1963a, Regularization <strong>of</strong> incorrectly posed problems:Soviet Math. Dokl., 4, 1035–1038.——— 1963b, Solution <strong>of</strong> incorrectly <strong>for</strong>mulated problems and the regularizationmethod: Soviet Math. Dokl., 4, 1624–1627.Uchida, T., 1993, Smooth 2-D inversion <strong>for</strong> <strong>magnetotelluric</strong> <strong>data</strong> basedon statistical criterion ABIC: Journal <strong>of</strong> Geomagnetism and Geoelectricity,45, 841–858.Wannamaker, P. E., Hohmann, G. W., and Ward, S. H., 1984, Magnetotelluricresponses <strong>of</strong> three-dimensional bodies in layered earths:Geophysics, 49, 1517–1533.Wannamaker, P. E., Stodt, J. A., and Rijo, L., 1987, A stable finiteelementsolution <strong>for</strong> two-dimensional <strong>magnetotelluric</strong> modeling:Geophysical Journal <strong>of</strong> the Royal Astronomical Society, 88, 277–296.APPENDIX ACOMPUTATION OF MODEL SENSITIVITIESThe finite element code <strong>for</strong> <strong>2D</strong> MT modeling, described inWannamaker et al. (1987), is used <strong>for</strong> computation <strong>of</strong> modelresponses, along <strong>with</strong> code to calculate Jacobian sensitivities,described by de Lugao and Wannamaker (1996). The modelsensitivities are derived using an adjoint method, which allowsthe sensistivities to be obtained at minimal additionalcomputational cost over that required <strong>for</strong> calculation <strong>of</strong> modelresponses.The Jacobian terms output by this code provide partialderivatives <strong>of</strong> each datum <strong>with</strong> respect to small changes inmodel resistivities. It is simple to convert these quantities toJacobian sensitivities <strong>with</strong> respect to log(ρ i ) by application <strong>of</strong>
86 de Groot-Hedlin and Constablethe chain rule, i.e.,∂(datum)∂(log(ρ i )) = ∂(datum) × ∂(ρ i)∂(ρ i ) ∂(log(ρ i ))= ∂(datum) × 2.3026ρ i , (A-1)∂(ρ i )where ρ i denotes the resistivity <strong>of</strong> the ith block. The partialderivatives <strong>for</strong> changes in <strong>data</strong> <strong>with</strong> respect to variations in thelog(resistivity) <strong>of</strong> each large unit are derived by summing theJacobian values <strong>of</strong> all small blocks <strong>with</strong>in that large unit. Thesequantities are exact to <strong>with</strong>in the accuracy <strong>of</strong> the finite elementmodeling code.We also use the chain rule to derive the partial derivatives<strong>of</strong> the <strong>data</strong> <strong>with</strong> respect to small changes in boundary depththrough application <strong>of</strong> the chain rule, i.e.,∂(datum)∂(ln(d i )) = ∂(datum) × ∂(ρ i)∂(ρ i ) ∂(ln(d i )) , (A-2)where d i is the depth parameter <strong>of</strong> interest. Again, the firstterm on the right side is the model sensitivity derived fromthe adjoint code. The second term is computed using a finitedifferencemethod, i.e., <strong>for</strong> a given boundary layer depth, we dividethe differences in resistivity across the boundary by the differencein ln(depth). Given that derivatives are accurate only<strong>for</strong> small incremental variations, we are introducing some errorinto the <strong>data</strong> sensitivities <strong>with</strong> respect to depth, especially ifeither the resistivity contrast or the depth increments are large.It is well known that the accuracy <strong>of</strong> a central finitedifferencescheme is accurate to second order, whereas the accuracy<strong>of</strong> <strong>for</strong>ward-difference or backward-difference approximationsare accurate only to first order (e.g., Gill et al., 1981).There<strong>for</strong>e, we compute <strong>data</strong> sensitivities <strong>with</strong> respect to depthusing∂(datum)∂(ln(d i )) = 1 (2J +∂(ρ)ln(d + ) − ln(d i )+ J − ∂(ρ)ln(d − ) − ln(d i )), (A-3)where d i is the depth <strong>of</strong> boundary <strong>for</strong> a particular column <strong>with</strong>ina layer and d + and d − represent downward and upward incrementsin depth (depth increases downward), respectively. Thatis, d + is the depth <strong>of</strong> the bottom <strong>of</strong> the subunit just below thegiven boundary parameter, and d − is the depth to the top <strong>of</strong>the subunit just above the given boundary parameter. The resistivitycontrast between the units is given by ∂(ρ), and J + andJ − are the model sensitivities derived from the adjoint code<strong>for</strong> the model subunits below and above the given boundaryparameter, respectively.