The Northern Yellowstone Elk: Density Dependence and Climatic ...
The Northern Yellowstone Elk: Density Dependence and Climatic ...
The Northern Yellowstone Elk: Density Dependence and Climatic ...

You also want an ePaper? Increase the reach of your titles
YUMPU automatically turns print PDFs into web optimized ePapers that Google loves.
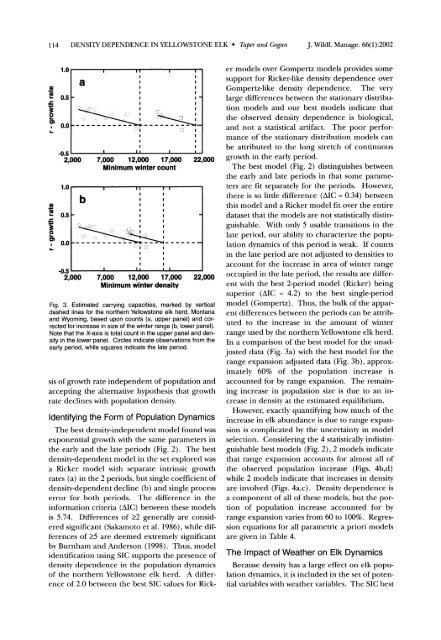
114 DENSITY DEPENDENCE IN YELLOWSTONE ELK * Taper <strong>and</strong> GoganJ. Wildl. Manage. 66(1):2002L.cICll0n ..a I I0.50.0-0.52,0 )00 7,000 12,000 17,000 22Minimum winter count1. .w0.50.0A BIX,) ( i IIIII1 II I I I In .. --U,02,000i Ii i iI IIIII()!~ ~ !(3~IIIIII1 1IIII7,000 12,000 17,000 22Minimum winter densityFig. 3. Estimated carrying capacities, marked by verticaldashed lines for the northern Yellowston elk herd, Montana<strong>and</strong> Wyoming, based upon counts (a, upper panel) <strong>and</strong> correctedfor increase in size of the winter range (b, lower panel).Note that the X-axis is total count in the upper panel <strong>and</strong> densityin the lower panel. Circles indicate observations from theearly period, while squares indicate the late period.sis of growth rate independent of population <strong>and</strong>accepting the alternative hypothesis that growthrate declines with population density.Identifying the Form of Population Dynamics<strong>The</strong> best density-independent model found wasexponential growth with the same parameters inthe early <strong>and</strong> the late periods (Fig. 2). <strong>The</strong> bestdensity-dependent model in the set explored wasa Ricker model with separate intrinsic growthrates (a) in the 2 periods, but single coefficient ofdensity-dependent decline (b) <strong>and</strong> single processerror for both periods. <strong>The</strong> difference in theinformation criteria (AIC) between these modelsis 5.74. Differences of >2 generally are consideredsignificant (Sakamoto et al. 1986), while differencesof >5 are deemed extremely significantby Burnham <strong>and</strong> Anderson (1998). Thus, modelidentification using SIC supports the presence ofdensity dependence in the population dynamicsof the northern <strong>Yellowstone</strong> elk herd. A differenceof 2.0 between the best SIC values for Rick-er models over Gompertz models provides somesupport for Ricker-like density dependence overGompertz-like density dependence. <strong>The</strong> verylarge differences between the stationary distribu-tion models <strong>and</strong> our best models indicate thatthe observed density dependence is biological,<strong>and</strong> not a statistical artifact. <strong>The</strong> poor performanceof the stationary distribution models canbe attributed to the long stretch of continuousgrowth in the early period.<strong>The</strong> best model (Fig. 2) distinguishes betweenthe early <strong>and</strong> late periods in that some parametersare fit separately for the periods. However,there is so little difference (AIC = 0.34) betweenthis model <strong>and</strong> a Ricker model fit over the entiredataset that the models are not statistically distinguishable.With only 5 usable transitions in thelate period, our ability to characterize the populationdynamics of this period is weak. If countsin the late period are not adjusted to densities toaccount for the increase in area of winter rangeoccupied in the late period, the results are differentwith the best 2-period model (Ricker) beingsuperior (AIC = 4.2) to the best single-periodmodel (Gompertz). Thus, the bulk of the apparentdifferences between the periods can be attributedto the increase in the amount of winterrange used by the northern <strong>Yellowstone</strong> elk herd.In a comparison of the best model for the unadjusteddata (Fig. 3a) with the best model for therange expansion adjusted data (Fig. 3b), approx-imately 60% of the population increase isaccounted for by range expansion. <strong>The</strong> remainingincrease in population size is due to an increasein density at the estimated equilibrium.However, exactly quantifying how much of theincrease in elk abundance is due to range expansionis complicated by the uncertainty in modelselection. Considering the 4 statistically indistin-guishable best models (Fig. 2), 2 models indicatethat range expansion accounts for almost all ofthe observed population increase (Figs. 4b,d)while 2 models indicate that increases in densityare involved (Figs. 4a,c). <strong>Density</strong> dependence isa component of all of these models, but the portionof population increase accounted for byrange expansion varies from 60 to 100%. Regressionequations for all parametric a priori modelsare given in Table 4.<strong>The</strong> Impact of Weather on <strong>Elk</strong> DynamicsBecause density has a large effect on elk populationdynamics, it is included in the set of potentialvariables with weather variables. <strong>The</strong> SIC best