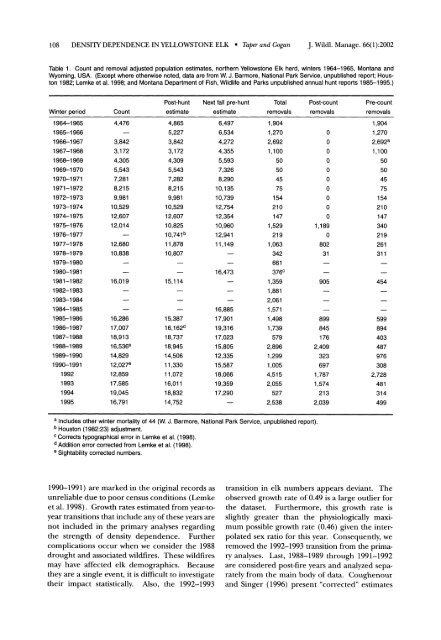
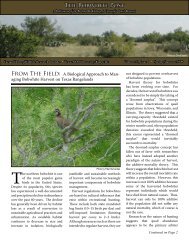
108 DENSITY DEPENDENCE IN YELLOWSTONE ELK * Taper <strong>and</strong> GoganJ. Wildl. Manage. 66(1):2002Table 1. Count <strong>and</strong> removal adjusted population estimates, northern <strong>Yellowstone</strong> <strong>Elk</strong> herd, winters 1964-1965, Montana <strong>and</strong>Wyoming, USA. (Except where otherwise noted, data are from W. J. Barmore, National Park Service, unpublished report; Houston1982; Lemke et al. 1998; <strong>and</strong> Montana Department of Fish, Wildlife <strong>and</strong> Parks unpublished annual hunt reports 1985-1995.)Post-hunt Next fall pre-hunt Total Post-count Pre-countWinter period Count estimate estimate removals removals removals1964-19651965-19661966-19671967-19681968-19691969-19701970-19711971-19721972-19731973-19741974-19751975-19761976-19771977-19781978-19791979-19801980-19811981-19821982-19831983-19841984-19851985-19861986-19871987-19881988-19891989-19901990-199119921993199419954,4763,8423,1724,3055,5437,2818,2159,98110,52912,60712,01412,68010,83816,01916,28617,00718,91316,536e14,82912,027e12,85917,58519,04516,7914,8655,2273,8423,1724,3095,5437,2828,2159,98110,52912,60710,82510,741 b11,87810,80715,11415,38716,162d18,73718,94514,50611,33011,07216,01118,83214,7526,4976,5344,2724,3555,5937,3268,29010,13510,73912,75412,35410,96012,94111,14916,47316,88517,90119,31617,02315,80512,33515,58718,06619,35917,2901,9041,2702,6921,100505045751542101471,5292191,063342661376C1,3591,8812,0611,5711,4981,7395792,8961,2991,0054,5152,0555272,538a Includes other winter mortality of 44 (W. J. Barmore, National Park Service, unpublished report).b Houston (1982:23) adjustment.c Corrects typographical error in Lemke et al. (1998).d Addition error corrected from Lemke et al. (1998).e Sightability corrected numbers.00000000001,1890802319058998451762,4093236971,7871,5742132,0391,9041,2702,692a1,100505045751542101473402192613114545998944034879763082,7284813144991990-1991) are marked in the original records asunreliable due to poor census conditions (Lemkeet al. 1998). Growth rates estimated from year-toyeartransitions that include any of these years arenot included in the primary analyses regardingthe strength of density dependence. Furthercomplications occur when we consider the 1988drought <strong>and</strong> associated wildfires. <strong>The</strong>se wildfiresmay have affected elk demographics. Becausethey are a single event, it is difficult to investigatetheir impact statistically. Also, the 1992-1993transition in elk numbers appears deviant. <strong>The</strong>observed growth rate of 0.49 is a large outlier forthe dataset. Furthermore, this growth rate isslightly greater than the physiologically maximumpossible growth rate (0.46) given the interpolatedsex ratio for this year. Consequently, weremoved the 1992-1993 transition from the primaryanalyses. Last, 1988-1989 through 1991-1992are considered post-fire years <strong>and</strong> analyzed separatelyfrom the main body of data. Coughenour<strong>and</strong> Singer (1996) present "corrected" estimates
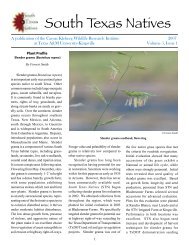
J. Wildl. Manage. 66(1):2002DENSITY DEPENDENCE IN YELLOWSTONE ELK * Taper <strong>and</strong> Gogan 109Table 2. Late winter age <strong>and</strong> sex composition of the northern<strong>Yellowstone</strong>lk herd, winters 1987-1988 through 1995-1996,Montana <strong>and</strong> Wyoming. Data are from records archived at <strong>Yellowstone</strong>National Park, Mammoth, Wyoming, USA.Calves: Yearling M: Adult M:Year 100 F 100 F 100 F n1987-1988 23 4 15 5,1031988-1989 6 2 13 2,8271989-1990 19 3 12 3,3931990-1991 26 - - 1,9251991-1992 44 - - 3,5301994-1995 33 11 29 3,6131995-1996 28 9 26 2,902of elk numbers for winters 1986-1987 through1990-1991 by adjusting numbers to account forthe proportion of radiocollared elk that were notseen during the st<strong>and</strong>ard aerial censuses.Coughenour <strong>and</strong> Singer's (1996) calculationsindicate that even in good survey years, aerialcensuses post-1986-1987 underestimate the populationlevels on the order of 25%. However, forthe 1988-1989 <strong>and</strong> 1990-1991 censusesCoughenour <strong>and</strong> Singer (1996) believe that only49 <strong>and</strong> 51% of the population was counted,respectively, confirming the census participants'assessments. We reduced the Coughenour <strong>and</strong>Singer (1996:574) corrected estimates for1988-1989 <strong>and</strong> 1990-1991 by 25% to make themcomparable with the rest of the count data.Early <strong>and</strong> Late Periods<strong>The</strong> census data do not form a continuousrecord. No population estimates were made during1980, 1981, 1983, or 1984. Consequently,growth rates are not available from 1979 to 1984.This divides the time series into an early (i.e.,1964-1979) <strong>and</strong> a late (i.e., 1986-1995) period.Adjusting for HuntingBecause our intent was to investigate the naturalregulation of the northern <strong>Yellowstone</strong> elkherd, we corrected for hunting to discern theunderlying natural population dynamics regardlessof whether hunting is density-dependent ordensity-independent. <strong>The</strong> annual elk cycle in <strong>Yellowstone</strong>begins with calving in spring, resultingin a population increase (Fig. 1). Perinatal mortalityreduces the population size somewhat(Singer et al. 1997), <strong>and</strong> then the populationenters a period with comparatively low naturalmortality until late winter (Green et al. 1997).Superimposed on this cycle are annual total herdcounts at the beginning of each year <strong>and</strong> annualhunting mortality. This population is subjectedto a regular-season hunt <strong>and</strong> a late-season hunt.<strong>The</strong> regular hunt has occurred between lateOctober <strong>and</strong> late November since the mid-1960s(Erickson 1981). <strong>The</strong> late hunts have varied fromlate November through early March during themid-1960s, mid-December through mid-Februaryduring the early 1980s, <strong>and</strong> earlyJanuary to mid-February during the 1990s (Erickson 1981,Lemke et al. 1998). Thus, the count <strong>and</strong> mosthunt mortality occur during a period of low naturalmortality. This allows us to study densitydependence in this herd as it would haveoccurred in the absence of hunting. We calculatea pre-hunt population estimate by adding all legalharvest plus known illegal kills <strong>and</strong> lost woundedanimals presumed to have died that occurredbefore the annual count to the estimated herdsize (Lemke et al. 1998). In a similar fashion, apost-hunt population estimate is constructed bysubtracting known subsequent anthropogenicmortality from the census (Table 1). We investigatednatural population regulation by studyingthe statistical dependence of transitions in populationnumbers from post-hunt to pre-hunt thenext year on post-hunt population size.Correcting for Range Expansion<strong>Density</strong> dependence by definition relatesgrowth rates to population densities. Calcula-tions based on raw population counts will not bevalid if range expansions or contractions occur.<strong>The</strong> winter range for the northern <strong>Yellowstone</strong>elk herd increased during the early 1980sPre-huntestimatez Z I /_ \6iPerinatal mortalityAerialcount Post-huntestimateCalving Early Latehunt huntWinter mortalityMay Jul Sep Nov Jan Mar MayJun Aug Oct Dec Feb AprFig. 1. Schematic diagram of annual cycle of elk numbers, timingof natural <strong>and</strong> human-induced mortality <strong>and</strong> sampling,northern <strong>Yellowstone</strong>lk herd, Montana <strong>and</strong> Wyoming.