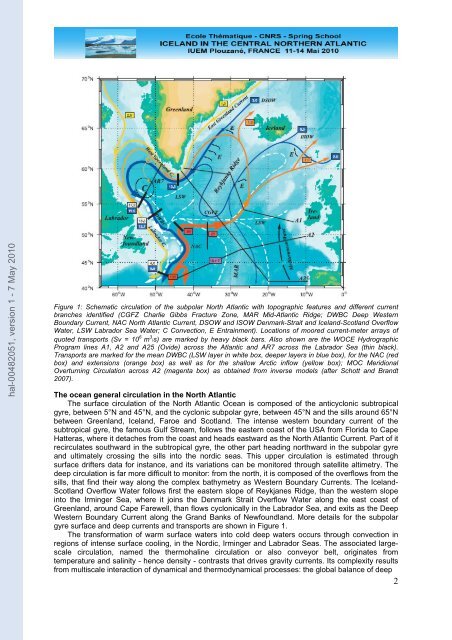
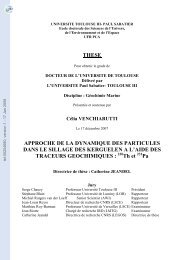
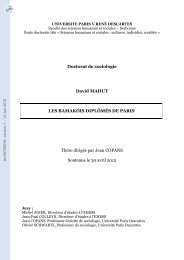
hal-00482051, version 1 - 7 May 2010Figure 1: Schematic <strong>circulation</strong> of <strong>the</strong> subpolar <strong>North</strong> <strong>Atlantic</strong> with topographic features and different currentbranches identified (CGFZ Charlie Gibbs Fracture Zone, MAR Mid-<strong>Atlantic</strong> Ridge; DWBC Deep WesternBoundary Current, NAC <strong>North</strong> <strong>Atlantic</strong> Current, DSOW and ISOW Denmark-Strait and Iceland-Scotland OverflowWater, LSW Labrador Sea Water; C Convection, E Entra<strong>in</strong>ment). Locations of moored current-meter arrays ofquoted transports (Sv = 10 6 m 3 /s) are marked by heavy black bars. Also shown are <strong>the</strong> WOCE HydrographicProgram l<strong>in</strong>es A1, A2 and A25 (Ovide) across <strong>the</strong> <strong>Atlantic</strong> and AR7 across <strong>the</strong> Labrador Sea (th<strong>in</strong> black).Transports are marked for <strong>the</strong> mean DWBC (LSW layer <strong>in</strong> white box, deeper layers <strong>in</strong> blue box), for <strong>the</strong> NAC (redbox) and extensions (orange box) as well as for <strong>the</strong> shallow Arctic <strong>in</strong>flow (yellow box); MOC MeridionalOverturn<strong>in</strong>g Circulation across A2 (magenta box) as obta<strong>in</strong>ed from <strong>in</strong>verse models (after Schott and Brandt2007).The ocean general <strong>circulation</strong> <strong>in</strong> <strong>the</strong> <strong>North</strong> <strong>Atlantic</strong>The surface <strong>circulation</strong> of <strong>the</strong> <strong>North</strong> <strong>Atlantic</strong> Ocean is composed of <strong>the</strong> anticyclonic subtropicalgyre, between 5°N and 45°N, and <strong>the</strong> cyclonic subpolar gyre, between 45°N and <strong>the</strong> sills around 65°Nbetween Greenland, Iceland, Faroe and Scotland. The <strong>in</strong>tense western boundary current of <strong>the</strong>subtropical gyre, <strong>the</strong> famous Gulf Stream, follows <strong>the</strong> eastern coast of <strong>the</strong> USA from Florida to CapeHatteras, where it detaches from <strong>the</strong> coast and heads eastward as <strong>the</strong> <strong>North</strong> <strong>Atlantic</strong> Current. Part of itrecirculates southward <strong>in</strong> <strong>the</strong> subtropical gyre, <strong>the</strong> o<strong>the</strong>r part head<strong>in</strong>g northward <strong>in</strong> <strong>the</strong> subpolar gyreand ultimately cross<strong>in</strong>g <strong>the</strong> sills <strong>in</strong>to <strong>the</strong> nordic seas. This upper <strong>circulation</strong> is estimated throughsurface drifters data for <strong>in</strong>stance, and its variations can be monitored through satellite altimetry. Thedeep <strong>circulation</strong> is far more difficult to monitor: from <strong>the</strong> north, it is composed of <strong>the</strong> overflows from <strong>the</strong>sills, that f<strong>in</strong>d <strong>the</strong>ir way along <strong>the</strong> complex bathymetry as Western Boundary Currents. The Iceland-Scotland Overflow Water follows first <strong>the</strong> eastern slope of Reykjanes Ridge, than <strong>the</strong> western slope<strong>in</strong>to <strong>the</strong> Irm<strong>in</strong>ger Sea, where it jo<strong>in</strong>s <strong>the</strong> Denmark Strait Overflow Water along <strong>the</strong> east coast ofGreenland, around Cape Farewell, than flows cyclonically <strong>in</strong> <strong>the</strong> Labrador Sea, and exits as <strong>the</strong> DeepWestern Boundary Current along <strong>the</strong> Grand Banks of Newfoundland. More details for <strong>the</strong> subpolargyre surface and deep currents and transports are shown <strong>in</strong> Figure 1.The transformation of warm surface waters <strong>in</strong>to cold deep waters occurs through convection <strong>in</strong>regions of <strong>in</strong>tense surface cool<strong>in</strong>g, <strong>in</strong> <strong>the</strong> Nordic, Irm<strong>in</strong>ger and Labrador Seas. The associated largescale<strong>circulation</strong>, named <strong>the</strong> <strong>the</strong>rmohal<strong>in</strong>e <strong>circulation</strong> or also conveyor belt, orig<strong>in</strong>ates fromtemperature and sal<strong>in</strong>ity - hence density - contrasts that drives gravity currents. Its complexity resultsfrom multiscale <strong>in</strong>teraction of dynamical and <strong>the</strong>rmodynamical processes: <strong>the</strong> global balance of deep2
water formation and consumption rema<strong>in</strong>s relatively unclear s<strong>in</strong>ce <strong>the</strong> processes controll<strong>in</strong>g diapycnal(vertical on first order) mix<strong>in</strong>g are not yet known, <strong>the</strong> overflows <strong>in</strong>teraction with bottom topography<strong>in</strong>duces entra<strong>in</strong>ment and mix<strong>in</strong>g difficult to quantify, convective chimneys are <strong>in</strong>termittent and <strong>the</strong>irsize is of order of kilometers, surface water densification is <strong>in</strong>tensified by br<strong>in</strong>e rejection through seaice formation...The Meridional Overturn<strong>in</strong>g Circulation, <strong>the</strong> two-dimensional latitude-depth view of <strong>the</strong>se currents,results from <strong>the</strong> northward flow <strong>in</strong> <strong>the</strong> upper layers (NAC) and <strong>the</strong> southward flow at depth (DWBC).Estimates for <strong>the</strong> <strong>in</strong>tensity of <strong>the</strong> <strong>Atlantic</strong> MOC are obta<strong>in</strong>ed from <strong>in</strong>verse model calculations, alonghydrographic sections or for regional configurations, and yields values from 13 to 18 Sv at 48°N (1Sverdrup is about <strong>the</strong> cumulated flow of all <strong>the</strong> world rivers). The associated poleward heat transport,result<strong>in</strong>g from <strong>the</strong> northward transport of warm upper waters <strong>in</strong> <strong>the</strong> <strong>North</strong> <strong>Atlantic</strong> Current and <strong>the</strong>southward return flow of cold waters with<strong>in</strong> <strong>the</strong> Deep Western Boundary Current, is estimated at0.61±0.07 PW (1 PW = 10 15 W is 100 times <strong>the</strong> global energy production of electricity and heat).hal-00482051, version 1 - 7 May 2010Decadal and <strong>in</strong>terdecadal <strong>changes</strong> <strong>in</strong> <strong>North</strong> <strong>Atlantic</strong> <strong>circulation</strong>While hydrographic data have been collected for more than 60 years <strong>in</strong> <strong>the</strong> <strong>North</strong> <strong>Atlantic</strong>, such ahistorical dataset is not available for direct measurements of currents. In order to determ<strong>in</strong>e <strong>the</strong>evolution of ocean currents over <strong>the</strong> last decades, one needs to rely on <strong>the</strong>oretical l<strong>in</strong>ks betweenhydrography and currents. The overflows from <strong>the</strong> nordic seas and <strong>the</strong> deep convection <strong>in</strong> <strong>the</strong>Labrador (and probably Irm<strong>in</strong>ger) Sea lie at <strong>the</strong> source of <strong>the</strong> <strong>Atlantic</strong> overturn<strong>in</strong>g. The recentmonitor<strong>in</strong>g of <strong>the</strong> overflows does not show significant variability but may be too short to addressdecadal and longer periods. The availability of hydrographic data collected <strong>in</strong> <strong>the</strong> Labrador Sea s<strong>in</strong>ce1948 reveals long term <strong>changes</strong> of temperature and sal<strong>in</strong>ity: cool<strong>in</strong>g and freshen<strong>in</strong>g from 1966 to 1992(Dickson et al. 2002), associated with atmospheric <strong>circulation</strong> shift from strongly negative to stronglypositive values of <strong>the</strong> <strong>North</strong> <strong>Atlantic</strong> Oscillation <strong>in</strong>dex.Analyses of surface data (for which we have <strong>the</strong> longest historical record) through variousstatistical techniques (EOF Empiral Orthogonal Fonctions, MSSA Multichannel S<strong>in</strong>gular SpectrumAnalysis) usually identify different signals <strong>in</strong> <strong>the</strong> <strong>North</strong> <strong>Atlantic</strong>: a quasi decadal signal whichcharacteristic SST pattern is tripolar (Alvarez-Garcia et al. 2008); a multidecadal signal named <strong>Atlantic</strong>Multidecadal Oscillation (AMO, Kerr 2000), which <strong>in</strong>dex is def<strong>in</strong>ed as <strong>the</strong> averaged <strong>North</strong> <strong>Atlantic</strong> SeaSurface Temperature (SST) from 0 to 70°N (detrended); and a global warm<strong>in</strong>g signal, often nonl<strong>in</strong>ear.Dist<strong>in</strong>guish<strong>in</strong>g <strong>the</strong> two latter may be challeng<strong>in</strong>g and an orig<strong>in</strong>al method based on coupled modelensemble simulations has been proposed (Knight 2009). Although <strong>the</strong> cold (1905-1925, 1970-2000)and warm (1925-1970, 2000 onward) phases of <strong>the</strong> AMO appear respectively associated with reducedand streng<strong>the</strong>ned <strong>the</strong>rmohal<strong>in</strong>e <strong>circulation</strong> and <strong>North</strong> <strong>Atlantic</strong> Current (Knight et al. 2005, Álvarez-García et al. 2008), <strong>the</strong> mechanism susta<strong>in</strong><strong>in</strong>g this oscillation is still unclear. A coupled modelsimulation reproduc<strong>in</strong>g AMO-like centennial variability suggest a coupled mechanism <strong>in</strong>volv<strong>in</strong>gnorthward shift of <strong>the</strong> ITCZ position with strong MOC, <strong>in</strong>creased freshwater <strong>in</strong>put <strong>in</strong>to <strong>the</strong> tropical<strong>North</strong> <strong>Atlantic</strong> Ocean hence generation of negative sal<strong>in</strong>ity anomaly that propagates slowly northwardand modify after several decades <strong>the</strong> overturn<strong>in</strong>g (Vell<strong>in</strong>ga and Wu 2004).The analysis of <strong>the</strong> now 17 year long record of sea surface height (SSH) from satellite altimetryshow a remarkable signal <strong>in</strong> <strong>the</strong> <strong>North</strong> <strong>Atlantic</strong> (Figure 2). The mean surface geostrophic currents flowcyclonically (anticyclonically) around <strong>the</strong> low (high) values of SSH <strong>in</strong> <strong>the</strong> subpolar (subtropical) gyre, <strong>in</strong>analogy with <strong>the</strong> surface w<strong>in</strong>ds around <strong>the</strong> icelandic low (Azores high) pressure <strong>in</strong> <strong>the</strong> atmosphere.Almost cont<strong>in</strong>uously from 1994 to 2004, <strong>the</strong> lowest SSH <strong>in</strong> <strong>the</strong> center of <strong>the</strong> subpolar gyre have beenris<strong>in</strong>g, reduc<strong>in</strong>g <strong>the</strong> <strong>in</strong>tensity of <strong>the</strong> subpolar gyre surface currents by almost 20% (Häkk<strong>in</strong>en andRh<strong>in</strong>es 2004). As <strong>the</strong> <strong>the</strong> subpolar gyre shr<strong>in</strong>ks, warmer and saltier waters from <strong>the</strong> <strong>North</strong> <strong>Atlantic</strong> Driftmake <strong>the</strong>ir way to <strong>the</strong> Nordic Seas (Häkk<strong>in</strong>en and Rh<strong>in</strong>es 2009). However <strong>the</strong> relationship betweenthis upper ocean horizontal subpolar <strong>circulation</strong> and <strong>the</strong> vertical <strong>Atlantic</strong> meridional overturn<strong>in</strong>g<strong>circulation</strong> is still unclear, although some numerical models suggest strong l<strong>in</strong>kages between subpolargyre <strong>circulation</strong>, Labrador Sea Water production and <strong>the</strong> <strong>Atlantic</strong> MOC. (now associated with ADCPcurrent measurements). A few of <strong>the</strong>se sections have been repeated <strong>in</strong> <strong>the</strong> <strong>North</strong> <strong>Atlantic</strong> around24°N, 48°N, and between Greenland and Portugal (Fourex, Ovide). They provide a very <strong>in</strong>stantaneousview of <strong>the</strong> <strong>circulation</strong> and conta<strong>in</strong> very energetic mesoscale signals that may be difficult to separatefrom <strong>the</strong> lower frequency signal one is look<strong>in</strong>g for. The early results from <strong>the</strong> repeated hydrographicsection along 24°N (Bryden et al. 2005) may be <strong>in</strong> doubt given <strong>the</strong> large high-frequency variabilityobserved <strong>in</strong> <strong>the</strong> transport (Cunn<strong>in</strong>gham et al. 2007). Inversions across 48°N for 5 sections from 19933