Recent changes in the North Atlantic circulation
Recent changes in the North Atlantic circulation
Recent changes in the North Atlantic circulation

You also want an ePaper? Increase the reach of your titles
YUMPU automatically turns print PDFs into web optimized ePapers that Google loves.
Author manuscript, published <strong>in</strong> "Iceland <strong>in</strong> <strong>the</strong> Central Nor<strong>the</strong>rn <strong>Atlantic</strong> : hotspot, sea currents and climate change, Plouzané :France (2010)"RECENT CHANGES IN THE NORTH ATLANTIC CIRCULATIONThierry Huck Laboratoire de Physique des Océans (UMR6523 CNRS IFREMER IRD UBO)UBO-UFR Sciences F308, 6 avenue Le Gorgeu, CS 93837, 29238 Brest Cedex 3, FRANCEAbstractThe three-dimensional ocean <strong>circulation</strong> is hardly observable but its quantification has greatlyimproved over <strong>the</strong> last two decades, due to moored array observations, deep float trajectories andsatellite altimetry. Historical temperature and sal<strong>in</strong>ity data reveal <strong>changes</strong> on various periods <strong>in</strong> <strong>the</strong><strong>North</strong> <strong>Atlantic</strong>: a global warm<strong>in</strong>g trend of <strong>the</strong> upper layers, quasi-decadal and multidecadal oscillations.The associated <strong>changes</strong> <strong>in</strong> <strong>the</strong> <strong>circulation</strong> are not yet clearly determ<strong>in</strong>ed, but some h<strong>in</strong>ts fromobservations and models are presented.hal-00482051, version 1 - 7 May 2010IntroductionThe large-scale ocean <strong>circulation</strong> is driven by <strong>the</strong> w<strong>in</strong>ds and ex<strong>changes</strong> of heat and freshwaterwith <strong>the</strong> atmosphere at <strong>the</strong> surface. It plays a role equivalent to <strong>the</strong> atmosphere <strong>in</strong> <strong>the</strong> Earth climatesystem and contributes to 1/3 of <strong>the</strong> poleward heat transport, reduc<strong>in</strong>g <strong>the</strong> temperature gradient at <strong>the</strong>Earth surface. The <strong>North</strong> <strong>Atlantic</strong> and Arctic Oceans are <strong>the</strong> very unique places where most of <strong>the</strong>transformation of warm surface waters <strong>in</strong>to cold deep waters occurs and feed <strong>the</strong> global conveyor beltor <strong>the</strong>rmohal<strong>in</strong>e <strong>circulation</strong>, although this may not have always been <strong>the</strong> case <strong>in</strong> <strong>the</strong> past. In fact <strong>the</strong><strong>in</strong>tensity of this transformation through convection has varied over <strong>the</strong> last decades, <strong>in</strong> response to<strong>changes</strong> <strong>in</strong> <strong>the</strong> atmospheric conditions. Reciprocally, deep water formation releases a large amount ofheat to <strong>the</strong> atmosphere that is brought to Europe by <strong>the</strong> predom<strong>in</strong>ant westerlies <strong>in</strong> <strong>the</strong> midlatitudes,modulat<strong>in</strong>g temperature and precipitations. The observed freshen<strong>in</strong>g of <strong>the</strong> <strong>North</strong> <strong>Atlantic</strong>, reduc<strong>in</strong>g<strong>the</strong> seawater density hence its ability to convect, analyses of repeated hydrographic sections, andcoupled climate models results, have raised uncerta<strong>in</strong>ty <strong>in</strong> <strong>the</strong> ma<strong>in</strong>tenance of <strong>the</strong> <strong>the</strong>rmohal<strong>in</strong>e<strong>circulation</strong> with<strong>in</strong> <strong>the</strong> ongo<strong>in</strong>g global warm<strong>in</strong>g.Unfortunately, <strong>the</strong> large-scale ocean <strong>circulation</strong> is difficult to measure directly: historicalcurrentmeter data are often short, very localized and polluted by very energetic high-frequency signalsdue to tides and mesoscale eddies; recent Acoustic Doppler Current Profiler data allow cont<strong>in</strong>uousmonitor<strong>in</strong>g on moored arrays or along ship tracks, but suffer o<strong>the</strong>rwise <strong>the</strong> same limitations. Hencecurrents are often deduced from hydrology, namely temperature and sal<strong>in</strong>ity, that have beenmeasured accurately s<strong>in</strong>ce <strong>the</strong> 1950's, cont<strong>in</strong>uously on <strong>the</strong> vertical through CTD (conductivitytemperature-depth)deployments from ships s<strong>in</strong>ce <strong>the</strong> 1970's, and now on autonomous profilers as <strong>in</strong><strong>the</strong> Argo program. The comb<strong>in</strong>ation of <strong>the</strong> equations of movements (<strong>the</strong> geostrophic equilibriumbetween pressure gradient and Coriolis force, and <strong>the</strong> hydrostatic balance) leads to <strong>the</strong> <strong>the</strong>rmal w<strong>in</strong>dbalance, that provides <strong>the</strong> vertical derivative of <strong>the</strong> horizontal velocity given <strong>the</strong> density field(computed from temperature and sal<strong>in</strong>ity). One f<strong>in</strong>ally needs some additional <strong>in</strong>formation or hypo<strong>the</strong>sisfor <strong>the</strong> absolute velocity at a given depth (<strong>the</strong> famous level of no motion) to compute <strong>the</strong> absolutevelocity field.Fortunately, <strong>the</strong> development of satellite altimetry has provided cont<strong>in</strong>uous almost-globalobservations of sealevel s<strong>in</strong>ce late 1992 that proves <strong>the</strong> most complete oceanographic datasetnowadays. Surface geostrophic currents can be computed at 1/2° resolution from 70°S to 70°N on aweekly basis <strong>in</strong> near real time. Associated with <strong>the</strong> deployment of <strong>the</strong> Argo array of profil<strong>in</strong>g floatss<strong>in</strong>ce 2003 (<strong>the</strong> target 3000 floats spread worldwide was reached <strong>in</strong> 2009), provid<strong>in</strong>g vertical profilesof temperature and sal<strong>in</strong>ity down to 2000m every 10 days as well as trajectories at <strong>the</strong>ir usual park<strong>in</strong>gdepth of 1000m, <strong>the</strong> global observ<strong>in</strong>g system of <strong>the</strong> ocean has never been so dense, maybe at <strong>the</strong>expense of reduced fund<strong>in</strong>g for measurements below 2000m...Given <strong>the</strong>se landmarks <strong>in</strong> <strong>the</strong> evolution of <strong>the</strong> observ<strong>in</strong>g system of <strong>the</strong> ocean and <strong>the</strong> associateduncerta<strong>in</strong>ties to estimate <strong>the</strong> ocean currents, we will successively describe <strong>the</strong> <strong>North</strong> <strong>Atlantic</strong> general<strong>circulation</strong> and its reported variations dur<strong>in</strong>g <strong>the</strong> last decades.1
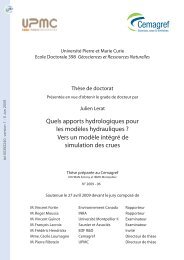
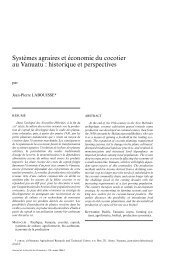
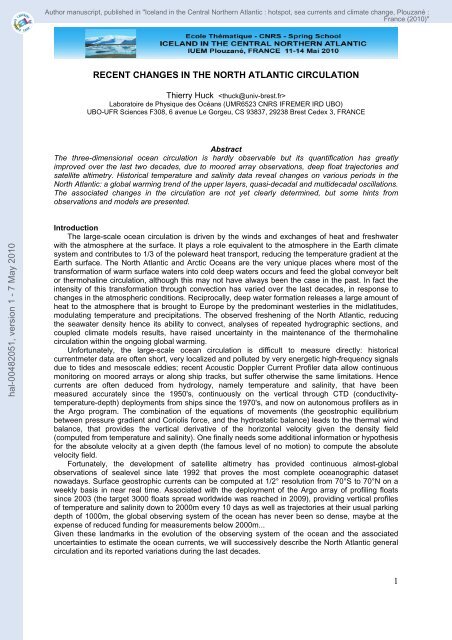
hal-00482051, version 1 - 7 May 2010Figure 1: Schematic <strong>circulation</strong> of <strong>the</strong> subpolar <strong>North</strong> <strong>Atlantic</strong> with topographic features and different currentbranches identified (CGFZ Charlie Gibbs Fracture Zone, MAR Mid-<strong>Atlantic</strong> Ridge; DWBC Deep WesternBoundary Current, NAC <strong>North</strong> <strong>Atlantic</strong> Current, DSOW and ISOW Denmark-Strait and Iceland-Scotland OverflowWater, LSW Labrador Sea Water; C Convection, E Entra<strong>in</strong>ment). Locations of moored current-meter arrays ofquoted transports (Sv = 10 6 m 3 /s) are marked by heavy black bars. Also shown are <strong>the</strong> WOCE HydrographicProgram l<strong>in</strong>es A1, A2 and A25 (Ovide) across <strong>the</strong> <strong>Atlantic</strong> and AR7 across <strong>the</strong> Labrador Sea (th<strong>in</strong> black).Transports are marked for <strong>the</strong> mean DWBC (LSW layer <strong>in</strong> white box, deeper layers <strong>in</strong> blue box), for <strong>the</strong> NAC (redbox) and extensions (orange box) as well as for <strong>the</strong> shallow Arctic <strong>in</strong>flow (yellow box); MOC MeridionalOverturn<strong>in</strong>g Circulation across A2 (magenta box) as obta<strong>in</strong>ed from <strong>in</strong>verse models (after Schott and Brandt2007).The ocean general <strong>circulation</strong> <strong>in</strong> <strong>the</strong> <strong>North</strong> <strong>Atlantic</strong>The surface <strong>circulation</strong> of <strong>the</strong> <strong>North</strong> <strong>Atlantic</strong> Ocean is composed of <strong>the</strong> anticyclonic subtropicalgyre, between 5°N and 45°N, and <strong>the</strong> cyclonic subpolar gyre, between 45°N and <strong>the</strong> sills around 65°Nbetween Greenland, Iceland, Faroe and Scotland. The <strong>in</strong>tense western boundary current of <strong>the</strong>subtropical gyre, <strong>the</strong> famous Gulf Stream, follows <strong>the</strong> eastern coast of <strong>the</strong> USA from Florida to CapeHatteras, where it detaches from <strong>the</strong> coast and heads eastward as <strong>the</strong> <strong>North</strong> <strong>Atlantic</strong> Current. Part of itrecirculates southward <strong>in</strong> <strong>the</strong> subtropical gyre, <strong>the</strong> o<strong>the</strong>r part head<strong>in</strong>g northward <strong>in</strong> <strong>the</strong> subpolar gyreand ultimately cross<strong>in</strong>g <strong>the</strong> sills <strong>in</strong>to <strong>the</strong> nordic seas. This upper <strong>circulation</strong> is estimated throughsurface drifters data for <strong>in</strong>stance, and its variations can be monitored through satellite altimetry. Thedeep <strong>circulation</strong> is far more difficult to monitor: from <strong>the</strong> north, it is composed of <strong>the</strong> overflows from <strong>the</strong>sills, that f<strong>in</strong>d <strong>the</strong>ir way along <strong>the</strong> complex bathymetry as Western Boundary Currents. The Iceland-Scotland Overflow Water follows first <strong>the</strong> eastern slope of Reykjanes Ridge, than <strong>the</strong> western slope<strong>in</strong>to <strong>the</strong> Irm<strong>in</strong>ger Sea, where it jo<strong>in</strong>s <strong>the</strong> Denmark Strait Overflow Water along <strong>the</strong> east coast ofGreenland, around Cape Farewell, than flows cyclonically <strong>in</strong> <strong>the</strong> Labrador Sea, and exits as <strong>the</strong> DeepWestern Boundary Current along <strong>the</strong> Grand Banks of Newfoundland. More details for <strong>the</strong> subpolargyre surface and deep currents and transports are shown <strong>in</strong> Figure 1.The transformation of warm surface waters <strong>in</strong>to cold deep waters occurs through convection <strong>in</strong>regions of <strong>in</strong>tense surface cool<strong>in</strong>g, <strong>in</strong> <strong>the</strong> Nordic, Irm<strong>in</strong>ger and Labrador Seas. The associated largescale<strong>circulation</strong>, named <strong>the</strong> <strong>the</strong>rmohal<strong>in</strong>e <strong>circulation</strong> or also conveyor belt, orig<strong>in</strong>ates fromtemperature and sal<strong>in</strong>ity - hence density - contrasts that drives gravity currents. Its complexity resultsfrom multiscale <strong>in</strong>teraction of dynamical and <strong>the</strong>rmodynamical processes: <strong>the</strong> global balance of deep2
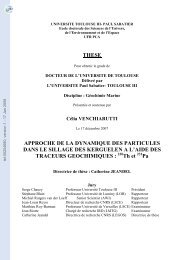
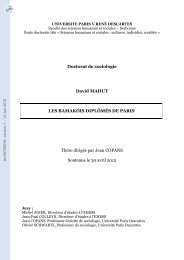
water formation and consumption rema<strong>in</strong>s relatively unclear s<strong>in</strong>ce <strong>the</strong> processes controll<strong>in</strong>g diapycnal(vertical on first order) mix<strong>in</strong>g are not yet known, <strong>the</strong> overflows <strong>in</strong>teraction with bottom topography<strong>in</strong>duces entra<strong>in</strong>ment and mix<strong>in</strong>g difficult to quantify, convective chimneys are <strong>in</strong>termittent and <strong>the</strong>irsize is of order of kilometers, surface water densification is <strong>in</strong>tensified by br<strong>in</strong>e rejection through seaice formation...The Meridional Overturn<strong>in</strong>g Circulation, <strong>the</strong> two-dimensional latitude-depth view of <strong>the</strong>se currents,results from <strong>the</strong> northward flow <strong>in</strong> <strong>the</strong> upper layers (NAC) and <strong>the</strong> southward flow at depth (DWBC).Estimates for <strong>the</strong> <strong>in</strong>tensity of <strong>the</strong> <strong>Atlantic</strong> MOC are obta<strong>in</strong>ed from <strong>in</strong>verse model calculations, alonghydrographic sections or for regional configurations, and yields values from 13 to 18 Sv at 48°N (1Sverdrup is about <strong>the</strong> cumulated flow of all <strong>the</strong> world rivers). The associated poleward heat transport,result<strong>in</strong>g from <strong>the</strong> northward transport of warm upper waters <strong>in</strong> <strong>the</strong> <strong>North</strong> <strong>Atlantic</strong> Current and <strong>the</strong>southward return flow of cold waters with<strong>in</strong> <strong>the</strong> Deep Western Boundary Current, is estimated at0.61±0.07 PW (1 PW = 10 15 W is 100 times <strong>the</strong> global energy production of electricity and heat).hal-00482051, version 1 - 7 May 2010Decadal and <strong>in</strong>terdecadal <strong>changes</strong> <strong>in</strong> <strong>North</strong> <strong>Atlantic</strong> <strong>circulation</strong>While hydrographic data have been collected for more than 60 years <strong>in</strong> <strong>the</strong> <strong>North</strong> <strong>Atlantic</strong>, such ahistorical dataset is not available for direct measurements of currents. In order to determ<strong>in</strong>e <strong>the</strong>evolution of ocean currents over <strong>the</strong> last decades, one needs to rely on <strong>the</strong>oretical l<strong>in</strong>ks betweenhydrography and currents. The overflows from <strong>the</strong> nordic seas and <strong>the</strong> deep convection <strong>in</strong> <strong>the</strong>Labrador (and probably Irm<strong>in</strong>ger) Sea lie at <strong>the</strong> source of <strong>the</strong> <strong>Atlantic</strong> overturn<strong>in</strong>g. The recentmonitor<strong>in</strong>g of <strong>the</strong> overflows does not show significant variability but may be too short to addressdecadal and longer periods. The availability of hydrographic data collected <strong>in</strong> <strong>the</strong> Labrador Sea s<strong>in</strong>ce1948 reveals long term <strong>changes</strong> of temperature and sal<strong>in</strong>ity: cool<strong>in</strong>g and freshen<strong>in</strong>g from 1966 to 1992(Dickson et al. 2002), associated with atmospheric <strong>circulation</strong> shift from strongly negative to stronglypositive values of <strong>the</strong> <strong>North</strong> <strong>Atlantic</strong> Oscillation <strong>in</strong>dex.Analyses of surface data (for which we have <strong>the</strong> longest historical record) through variousstatistical techniques (EOF Empiral Orthogonal Fonctions, MSSA Multichannel S<strong>in</strong>gular SpectrumAnalysis) usually identify different signals <strong>in</strong> <strong>the</strong> <strong>North</strong> <strong>Atlantic</strong>: a quasi decadal signal whichcharacteristic SST pattern is tripolar (Alvarez-Garcia et al. 2008); a multidecadal signal named <strong>Atlantic</strong>Multidecadal Oscillation (AMO, Kerr 2000), which <strong>in</strong>dex is def<strong>in</strong>ed as <strong>the</strong> averaged <strong>North</strong> <strong>Atlantic</strong> SeaSurface Temperature (SST) from 0 to 70°N (detrended); and a global warm<strong>in</strong>g signal, often nonl<strong>in</strong>ear.Dist<strong>in</strong>guish<strong>in</strong>g <strong>the</strong> two latter may be challeng<strong>in</strong>g and an orig<strong>in</strong>al method based on coupled modelensemble simulations has been proposed (Knight 2009). Although <strong>the</strong> cold (1905-1925, 1970-2000)and warm (1925-1970, 2000 onward) phases of <strong>the</strong> AMO appear respectively associated with reducedand streng<strong>the</strong>ned <strong>the</strong>rmohal<strong>in</strong>e <strong>circulation</strong> and <strong>North</strong> <strong>Atlantic</strong> Current (Knight et al. 2005, Álvarez-García et al. 2008), <strong>the</strong> mechanism susta<strong>in</strong><strong>in</strong>g this oscillation is still unclear. A coupled modelsimulation reproduc<strong>in</strong>g AMO-like centennial variability suggest a coupled mechanism <strong>in</strong>volv<strong>in</strong>gnorthward shift of <strong>the</strong> ITCZ position with strong MOC, <strong>in</strong>creased freshwater <strong>in</strong>put <strong>in</strong>to <strong>the</strong> tropical<strong>North</strong> <strong>Atlantic</strong> Ocean hence generation of negative sal<strong>in</strong>ity anomaly that propagates slowly northwardand modify after several decades <strong>the</strong> overturn<strong>in</strong>g (Vell<strong>in</strong>ga and Wu 2004).The analysis of <strong>the</strong> now 17 year long record of sea surface height (SSH) from satellite altimetryshow a remarkable signal <strong>in</strong> <strong>the</strong> <strong>North</strong> <strong>Atlantic</strong> (Figure 2). The mean surface geostrophic currents flowcyclonically (anticyclonically) around <strong>the</strong> low (high) values of SSH <strong>in</strong> <strong>the</strong> subpolar (subtropical) gyre, <strong>in</strong>analogy with <strong>the</strong> surface w<strong>in</strong>ds around <strong>the</strong> icelandic low (Azores high) pressure <strong>in</strong> <strong>the</strong> atmosphere.Almost cont<strong>in</strong>uously from 1994 to 2004, <strong>the</strong> lowest SSH <strong>in</strong> <strong>the</strong> center of <strong>the</strong> subpolar gyre have beenris<strong>in</strong>g, reduc<strong>in</strong>g <strong>the</strong> <strong>in</strong>tensity of <strong>the</strong> subpolar gyre surface currents by almost 20% (Häkk<strong>in</strong>en andRh<strong>in</strong>es 2004). As <strong>the</strong> <strong>the</strong> subpolar gyre shr<strong>in</strong>ks, warmer and saltier waters from <strong>the</strong> <strong>North</strong> <strong>Atlantic</strong> Driftmake <strong>the</strong>ir way to <strong>the</strong> Nordic Seas (Häkk<strong>in</strong>en and Rh<strong>in</strong>es 2009). However <strong>the</strong> relationship betweenthis upper ocean horizontal subpolar <strong>circulation</strong> and <strong>the</strong> vertical <strong>Atlantic</strong> meridional overturn<strong>in</strong>g<strong>circulation</strong> is still unclear, although some numerical models suggest strong l<strong>in</strong>kages between subpolargyre <strong>circulation</strong>, Labrador Sea Water production and <strong>the</strong> <strong>Atlantic</strong> MOC. (now associated with ADCPcurrent measurements). A few of <strong>the</strong>se sections have been repeated <strong>in</strong> <strong>the</strong> <strong>North</strong> <strong>Atlantic</strong> around24°N, 48°N, and between Greenland and Portugal (Fourex, Ovide). They provide a very <strong>in</strong>stantaneousview of <strong>the</strong> <strong>circulation</strong> and conta<strong>in</strong> very energetic mesoscale signals that may be difficult to separatefrom <strong>the</strong> lower frequency signal one is look<strong>in</strong>g for. The early results from <strong>the</strong> repeated hydrographicsection along 24°N (Bryden et al. 2005) may be <strong>in</strong> doubt given <strong>the</strong> large high-frequency variabilityobserved <strong>in</strong> <strong>the</strong> transport (Cunn<strong>in</strong>gham et al. 2007). Inversions across 48°N for 5 sections from 19933
to 2000 show no decadal trend (Lumpk<strong>in</strong> et al. 2008). On <strong>the</strong> o<strong>the</strong>r hand, <strong>the</strong> ongo<strong>in</strong>g Ovide programof repeated hydraphic sections between Greenland and Portugal, close to <strong>the</strong> A25 l<strong>in</strong>e sampled <strong>in</strong>1997 (Fourex), suggest a possible decl<strong>in</strong>e of <strong>the</strong> overturn<strong>in</strong>g from 18.5 Sv <strong>in</strong> 1997, 16.4 Sv <strong>in</strong> 2002and 2004, to 11.4 sv <strong>in</strong> 2006 (<strong>in</strong> density coord<strong>in</strong>ates, Gourcuff 2008), although <strong>the</strong> latter value may beunusually low due to high frequency variability.Results from numerical models, with or without data assimilation, do not help much <strong>in</strong> sort<strong>in</strong>g out<strong>the</strong>se results: we observe a large dispersion for <strong>the</strong> mean values of <strong>the</strong> MOC as well as its variability,although many suggest a decl<strong>in</strong><strong>in</strong>g trend s<strong>in</strong>ce 1995. Susta<strong>in</strong>ed monitor<strong>in</strong>g is required <strong>in</strong> order tobetter understand what is go<strong>in</strong>g on. Direct measurements of <strong>the</strong> overturn<strong>in</strong>g requires coast to coasthydrographic sectionshal-00482051, version 1 - 7 May 2010Figure 2: (top) The spatial pattern of <strong>the</strong> first empirical orthogonal function and (bottom) associated time series for<strong>the</strong> sea surface height from AVISO altimeter data. The spatial pattern is dimensionless, <strong>the</strong> time series have unitsof centimeters (after Häkk<strong>in</strong>en and Rh<strong>in</strong>es 2009).4
hal-00482051, version 1 - 7 May 2010RefererencesÁlvarez-García F., Latif M., Biastoch A., 2008, On Multidecadal and Quasi-Decadal <strong>North</strong> <strong>Atlantic</strong>Variability. J. Clim., 21, 3433-3452.Bryden H. L., Longworth H. R., Cunn<strong>in</strong>gham S. A., 2005, Has <strong>the</strong> <strong>Atlantic</strong> overturn<strong>in</strong>g <strong>circulation</strong>slowed? Nature, 438, 655-657.Cunn<strong>in</strong>gham S. A., Kanzow T., Rayner D., Bar<strong>in</strong>ger M. O., Johns W. E., Marotzke J., Longworth H. R.,Grant E. M., Hirschi J.-M., Beal L. M., Me<strong>in</strong>en C. S., Bryden H. L., 2007, Temporal Variability of<strong>the</strong> <strong>Atlantic</strong> Meridional Overturn<strong>in</strong>g Circulation at 26.5°N. Science, 317, 935-938.Dickson B., Yashayaev I., Me<strong>in</strong>cke J., Turrell B., Dye S., Holfort J., 2002, Rapid freshen<strong>in</strong>g of <strong>the</strong>deep <strong>North</strong> <strong>Atlantic</strong> Ocean over <strong>the</strong> past four decades. Nature, 416, 832-837.Flatau M. K., Talley L., Niiler P. P., 2003, The <strong>North</strong> <strong>Atlantic</strong> Oscillation, surface current velocities, andSST <strong>changes</strong> <strong>in</strong> <strong>the</strong> subpolar <strong>North</strong> <strong>Atlantic</strong>. J. Clim., 16, 2355-2369.Gourcuff C., 2008, Etude de la variabilité de la <strong>circulation</strong> du gyre subpolaire de l'Atlantique Nord àl'aide des données Ovide et des mesures satellitaires. PhD manuscript, Université de BretagneOccidentale, Brest, France.Häkk<strong>in</strong>en S., Rh<strong>in</strong>es P. B., 2004, Decl<strong>in</strong>e of subpolar <strong>North</strong> <strong>Atlantic</strong> <strong>circulation</strong> dur<strong>in</strong>g <strong>the</strong> 1990s.Science, 304, 555-559.Häkk<strong>in</strong>en S., Rh<strong>in</strong>es P. B., 2009, Shift<strong>in</strong>g surface currents <strong>in</strong> <strong>the</strong> nor<strong>the</strong>rn <strong>North</strong> <strong>Atlantic</strong> Ocean. JGR,114, C4, C04005, doi:10.1029/2008JC004883 .Kerr R. A., 2000, A <strong>North</strong> <strong>Atlantic</strong> climate pacemaker for <strong>the</strong> centuries. Science, 288, 1984-1986.Knight J. R., Allan R. J., Folland C. K., Vell<strong>in</strong>ga M., Mann M. E., 2005, A signature of persistent natural<strong>the</strong>rmohal<strong>in</strong>e <strong>circulation</strong> cycles <strong>in</strong> observed climate. GRL, 32, 20, L20708,doi:10.1029/2005GL024233 .Knight J. R., 2009, The <strong>Atlantic</strong> Multidecadal Oscillation <strong>in</strong>ferred from <strong>the</strong> forced climate response <strong>in</strong>coupled general <strong>circulation</strong> models. J. Clim., 22, 1610-1625.Lumpk<strong>in</strong> R., Speer K., Koltermann K. P., 2008, Transport across 48°N <strong>in</strong> <strong>the</strong> <strong>North</strong> <strong>Atlantic</strong> Ocean.JPO, 38, 733-752.Parker D., Folland C., Scaife A., Knight J., Colman A., Ba<strong>in</strong>es P., Dong B., 2007, Decadal tomultidecadal variability and <strong>the</strong> climate change background. JGR, 112, D18, doi:10.1029/2007JD008411 .Schott F. A., Brandt P., 2007, Circulation and Deep Water Export of <strong>the</strong> Subpolar <strong>North</strong> <strong>Atlantic</strong> Dur<strong>in</strong>g<strong>the</strong> 1990’s. In: Ocean Circulation: Mechanisms and Impacts, Geophysical Monograph Series173, American Geophysical Union, 91-117, doi: 10.1029/173GM08.Vell<strong>in</strong>ga M., Wu P., 2004, Low-Latitude Freshwater Influence on Centennial Variability of <strong>the</strong> <strong>Atlantic</strong>Thermohal<strong>in</strong>e Circulation. J. Clim., 17, 4498-4511, doi: 10.1175/3219.1.5