Financial results for 2007 - Foresters Friendly Society
Financial results for 2007 - Foresters Friendly Society
Financial results for 2007 - Foresters Friendly Society

Create successful ePaper yourself
Turn your PDF publications into a flip-book with our unique Google optimized e-Paper software.
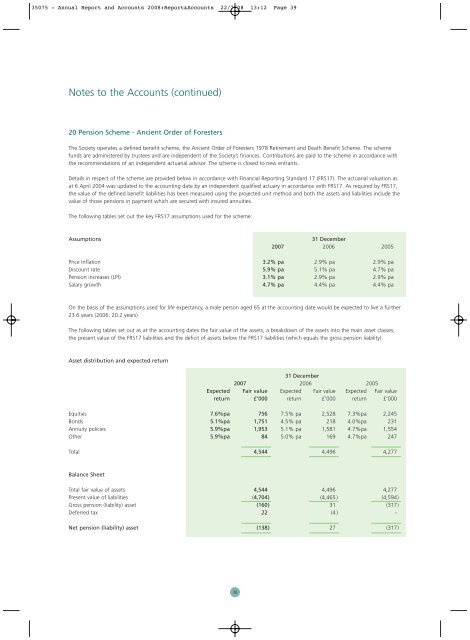
35075 - Annual Report and Accounts 2008:Report&Accounts 22/7/08 13:12 Page 39Notes to the Accounts (continued)20 Pension Scheme - Ancient Order of <strong>Foresters</strong>The <strong>Society</strong> operates a defined benefit scheme, the Ancient Order of <strong>Foresters</strong> 1978 Retirement and Death Benefit Scheme. The schemefunds are administered by trustees and are independent of the <strong>Society</strong>’s finances. Contributions are paid to the scheme in accordance withthe recommendations of an independent actuarial advisor. The scheme is closed to new entrants.Details in respect of the scheme are provided below in accordance with <strong>Financial</strong> Reporting Standard 17 (FRS17). The actuarial valuation asat 6 April 2004 was updated to the accounting date by an independent qualified actuary in accordance with FRS17. As required by FRS17,the value of the defined benefit liabilities has been measured using the projected unit method and both the assets and liabilities include thevalue of those pensions in payment which are secured with insured annuities.The following tables set out the key FRS17 assumptions used <strong>for</strong> the scheme:Assumptions31 December<strong>2007</strong> 2006 2005Price Inflation 3.2% pa 2.9% pa 2.9% paDiscount rate 5.9% pa 5.1% pa 4.7% paPension increases (LPI) 3.1% pa 2.9% pa 2.9% paSalary growth 4.7% pa 4.4% pa 4.4% paOn the basis of the assumptions used <strong>for</strong> life expectancy, a male person aged 65 at the accounting date would be expected to live a further23.6 years (2006: 20.2 years).The following tables set out as at the accounting dates the fair value of the assets, a breakdown of the assets into the main asset classes,the present value of the FRS17 liabilities and the deficit of assets below the FRS17 liabilities (which equals the gross pension liability).Asset distribution and expected return31 December<strong>2007</strong> 2006 2005Expected Fair value Expected Fair value Expected Fair valuereturn £’000 return £’000 return £’000Equities 7.6%pa 756 7.5% pa 2,528 7.3%pa 2,245Bonds 5.1%pa 1,751 4.5% pa 218 4.0%pa 231Annuity policies 5.9%pa 1,953 5.1% pa 1,581 4.7%pa 1,554Other 5.9%pa 84 5.0% pa 169 4.7%pa 247Total 4,544 4,496 4,277Balance SheetTotal fair value of assets 4,544 4,496 4,277Present value of liabilities (4,704) (4,465 ) (4,594)Gross pension (liability) asset (160) 31 (317)Deferred tax 22 (4 ) -Net pension (liability) asset (138) 27 (317)38