Causal Loop Diagram - the Department of Computer Science!
Causal Loop Diagram - the Department of Computer Science!
Causal Loop Diagram - the Department of Computer Science!
Create successful ePaper yourself
Turn your PDF publications into a flip-book with our unique Google optimized e-Paper software.
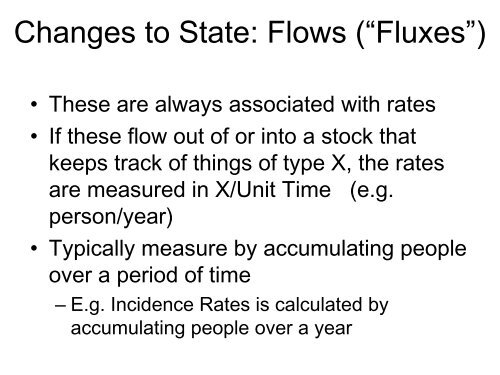
Changes to State: Flows (“Fluxes”)• These are always associated with rates• If <strong>the</strong>se flow out <strong>of</strong> or into a stock thatkeeps track <strong>of</strong> things <strong>of</strong> type X, <strong>the</strong> ratesare measured in X/Unit Time (e.g.person/year)• Typically measure by accumulating peopleover a period <strong>of</strong> time– E.g. Incidence Rates is calculated byaccumulating people over a year


