AEB Presentation - Thatcham Motor Insurance Repair Research ...
AEB Presentation - Thatcham Motor Insurance Repair Research ...
AEB Presentation - Thatcham Motor Insurance Repair Research ...

Create successful ePaper yourself
Turn your PDF publications into a flip-book with our unique Google optimized e-Paper software.
<strong>AEB</strong><br />
TTest t Development<br />
D l t<br />
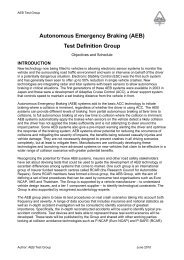
Autonomous Emergency Braking
Agenda g<br />
� <strong>AEB</strong> Test T t Group G<br />
� CCar-to-Pedestrian t P d t i (CP) (CP):<br />
– Accidentology<br />
– Test Scenarios<br />
– Test Target & Propulsion<br />
� Car-to-Car Rear (CCR):<br />
– Accidentology<br />
– Test Scenarios<br />
– Test Target g & Propulsion p<br />
� Car-to-Car Head-On (CHO):<br />
– Accidentology<br />
� Metrics & Ratings<br />
� Conclusions<br />
2
Agenda g<br />
� <strong>AEB</strong> TTest t GGroup<br />
� CCar-to-Pedestrian t P d t i (CP) (CP):<br />
– Accidentology<br />
– Test Scenarios<br />
– Test Target & Propulsion<br />
� Car-to-Car Rear (CCR):<br />
– Accidentology<br />
– Test Scenarios<br />
– Test Target g & Propulsion p<br />
� Car-to-Car Head-On (CHO):<br />
– Accidentology<br />
� Metrics & Ratings<br />
� Conclusions<br />
3
<strong>AEB</strong> Test Group<br />
Rationale for Group<br />
� <strong>AEB</strong> systems are becoming more widely available<br />
� Pedestrian protection is a significant issue<br />
�� Technology is available to address pedestrian casualties<br />
� Definition of standardised test procedures to encourage<br />
and d control t l such h systems t<br />
– to cover all aspects of societal impact: repair and material<br />
damage costs, costs injury and fatality costs<br />
4
<strong>AEB</strong> Test Group<br />
Terms of reference<br />
� IInternational t ti l group<br />
� Insurer and consumer perspective<br />
� Two year initial project (2009-2011)<br />
– Interrogate detailed accident data<br />
– Id Identify tif pre-crash h situations it ti relevant l t ffor current t <strong>AEB</strong> technology t h l<br />
� Focus on injury reduction – including whiplash and<br />
pedestrian collisions<br />
� Also covering<br />
– Material damage cost reduction<br />
– Appropriate positioning and<br />
mounting requirements for sensors<br />
to prevent increase in insurer costs<br />
following minor crash damage<br />
5
<strong>AEB</strong> Test Group<br />
Scope and aims<br />
� “To design and implement test procedures reflecting real<br />
world data that can encourage the development of<br />
autonomous braking technology that can help prevent or<br />
mitigate the effects of car-to-pedestrian and car-to-car<br />
crashes”<br />
CCar-to-Pedestrian t P d t i CCar-to-Car t C RRear CCar-to-Car t C HHead-On d O<br />
(CP)<br />
(CCR)<br />
(CHO)<br />
6
<strong>AEB</strong> Test Group<br />
Phase 1 Project Partners<br />
� Supported by:<br />
– Loughborough<br />
University<br />
(Vehicle Safety<br />
<strong>Research</strong> Centre)<br />
– 1 x OEM<br />
– 1 x Tier 1 supplier<br />
7
<strong>AEB</strong> Test Group<br />
Development and Implementation of Procedures<br />
� Incorporate provisional results from real world accident<br />
data to define test conditions<br />
� Define and specify test measurement equipment<br />
� Define test metrics<br />
� Define rating process<br />
� Author test procedures<br />
� Publish initial results/ratings to inform<br />
consumers/stakeholders of technology capability<br />
� Integrate into existing Consumer Test Programs (RCAR)<br />
� Off Offer to Euro NCAP C P-NCAP C ffor consideration for f future f<br />
test program<br />
8
<strong>AEB</strong> Test Group<br />
Milestones & Publications<br />
� Mil Milestones: t<br />
– Publish initial test concept early 2011<br />
– Feedback from industry<br />
– Validate with physical testing 2011<br />
– Finalise test procedures and equipment end 2011<br />
– Aim of undertaking full tests during 2012<br />
� Publications:<br />
– Test procedures<br />
p<br />
– Current status updates at technical conferences and industry<br />
meetings<br />
– SSupporting ti materials t i l will ill iinclude l d presentations, t ti ttest t<br />
documentation, test videos and others<br />
– www.thatcham.org/<strong>AEB</strong><br />
t atc a o g/<br />
9
Agenda g<br />
� <strong>AEB</strong> Test T t Group G<br />
� CCar-to-Pedestrian t P d t i (CP): (CP)<br />
– Accidentology<br />
– Test Scenarios<br />
– Test Target & Propulsion<br />
� Car-to-Car Rear (CCR):<br />
– Accidentology<br />
– Test Scenarios<br />
– Test Target g & Propulsion p<br />
� Car-to-Car Head-On (CHO):<br />
– Accidentology<br />
� Metrics & Ratings<br />
� Conclusions<br />
10
Accidentology Study<br />
Introduction<br />
� DData t analysis l i and d report t authoring th i ffrom LLoughborough hb h UUniversity i it<br />
using GB accident data:<br />
– OTS<br />
– STATS 19<br />
� Data analysis from the German Insurers Accident <strong>Research</strong> (UDV)<br />
and <strong>Insurance</strong> Institute for Highway Safety (IIHS)<br />
� Review of other worldwide data and accidentology studies<br />
– Japan, p , Australia, , China<br />
� Examples of factors under investigation:<br />
– Frequency of collisions<br />
– Road layouts<br />
– Speeds<br />
– Typical pre-accident pre accident causation factors<br />
– Sight lines<br />
– Mitigating factors (parked cars, complex intersections etc.)<br />
11
Accidentology gy<br />
Introduction: UK data study<br />
� Aim to define common accident scenarios<br />
– pedestrian accidents<br />
– rear-end impacts<br />
– head-on impacts<br />
� Source materials<br />
– STATS 19 national accident database<br />
– On-the-Spot in-depth accident database<br />
STATS 19<br />
2008<br />
Great Britain<br />
National statistics<br />
Police<br />
Police reports<br />
All casualty accidents<br />
170,000+ accidents<br />
On-the-Spot (OTS)<br />
2000–2009<br />
South Notts and Thames Valley<br />
2010 casualty reduction targets<br />
<strong>Research</strong> teams<br />
At-scene investigations<br />
Police Police-attended attended accidents (8 hours daily)<br />
500 accidents per year<br />
12
Accidentology gy<br />
Introduction<br />
� Overlap of cases in STATS 19 and OTS<br />
– STATS 19 wider region for shorter period (2008)<br />
– OTS narrower region for wider period (2000–09)<br />
– Limited overlap of cases<br />
Region<br />
South Notts<br />
Thames Valley<br />
PPeriod i d<br />
STATS 19<br />
OTS<br />
13
Accidentology gy<br />
Introduction<br />
� Flow of work<br />
STATS 19<br />
OTS<br />
Source<br />
databases<br />
Computer<br />
logic<br />
stats19<br />
Cluster<br />
analysis<br />
Detailed<br />
Cluster<br />
case<br />
ots analysis<br />
reviews<br />
Preparation<br />
Summary<br />
datasets<br />
Clusters<br />
Scenarios<br />
14
Accidentology gy<br />
Methodology<br />
� Cluster analysis<br />
– mathematical grouping of data points<br />
1<br />
2<br />
3<br />
4 5<br />
2-dimensional space<br />
Dendrogram<br />
15
Accidentology gy<br />
Methodology<br />
� Distance between accident records (dissimilarity)<br />
– numerical values<br />
– nominal, ordinal and scalar types<br />
nominal<br />
nominal<br />
ordinal<br />
ordinal<br />
scalar<br />
scalar<br />
Record eco d 1 Record eco d 2 Distance sta ce<br />
1<br />
3<br />
0.0<br />
1.00<br />
0.2<br />
1.0<br />
Daylight<br />
Turning*<br />
10–30mph 10 30mph<br />
Adult male<br />
50km/h<br />
11m<br />
1<br />
1<br />
1.0<br />
0.67<br />
0.8<br />
0.0<br />
Daylight<br />
Going ahead<br />
60–70mph 60 70mph<br />
Adult female<br />
80km/h<br />
3m<br />
Pedestrian age-sex age sex (ordinal)<br />
Vehicle speed km/h (scale)<br />
0–7 y 8–15 y Female Male 40 50 80 90<br />
0 0.33 0.67 1.0 0 0.2 0.8 1.0<br />
0.00<br />
1.00<br />
1.00<br />
0.33<br />
0.60<br />
1.00<br />
3.93<br />
16
Accidentology gy<br />
Methodology<br />
� Distance between clusters<br />
– ‘Average of distances’ used<br />
Closest points Farthest points points Average of distances<br />
17
Accidentology gy<br />
STATS 19 — Pedestrian clusters<br />
Aim for 4-6<br />
clusters<br />
≥75% of cases<br />
Example<br />
Cluster 1<br />
• 39% of cases<br />
• Lower speeds<br />
• Daylight<br />
• Fine weather<br />
• Going ahead<br />
• Children<br />
Green cells:<br />
over-represented<br />
• Crossing from left<br />
99 5% in χ • Not masked<br />
2 99.5% in χ test<br />
• Not masked<br />
18
Accidentology gy<br />
OTS — Pedestrian location (1 sec) N=175<br />
Lateral disstance<br />
(m)<br />
5.0<br />
4.0<br />
3.0<br />
2.0<br />
1.0<br />
-1.0<br />
Visible<br />
Not visible<br />
00 0.0<br />
0 5 10 15 20 25 30<br />
-2.0<br />
-3.0<br />
-4.0<br />
-5.0<br />
Forward distance (m)<br />
19
Accidentology gy<br />
OTS — Pedestrian clusters<br />
20
Accidentology gy<br />
Pedestrian scenario 1<br />
21
Accidentology gy<br />
Pedestrian scenario 2<br />
22
Accidentology gy<br />
� Direct link between accident data and clusters<br />
– mathematical computation<br />
– objective and reproducible<br />
– representativeness clearly defined<br />
� Remarkable parallels in STATS 19 and OTS<br />
– pedestrian baseline and obscured scenarios<br />
– rear-end stationary and moving scenarios<br />
– estimate of representativeness<br />
� Innovative approach and fresh results<br />
23
Simulation Example: p Collision<br />
Car-to-Pedestrian Case 1<br />
� Ub Urban road d<br />
environment:<br />
– Residential area area,<br />
daylight, fine weather<br />
� VW Golf:<br />
– Travel speed 50km/h<br />
– Impact speed 50km/h<br />
� Pedestrian:<br />
– Walking; no sight<br />
obstruction<br />
– 22 year old male<br />
– Height 1.8m, weight<br />
80 kg<br />
– Serious injury<br />
24
Simulation Example: p <strong>AEB</strong><br />
Car-to-Pedestrian Case 1<br />
� AAssume <strong>AEB</strong> <strong>AEB</strong> fitt fitted: d<br />
– Activation at time to<br />
collision (TTC) 1.6<br />
seconds (this is the<br />
time before the actual<br />
impact)<br />
� VW Golf:<br />
– Travel speed 50km/h<br />
– Braking 0.8g<br />
� Pedestrian:<br />
– Walking 5km/h<br />
� Vehicle stops 0.3m<br />
bbefore f impact i<br />
25
Simulation Example: p Collision<br />
Car-to-Pedestrian Case 2<br />
� Ub Urban road d<br />
environment:<br />
– Residential area area,<br />
daylight, fine weather<br />
� Ford Focus:<br />
– Travel speed 50km/h<br />
– Impact speed 50km/h<br />
� Pedestrian:<br />
– Walking—parked cars<br />
on side of road<br />
– 12 year old male<br />
– Height 1.67m, weight,<br />
61 kg<br />
– Serious injury<br />
26
Simulation Example: p <strong>AEB</strong><br />
Car-to-Pedestrian Case 2<br />
� AAssume <strong>AEB</strong> <strong>AEB</strong> fitt fitted: d<br />
– Activation at time to<br />
collision (TTC) 1.6<br />
seconds (this is the<br />
time before the actual<br />
impact)<br />
� Ford Focus:<br />
– Travel speed 50km/h<br />
– Braking 0.8g<br />
� Pedestrian:<br />
– Walking 5km/h<br />
� Vehicle stops 0.3m<br />
bbefore f impact i<br />
27
Simulation Example: p Collision<br />
Car-to-Pedestrian Case 3<br />
� Ub Urban road d<br />
environment:<br />
– Residential area area,<br />
daylight, fine weather<br />
� VW Golf:<br />
– Travel speed 50km/h<br />
– Impact speed 35km/h<br />
� Pedestrian:<br />
– Running on pavement;<br />
no sight obstructions<br />
– Crosses road<br />
diagonally<br />
– 21 year old male<br />
– Height 1.9m, weight<br />
80 kg<br />
– Injured<br />
28
Simulation Example: p <strong>AEB</strong><br />
Car-to-Pedestrian Case 3<br />
� AAssume <strong>AEB</strong> <strong>AEB</strong> fitt fitted: d<br />
– Activation at time to<br />
collision (TTC) 1.6<br />
seconds (this is the<br />
time before the actual<br />
impact)<br />
� MINI:<br />
– Travel speed 50km/h<br />
– Braking 0.8g<br />
� Pedestrian:<br />
– Running 12km/h<br />
� Vehicle stops 0.2m<br />
bbefore f impact i<br />
29
Simulation Example: p Collision<br />
Car-to-Pedestrian Case 4<br />
� Ub Urban road d<br />
environment:<br />
– Residential area area, dark dark,<br />
raining<br />
� Peugeot 306:<br />
– Travel speed 50km/h<br />
– Impact speed 23km/h<br />
� Pedestrian:<br />
– Walking—obscured by<br />
moving vehicle<br />
– 28 year old female<br />
– Height 1.6m, weight<br />
64 kg<br />
– Serious injury<br />
30
Simulation Example: p <strong>AEB</strong><br />
Car-to-Pedestrian Case 4<br />
� AAssume <strong>AEB</strong> <strong>AEB</strong> fitt fitted: d<br />
– Activation at time to<br />
collision (TTC) 1.0<br />
seconds (this is the<br />
time before the actual<br />
impact)<br />
� Peugeot 306:<br />
– Travel speed 50km/h<br />
– Braking 0.8g<br />
� Pedestrian:<br />
– Walking 6km/h<br />
� Vehicle stops 0.6m<br />
bbefore f impact i<br />
31
<strong>AEB</strong> Test Concepts p<br />
Car to Pedestrian (CP)<br />
� Pedestrian walks from<br />
nearside pavement into<br />
path of car travelling along<br />
road<br />
� Pedestrian walks from<br />
nearside id pavement t ffrom<br />
behind an obstruction into<br />
path of car travelling along<br />
road<br />
Provisional/DRAFT only<br />
32
<strong>AEB</strong> Test Concepts p<br />
Car to Pedestrian (CP)<br />
� PPedestrian d t i runs ffrom ffar<br />
side pavement into path of<br />
car travelling g along g road<br />
� Pedestrian walking along<br />
near side of carriageway in<br />
path of car travelling along<br />
road<br />
Provisional/DRAFT only<br />
33
<strong>AEB</strong> Test Concepts p<br />
Car to Pedestrian (CP)<br />
� Pedestrian walks across<br />
junction from near side<br />
pavement into path of car<br />
turning towards far side<br />
into junction<br />
Provisional/DRAFT only<br />
34
<strong>AEB</strong> Test Example p<br />
Car to Pedestrian (CP)<br />
� WWalking lki pedestrian d t i approaching hi ffrom near side id<br />
� Range of test speeds from 10 to 60km/h<br />
� SSpeed d iincreased d iin 10k 10km/h /h increments i t if<br />
system avoids collision with pedestrian<br />
� Speed increased in 5km/h increments if<br />
collision occurs<br />
� Quarter car width and half car width impact p<br />
positions between test car and pedestrian with<br />
no <strong>AEB</strong><br />
� GGoal l – obtain bt i <strong>AEB</strong> system t performance f curve<br />
at multiple impact positions over a range of<br />
speeds to quantify system performance<br />
� Then perform additional scenarios at a reduced<br />
number of speeds to investigate system<br />
robustness<br />
Provisional/DRAFT only<br />
35
Test Target g and Propulsion p<br />
Car-to-Pedestrian (CP) initial development<br />
36
Test Target g and Propulsion p<br />
Car-to-Pedestrian (CP)<br />
� Adult 50th percentile male<br />
� ~12 year y old child<br />
� 3 dimensional<br />
� Easily recognisable as a walking human<br />
�� Human proportions<br />
� Travel speed up to 15km/h<br />
� Appropriate pp p whole body y radar cross section<br />
� Appropriate thermal signature<br />
� Minimal foot to ground separation<br />
�� Typical clothing – shirt and trousers<br />
� Repeatedly impactable at up to 50km/h<br />
� Considerations for vision systems y<br />
– Colour of clothing and contrast with background<br />
– Motion of leg and/or arm<br />
� Autonomously controlled rather than suspended from gantry<br />
37
Agenda g<br />
� <strong>AEB</strong> Test T t Group G<br />
� CCar-to-Pedestrian t P d t i (CP) (CP):<br />
– Accidentology<br />
– Test Scenarios<br />
– Test Target & Propulsion<br />
� Car-to-Car Rear (CCR):<br />
– Accidentology<br />
– Test Scenarios<br />
– Test Target g & Propulsion p<br />
� Car-to-Car Head-On (CHO):<br />
– Accidentology<br />
� Metrics & Ratings<br />
� Conclusions<br />
38
Accidentology gy<br />
STATS 19 — Rear-end clusters<br />
Aim for 4-6<br />
clusters<br />
≥75% of cases<br />
Example<br />
Cluster 1<br />
• 30% of cases<br />
• Lower speeds<br />
• At junction<br />
•Daylight yg<br />
• Fine weather<br />
• Veh A going ahead<br />
Green cells:<br />
over-represented<br />
• Veh B stop/starting<br />
99 5% in χ • Following traffic<br />
2 99.5% in χ test<br />
• Following traffic<br />
39
Accidentology gy<br />
OTS — Rear-end vehicle speeds N=50<br />
40
Accidentology gy<br />
OTS — Rear-end clusters<br />
41
Accidentology gy<br />
Car-to-Car Rear Scenario 1<br />
42
Accidentology gy<br />
Car-to-Car Rear Scenario 2<br />
43
Simulation Example: p Collision<br />
Car-to-Car Rear Case 1<br />
� RRural l road d<br />
environment:<br />
– Crossroad junction, junction<br />
daylight, fine<br />
� Volvo S70 (striking):<br />
– Too close behind;<br />
driver does not react<br />
in time<br />
– Travel speed 30km/h<br />
– Impact speed 26km/h<br />
� Audi A4 (struck):<br />
– Slowing on approach<br />
tto junction j ti<br />
– Travel speed 30km/h<br />
– Impact speed 20km/h<br />
44
Simulation Example: p <strong>AEB</strong><br />
Car-to-Car Rear Case 1<br />
� AAssume <strong>AEB</strong> <strong>AEB</strong> fitt fitted: d<br />
– Activation at time to<br />
collision (TTC) 1.0<br />
seconds (this is the<br />
time before the actual<br />
impact)<br />
� Volvo S70 (striking):<br />
– Travel speed 50km/h<br />
– Braking 0.8g<br />
– Impact speed 20km/h<br />
� Audi A4 (struck):<br />
– Travel speed 50km/h<br />
– Braking 0.35g<br />
– Speed at impact<br />
3km/h<br />
� Mitigation of impact<br />
severity 45
Simulation Example: p Collision<br />
Car-to-Car Rear Case 2<br />
� RRoad d environment: i t<br />
– T-junction, daylight,<br />
fine<br />
� VW Passat (striking):<br />
– Approaching g row of<br />
cars at junction<br />
– Travel speed 80km/h<br />
– IImpact t speed d 55km/h 55k /h<br />
� Toyota Yaris (struck):<br />
– Travel speed 50km/h<br />
– Impact speed 11km/h<br />
� Ford Focus & BMW 1<br />
Series (secondary):<br />
– Travel speed 50km/h<br />
– Impact speed 0km/h<br />
46
Simulation Example: p <strong>AEB</strong><br />
Car-to-Car Rear Case 2<br />
� AAssume <strong>AEB</strong> <strong>AEB</strong> fitt fitted: d<br />
– Activation at time to<br />
collision (TTC) 1.6<br />
seconds at 0.4g<br />
– Activation at time to<br />
collision lli i (TTC) 0.6 0 6<br />
seconds at 0.8g<br />
� VW Passat (striking):<br />
– Travel speed 50km/h<br />
� Other vehicles<br />
unchanged:<br />
– Travel speed 50km/h<br />
– BBraking ki 00.35g 35<br />
� VW Passat stops 0.3m<br />
behind Toyota Yaris<br />
47
Simulation Example: p Collision<br />
Car-to-Car Rear Case 3<br />
� Ub Urban road denvironment: i t<br />
– T-junction, daylight, fine<br />
�� Honda Accord (striking):<br />
– Following too close<br />
behind BMW<br />
– Travel speed 50km/h<br />
– Impact speed 45km/h<br />
� BMW 3 Series (struck):<br />
– Travel speed 50km/h<br />
– Impact speed 28km/h<br />
� Ford Focus & Audi A4<br />
(secondary):<br />
– Travel speed 45km/h<br />
– Impact speed 0km/h<br />
48
Simulation Example: p <strong>AEB</strong><br />
Car-to-Car Rear Case 3<br />
� AAssume <strong>AEB</strong> <strong>AEB</strong> fitt fitted: d<br />
– Activation at time to<br />
collision (TTC) 1.6<br />
seconds at 0.4g<br />
– Activation at time to<br />
collision lli i (TTC) 0.6 0 6<br />
seconds at 0.8g<br />
� Honda Accord<br />
(striking):<br />
– Travel speed 50km/h<br />
� BMW 3 Series (struck):<br />
– Travel speed 50km/h<br />
– BBraking ki 00.35g 35<br />
� Honda stops 0.3m<br />
behind BMW<br />
49
<strong>AEB</strong> Test Concepts p<br />
Car to Car Rear (CCR)<br />
� Car drives longitudinally<br />
toward rear of proceeding<br />
car which is stationary<br />
� Car drives longitudinally<br />
toward rear of proceeding<br />
car which is travelling at a<br />
slower speed<br />
Provisional/DRAFT only<br />
50
<strong>AEB</strong> Test Concepts p<br />
Car-to-Car Rear (CCR)<br />
� Car drives longitudinally<br />
toward rear of proceeding<br />
car which brakes<br />
� Car drives toward rear of<br />
proceeding car which is<br />
stationary and obscured<br />
around a bend<br />
Provisional/DRAFT only<br />
51
<strong>AEB</strong> Test Example p<br />
Car-to-Car Rear (CCR)<br />
� RRange of f ttest t speeds d from f 10 to t 60km/h 60k /h<br />
� Speed increased in 10km/h increments if<br />
system avoids collision with car target<br />
� Speed increased in 5km/h increments if<br />
collision occurs<br />
� 100% overlap, possibly repeat test with smaller<br />
overlap<br />
� Goal – obtain <strong>AEB</strong> system performance curve<br />
at multiple impact positions over a range of<br />
speeds to quantify system performance<br />
� Then perform additional scenarios at a reduced<br />
number of speeds to investigate system<br />
robustness<br />
Provisional/DRAFT only<br />
52
Test Target g and Propulsion p<br />
Car-to-Car Rear (CCR) initial development<br />
53
Test target g and propulsion<br />
p p<br />
Car-to-Car Rear (CCR)<br />
� Representative of typical passenger car<br />
� 3 dimensional<br />
� Appropriate whole body radar cross section<br />
� Appropriate pp p pproperties p for vision systems y<br />
– Body structure, windows, lights, license plate etc.<br />
– Under body shadow<br />
� TTravel l speed d up tto 80k 80km/h /h<br />
� Control to follow defined path and modulate speed appropriately<br />
� Instrumentation communicating with test vehicle and data acquisition<br />
� Repeatedly impactable at speeds up to 50km/h<br />
� Operational p for a day y of testing g or capable p of fast charge g to top-up p p<br />
54
Test Target g and Propulsion p<br />
Car Crash Target<br />
55
Agenda g<br />
� <strong>AEB</strong> Test T t Group G<br />
� CCar-to-Pedestrian t P d t i (CP) (CP):<br />
– Accidentology<br />
– Test Scenarios<br />
– Test Target & Propulsion<br />
� Car-to-Car Rear (CCR):<br />
– Accidentology<br />
– Test Scenarios<br />
– Test Target g & Propulsion p<br />
� Car-to-Car Head-On (CHO):<br />
– Accidentology<br />
� Metrics & Ratings<br />
� Conclusions<br />
56
Car-to-Car Head-On<br />
� Accidentology survey of UK data complete for head-on<br />
collisions<br />
� Simulation examples provided<br />
� Current vehicle technology gy does not address this type yp of<br />
collision, but is expected in near future<br />
� Car-to-Car Head-On test scenarios and procedure p will be<br />
developed after completion of work on CP and CCR<br />
– CHO planned p for 2012-2014<br />
57
Accidentology gy<br />
STATS 19 — Head-on clusters<br />
Aim for 4-6<br />
clusters<br />
≥75% of cases<br />
Green cells:<br />
over-represented<br />
99 5% in χ2 99.5% in χ test<br />
Example<br />
Cluster 1<br />
• 30% of cases<br />
• Lower speeds<br />
• At junction<br />
•Daylight yg<br />
• Fine weather<br />
• Veh A going ahead<br />
• Veh B turning<br />
58
Accidentology gy<br />
OTS — Accident Configuration and type<br />
59
Accidentology gy<br />
OTS — Head-on clusters<br />
60
Simulation Example: p Collision<br />
Car-to-Car Head-On Case 1<br />
� RRural l road d<br />
environment:<br />
– Left hand bend bend,<br />
daylight, fine<br />
� Renault Clio (striking):<br />
– Speeding on bend,<br />
drifts out of lane<br />
– Travel speed 65km/h<br />
– Impact speed 40km/h<br />
� Vauxhall Astra (struck):<br />
– Travel speed 30km/h<br />
– Impact speed 18km/h<br />
61
Simulation Example: p <strong>AEB</strong><br />
Car-to-Car Head-On Case 1<br />
� AAssume <strong>AEB</strong> <strong>AEB</strong> fitt fitted: d<br />
– Activation at time to<br />
collision (TTC) 1.3<br />
seconds (this is the<br />
time before the actual<br />
impact)<br />
� Renault Clio (striking):<br />
– Travel speed 65km/h<br />
– Braking 0.8g<br />
– Impact speed 28km/h<br />
� Vauxhall Astra (struck):<br />
– Travel speed 30km/h<br />
– Braking 0.3g<br />
– Impact speed 18km/h<br />
�� Mitigation of impact<br />
severity<br />
62
Simulation Example: p Collision<br />
Car-to-Car Head-On Case 2<br />
� Ub Urban road d<br />
environment:<br />
– Daylight Daylight, fine<br />
� VW Golf (striking):<br />
– Overtaking g Mazda<br />
– Travel speed 75km/h<br />
– Impact speed 54km/h<br />
� Nissan X-Trail (struck):<br />
– Travel speed 50km/h<br />
– IImpact t speed d 31km/h 31k /h<br />
� Mazda 6 (overtaken):<br />
– Travel speed 40km/h<br />
– Impact speed 34km/h<br />
63
Simulation Example: p <strong>AEB</strong><br />
Car-to-Car Head-On Case 2<br />
� AAssume <strong>AEB</strong> <strong>AEB</strong> fitt fitted: d<br />
– Activation at time to<br />
collision (TTC) 1.0<br />
seconds (this is the<br />
time before the actual<br />
impact)<br />
� VW Golf (striking):<br />
– Travel speed 65km/h<br />
– Braking 0.8g<br />
– Impact speed 34km/h<br />
� Nissan X-Trail (struck):<br />
– Travel speed 50km/h<br />
– Braking 0.35g<br />
– Impact speed 29km/h<br />
�� Mitigation of impact<br />
severity<br />
64
Simulation Example: p Collision<br />
Car-to-Car Head-On Case 3<br />
� RRural l road d<br />
environment:<br />
– Dark Dark, raining<br />
� Ford Ka (striking):<br />
– Lost control on bend<br />
at speed and crossed<br />
carriageway<br />
– Travel speed 98km/h<br />
– Impact speed 48km/h<br />
� Audi A3 (struck):<br />
– Travel speed 50km/h<br />
– Impact speed 30km/h<br />
65
Simulation Example: p <strong>AEB</strong><br />
Car-to-Car Head-On Case 3<br />
� AAssume <strong>AEB</strong> <strong>AEB</strong> fitt fitted: d<br />
– Activation at time to<br />
collision (TTC) 1.6<br />
seconds at 0.4g<br />
– Activation at time to<br />
collision lli i (TTC) 0.6 0 6<br />
seconds at 0.8g<br />
� Ford Ka (striking):<br />
– Travel speed 98km/h<br />
– Impact speed 33km/h<br />
� Audi A3 (struck):<br />
– Travel speed 50km/h<br />
– Braking 0.3g<br />
– Impact speed 30km/h<br />
�� Mitigation of impact<br />
severity<br />
66
Agenda g<br />
� <strong>AEB</strong> Test T t Group G<br />
� CCar-to-Pedestrian t P d t i (CP) (CP):<br />
– Accidentology<br />
– Test Scenarios<br />
– Test Target & Propulsion<br />
� Car-to-Car Rear (CCR):<br />
– Accidentology<br />
– Test Scenarios<br />
– Test Target g & Propulsion p<br />
� Car-to-Car Head-On (CHO):<br />
– Accidentology<br />
� Metrics & Ratings<br />
� Conclusions<br />
67
Metrics & Ratings g<br />
� Wh Whether th or not t the th collision lli i was avoided id d<br />
� The speed reduction prior to collision<br />
� When (if present) a warning is given<br />
� How an appropriate driver braking response at the time<br />
of f warning i (if present) t) could ld have h affected ff t d the th outcome t<br />
� Identify system performance curve for avoidance and<br />
mitigation<br />
� Correlate with injury risk curves to estimate potential<br />
bbenefit fit<br />
68
Agenda g<br />
� <strong>AEB</strong> Test T t Group G<br />
� CCar-to-Pedestrian t P d t i (CP) (CP):<br />
– Accidentology<br />
– Test Scenarios<br />
– Test Target & Propulsion<br />
� Car-to-Car Rear (CCR):<br />
– Accidentology<br />
– Test Scenarios<br />
– Test Target g & Propulsion p<br />
� Car-to-Car Head-On (CHO):<br />
– Accidentology<br />
� Metrics & Ratings<br />
� Conclusions<br />
69
Conclusions<br />
� <strong>AEB</strong> Test Group formed to address the need for <strong>AEB</strong><br />
test procedures<br />
� Small dynamic y ggroup p initially, y with consultation and<br />
feedback from industry<br />
� Representing p g consumer and insurer needs<br />
� Collaborating with other projects (vFSS, ASSESS etc.)<br />
– Development of pedestrian and car test targets<br />
– Soft Crash Target Vehicle?<br />
– Robust pedestrian?<br />
� Euro NCAP road map for inclusion of <strong>AEB</strong> test within<br />
vehicle rating system in 2013<br />
� <strong>AEB</strong> Test Group output defining reference<br />
70
Conclusions<br />
� Test procedures developed from real world data<br />
� Initial development tests undertaken proving concept and<br />
assessment<br />
� Test concepts published early 2011<br />
� Finalise testing and development throughout 2011<br />
� Undertake full tests in 2012 and publish p results<br />
71
<strong>AEB</strong><br />
TTest t Development<br />
D l t<br />
www.thatcham.org/<strong>AEB</strong>