1999 IMRF Comprehensive Annual Financial Report
1999 IMRF Comprehensive Annual Financial Report
1999 IMRF Comprehensive Annual Financial Report

Create successful ePaper yourself
Turn your PDF publications into a flip-book with our unique Google optimized e-Paper software.
Illinois MunicipalRetirement Fund<strong>1999</strong><strong>Comprehensive</strong> <strong>Annual</strong> <strong>Financial</strong> <strong>Report</strong>For the year ended December 31, <strong>1999</strong>
“To efficiently and impartially<strong>IMRF</strong> Mission Statementdevelop, implement, and administerin a prudent mannerprograms that provide income protectionto members and their beneficiarieson behalf of participating employers.”Illinois MunicipalRetirement Fund<strong>1999</strong> <strong>Comprehensive</strong><strong>Annual</strong> <strong>Financial</strong> <strong>Report</strong>For the year ended December 31, <strong>1999</strong>Prepared by:The Finance Department of theIllinois Municipal Retirement Fund2211 York RoadSuite 500Oak Brook, IL 60523-2374Robert CusmaExecutive DirectorIllinois Municipal Retirement Fund 2
Table of ContentsIntroductionBoard of Trustees . . . . . . . . . . . . . . . . . . . . . . . . . . . . . . . . . . . . . . . . . . . . . 4Organization Chart and Consultants . . . . . . . . . . . . . . . . . . . . . . . . . . . . . . . 5Certificate of Achievement . . . . . . . . . . . . . . . . . . . . . . . . . . . . . . . . . . . . . . 6Transmittal Letter . . . . . . . . . . . . . . . . . . . . . . . . . . . . . . . . . . . . . . . . . . . . 7Revenue Charts . . . . . . . . . . . . . . . . . . . . . . . . . . . . . . . . . . . . . . . . . . . . . . 13<strong>Financial</strong>Independent Auditor’s <strong>Report</strong> . . . . . . . . . . . . . . . . . . . . . . . . . . . . . . . . . . . . 16<strong>Financial</strong> StatementsStatements of Plan Net Assets . . . . . . . . . . . . . . . . . . . . . . . . . . . . . . . . . 17Statements of Changes in Plan Net Assets . . . . . . . . . . . . . . . . . . . . . . . . 18Notes to <strong>Financial</strong> Statements . . . . . . . . . . . . . . . . . . . . . . . . . . . . . . . . . 19Required Supplementary InformationSchedule of Funding Progress . . . . . . . . . . . . . . . . . . . . . . . . . . . . . . . 29Schedule of Employer Contributions . . . . . . . . . . . . . . . . . . . . . . . . . . 29Notes to Required Supplementary Information . . . . . . . . . . . . . . . . . . 30Supplementary InformationSchedule of Administrative Expenses . . . . . . . . . . . . . . . . . . . . . . . . . . 31Schedule of Payments to Consultants . . . . . . . . . . . . . . . . . . . . . . . . . . 31Schedule of Investment Expenses . . . . . . . . . . . . . . . . . . . . . . . . . . . . . 31InvestmentsInvestment Consultant’s <strong>Report</strong> . . . . . . . . . . . . . . . . . . . . . . . . . . . . . . . . . . 34Master Trustee’s Certification . . . . . . . . . . . . . . . . . . . . . . . . . . . . . . . . . . . . 36Investment Portfolio Charts . . . . . . . . . . . . . . . . . . . . . . . . . . . . . . . . . . . . . 37Investment Consultants . . . . . . . . . . . . . . . . . . . . . . . . . . . . . . . . . . . . . . . . 38Investment Objectives and Policies . . . . . . . . . . . . . . . . . . . . . . . . . . . . . . . . 40Returns by Asset Class . . . . . . . . . . . . . . . . . . . . . . . . . . . . . . . . . . . . . . . . . 44Investment Summary . . . . . . . . . . . . . . . . . . . . . . . . . . . . . . . . . . . . . . . . . . 45Asset Allocation . . . . . . . . . . . . . . . . . . . . . . . . . . . . . . . . . . . . . . . . . . . . . . 46List of Largest Assets Held . . . . . . . . . . . . . . . . . . . . . . . . . . . . . . . . . . . . . . 47Schedules of Commissions and Fees . . . . . . . . . . . . . . . . . . . . . . . . . . . . . . . 483 Illinois Municipal Retirement Fund
ActuarialActuary’s Certification Letter . . . . . . . . . . . . . . . . . . . . . . . . . . . . . . . . . . . . 52Actuarial Assumptions . . . . . . . . . . . . . . . . . . . . . . . . . . . . . . . . . . . . . . . . . 54Solvency Test . . . . . . . . . . . . . . . . . . . . . . . . . . . . . . . . . . . . . . . . . . . . . . . . 55Members’ Average Salary and Service . . . . . . . . . . . . . . . . . . . . . . . . . . . . . . 55Table of ContentsChanges in the Number of Benefit Payments . . . . . . . . . . . . . . . . . . . . . . . . 56Contribution Rates . . . . . . . . . . . . . . . . . . . . . . . . . . . . . . . . . . . . . . . . . . . . 57Actuarial Balance Sheet and Analysis of Unfunded Liability . . . . . . . . . . . . . 58Derivation of Experience Gain (Loss) . . . . . . . . . . . . . . . . . . . . . . . . . . . . . . 59Summary of Benefits . . . . . . . . . . . . . . . . . . . . . . . . . . . . . . . . . . . . . . . . . . 60Changes in Plan Provisions . . . . . . . . . . . . . . . . . . . . . . . . . . . . . . . . . . . . . . 63StatisticalRevenue by Source . . . . . . . . . . . . . . . . . . . . . . . . . . . . . . . . . . . . . . . . . . . . 66Expenses by Type . . . . . . . . . . . . . . . . . . . . . . . . . . . . . . . . . . . . . . . . . . . . . 66Benefit Expenses by Type . . . . . . . . . . . . . . . . . . . . . . . . . . . . . . . . . . . . . . . 67Average Benefit Payment Amounts . . . . . . . . . . . . . . . . . . . . . . . . . . . . . . . . 68Participating Employers and Members . . . . . . . . . . . . . . . . . . . . . . . . . . . . . 69Participating Members’ Length of Service . . . . . . . . . . . . . . . . . . . . . . . . . . . 70Distribution of Current Annuitants by Pension Amount . . . . . . . . . . . . . . . . 70Analysis of Initial Retirement Benefits . . . . . . . . . . . . . . . . . . . . . . . . . . . . . 71Annuitants and Active Members by Age . . . . . . . . . . . . . . . . . . . . . . . . . . . . 72<strong>IMRF</strong> Staff . . . . . . . . . . . . . . . . . . . . . . . . . . . . . . . . . . . . . . . . . . . . . . . . . 73Illinois Municipal Retirement Fund 4
Board of TrusteesHeidi BaxterEmployee TrusteeKane County2000 President<strong>1999</strong> Vice PresidentJanuary 1, 1998 –December 31, 2000R. Steven SonnemakerExecutive TrusteePeoria County2000 Vice President<strong>1999</strong> SecretaryJanuary 1, 1998 –December 31, 2002John Lotus NovakExecutive TrusteeDuPage County2000 SecretaryJanuary 1, <strong>1999</strong> –December 31, 2003Max F. BochmannEmployee TrusteeNapervilleJanuary 1, 2000 –December 31, 2004Jack A. ClaesAnnuitant TrusteeElk Grove VillageJanuary 1, 1995 –December 31, 2000Gerald J. Sebesta, Jr.Executive TrusteeOak ParkJanuary 1, 1995 –December 31, 2000Thomas C. SetchellExecutive TrusteeHarveyJanuary 1, 1997 –December 31, 2001Marvin R. Shoop, Jr.Employee TrusteePeoria<strong>1999</strong> PresidentJanuary 1, 1996 –December 31, 2000Rita J. MiottiEmployee TrusteeMattesonJanuary 1, 1995 –December 31, <strong>1999</strong>Thank Youfor your dedicated serviceto the members andemployers of <strong>IMRF</strong>5 Illinois Municipal Retirement Fund
InvestmentConsultantsInvestmentManagersBOARD OF TRUSTEESMasterTrusteeCONSULTANTSMedicalConsultantsActuaryCertifiedPublicAccountantOrganization ChartSTAFFHuman ResourcesLinda BieniekExecutive DirectorRobert L. CusmaInternal AuditDouglas Samz, C.P.A.Chief <strong>Financial</strong> OfficerDeanna LockwoodDirectorOperations & PlanningDaniel DuquetteGeneral CounselLouis KosibaDirectorInvestmentsWalt KoziolAccountingPatricia HambrickManagerInformation ServicesArnold RohlwingManagerChief Legal CounselKathleen O’BrienInvestmentsEdward SambolManagerBenefitsTom RaittManagerField ServicesTerry O’ConnorManagerOffice ServicesDenise StreitManagerLegislative LiaisonNicholas YelvertonCommunicationsManagerLinda HorrellConsultants — (Investment Consultants are listed on page 37)Actuary Auditors Commercial Bank Medical AdvisorGabriel Roeder, Smith & Company McGladrey & Pullen Northern Trust Rehabilitation MedicineNorman L. Jones, F.S.A. Robert Thoma Richard Deeter, Vice President Clinic Inc.Brian Murphy, F.S.A. Mokena, Illinois Chicago, Illinois Oak Brook Terrace, IllinoisSouthfield, MichiganLeonard Kessler, M.D.Highland Park, IllinoisIllinois Municipal Retirement Fund 6
Certificate of Achievement7 Illinois Municipal Retirement Fund
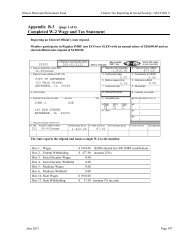
Illinois Municipal Retirement FundDrake Oak Brook Plaza Suite 500 2211 York Road Oak Brook IL 60523-2374 630-368-1010Service Representatives 1-800-ASK-<strong>IMRF</strong>www.imrf.orgBoard of Trustees: Heidi Baxter, President • R. Steven Sonnemaker, Vice President • John Lotus Novak,Secretary • Jack A. Claes • Max Bochmann • Gerald J. Sebesta, Jr. • Thomas C. Setchell • Marvin Shoop, Jr.Executive Director: Robert L. CusmaIntroductionMay 28, <strong>1999</strong>Board of Trustees andExecutive DirectorIllinois Municipal Retirement FundOak Brook, IllinoisThis is the comprehensive annual financial report of the Illinois Municipal Retirement Fund for the year endedDecember 31, <strong>1999</strong>. The report has five sections. The Introductory Section contains this transmittal letter andorganization charts. The <strong>Financial</strong> Section contains the report of the independent public accountants as well as thefinancial statements and notes. The Investment Section contains summaries of investments held and the reports ofthe investment consultant and master trustee. The Actuarial Section contains the report of the actuary, a descriptionof the actuarial assumptions, a summary of benefits, and various ratios and tables. The Statistical Section containsvarious tables describing the Fund. The management of <strong>IMRF</strong> is responsible for the compilation and accuracy ofthe financial, actuarial, investment, and statistical information contained in this report.The Illinois State Legislature established <strong>IMRF</strong> in 1939. We began operation in 1941 in order to provideretirement, death, and disability benefits to employees of local units of government in Illinois. The Actuarial sectionof this report includes a summary of the benefits we provide. <strong>IMRF</strong> now serves 2,768 different employers, 155,517participating members, and 69,716 benefit recipients.RevenuesRevenues needed to fund benefits are accumulated through contributions and returns on invested funds.Contributions and net investment returns for <strong>1999</strong> totaled $3,260.6 million. This represents an increase ofapproximately 65 percent from 1998:in millions30002500200015001000500<strong>1999</strong> 1998 Increase/(Decrease)Revenues (millions) (millions) Amount % ChangeMember <strong>IMRF</strong> contributions $ 192.3 $ 190.3 $ 2.0 1.1%Employer <strong>IMRF</strong> contributions 379.2 364.2 15.0 4.1%Investment returns, net 2,689.1 1,416.2 1,272.9 89.9%$3,260.6 $1,970.7 $1,289.9 65.5%0<strong>1999</strong>1998Illinois Municipal Retirement Fund 8
IntroductionThe increase in member contributions is due to an increase in total member earnings to $3,933 million (Table I).The member contribution rate remained at 4.5 percent of earnings for Regular members, 6.5 percent for Sheriff ’sLaw Enforcement Personnel (SLEP), and 7.5 percent for the optional Elected County Officials (ECO) plan.The increase in employer contributions is the net effect of several factors. Member earnings increased overall by6 percent. This increase, combined with increased enrollment in ECO and higher average SLEP and ECO rates,caused employer contributions to increase. These factors were offset by lower average Regular rates. The averageRegular Plan employer rate decreased to 9.19 percent from 9.64 percent. The average SLEP Plan employer rateincreased to 14.02 percent from 13.94 percent. The average ECO Plan employer contribution rate increased to36.01 percent from the initial rate of 20.0 percent.In <strong>1999</strong>, appreciation in the value of investments was $2,389 million. This was a 112 percent increase from the$1,126 million recorded in 1998. Investment income increased by $90 million over 1998. Securities lendingincome net of related expenses was $5.7 million for <strong>1999</strong>, an increase over the $5.4 million for 1998. Directinvestment expenses increased from $40.4 million in 1998 to $43.3 million in <strong>1999</strong>.The total rate of return for the portfolio in <strong>1999</strong> was 20.93 percent compared to 12.63 percent in 1998. <strong>IMRF</strong>'sU.S. stock portfolio returned 29.61 percent compared to 21.05 percent for the S&P 500. The U.S. fixed incomeportfolio returned 0.28 percent compared to –0.83 percent for the Lehman Aggregate Index. Our internationalstock portfolio returned 40.17 percent compared to 31.01 percent for the EAFE (Europe, Australia, and Far East)50 Percent Hedged Index. The global fixed income portfolio returned –5.55 percent compared to –4.30 percent forthe Salomon World Government Bond Index. The real estate portfolio returned 2.76 percent compared to 12.76percent for the NCREIF Classic Property Index. The alternative investment portfolio returned 32.60 percent versusa target return of 15.00 percent per annum.When comparing returns it is important to remember that as a pension fund, <strong>IMRF</strong>’s investment program has avery long time horizon. Some of the longer-term results for the total fund are:PeriodThree yearsFive yearsTen years<strong>Annual</strong>ized returns16.41 percent per year17.27 percent per year12.29 percent per yearThe Investment Section of this report shows investment returns by asset class for <strong>1999</strong> as well as three-, five-, andten-year returns.ExpensesThe expenses paid by <strong>IMRF</strong> include benefit payments, refunds, and administrative expenses. Expenses for <strong>1999</strong>totaled $540.7 million, an increase of $45.6 million over 1998.in millions <strong>1999</strong> 1998 Increase/(Decrease)500Expenses (millions) (millions) Amount % Change400Benefits $496.4 $451.5 $ $44.9 9.9%300Refunds 28.1 27.1 1.0 3.7%200100Administrative expenses 16.2 16.5 (0.3) -1.8%0<strong>1999</strong>1998$540.7 $495.1 $45.6 9.2%The increase in benefit payments to members and beneficiaries resulted primarily from growth in the number ofannuitants to 69,716 (Table II) page 55.9 Illinois Municipal Retirement Fund
FundingIn <strong>1999</strong>, additions to net assets of $3,260.6 million exceeded deductions of $540.7 million by $2,719.9 million.This addition brought the Plan’s net asset base to $15.8 billion. To calculate employer contribution rates, <strong>IMRF</strong>’sactuary uses a five-year smoothed market-related value to determine the actuarial value of assets. The smoothingprevents extreme variations in employer contribution rates due to short-term fluctuations in the investmentmarkets. For the December 31, <strong>1999</strong>, valuation, the actuarial value of assets was $13.5 billion. The aggregateactuarial liability for all <strong>IMRF</strong> employers was $13 billion. The assets held currently fund 104 percent of thisliability. This is an increase over the funding ratio of 98.1 percent for 1998. The preceding ratios are for the fund asa whole. Under the Illinois Pension Code, each employer funds the pensions for its own employees. Funding ratiosfor individual employers and individual plans vary widely.Introduction<strong>IMRF</strong> members can look to the net asset base as assets that are irrevocably committed to the payment of theirpensions when they retire. The actuary has determined that the present net asset base, expected futurecontributions, and investment earnings thereon are sufficient to provide for full payment of future benefits underthe level payroll percentage method of funding. The Actuarial Section contains the actuary’s letter and furtherinformation on <strong>IMRF</strong>’s funding.InvestmentsThe investment portfolio is a major contributor to the Plan. In a year of double-digit returns, such as <strong>1999</strong>, itprovides an even larger percentage. In <strong>1999</strong>, net investment return provided 82 percent of total additions to the netassets. The employers contributed 12 percent and the employee members contributed 6 percent. The InvestmentSection of this report contains a summary of the portfolio.Currently, 38 professional investment management firms handling 60 separate accounts manage the investmentportfolio. These firms make investment decisions under the prudent expert rule authorized by state statutes and byinvestment policy guidelines adopted by the Board of Trustees. The Board employs two investment consultants tomonitor and evaluate the investment management firms’ performance, to aid in the selection of investmentmanagement firms and to assist in the development of investment policy. One consultant advises on real estateinvestments. The second advises on other asset allocations. Our uppermost goal is to optimize the long-term totalreturn of the Plan’s investments through a policy of diversification within a parameter of prudent risk as measuredon the total portfolio.The Investment Section contains a summary of <strong>IMRF</strong>’s investment performance, the Investment Consultant’sreport, and a summary of the investment objectives and policies.Current and Future Developmentsa. Board of TrusteesMax F. Bochmann, School Bus Mechanic for Naperville Community Unit School District Number 203, waselected as a member trustee. His five-year term began January 1, 2000.b. Qualified Illinois Domestic Relations OrdersThe General Assembly passed legislation, which became effective July 1, <strong>1999</strong>, allowing pension benefits to bedivided between divorced spouses. Previously, anti-alienation requirements prohibited <strong>IMRF</strong> pension benefitsfrom being divided as part of a divorce property settlement. <strong>IMRF</strong> has adapted its systems to handle these courtorders.c. Systems Development<strong>IMRF</strong> continues to enhance its automated systems to track data and pay claims. The first two phases of theautomated disability claims processing system were implemented. Other significant ongoing developmentprojects include a new member enrollment system and an updated purchase of service system.Illinois Municipal Retirement Fund 10
Introductiond. Tax Deferred Payroll Deduction Program (TPDP)Based on legislation passed in 1998 and with the cooperation of participating employers, we were able toimplement a program whereby active members may purchase past service credits through payroll deductions on atax deferred basis. Through the end of <strong>1999</strong>, more than 700 members have taken advantage of this program.e. Changes to the Elected County Officials Plan (ECO)The General Assembly passed legislation in <strong>1999</strong>, which was signed into law by the Governor in 2000, thatchanges provisions of the Elected County Officials Plan (ECO). The changes are:• The ECO benefit formula is limited to service in an elected county office.• The final rate of earnings is changed from the last salary to a four-year average calculated separately for eachoffice held.• Eight years of service in each office is required to qualify for an ECO formula.• Counties may opt out of the ECO Plan, prospectively.f. Investment ActivitiesThe Board of Trustees, consultants, and <strong>IMRF</strong> staff review the asset allocation annually. By diversifyinginvestment type (stocks, fixed income, real estate, etc.), region (domestic, international, global, etc.) andmanagement style (growth, value, small, medium, or large capitalization, etc.), we try to improve expected longtermreturns while maintaining an acceptable level of risk.Major investment activities for the year include:• Retained Investment Counselors of Maryland to manage a small capitalization value portfolio.• Retained Jacobs Levy Equity Management to manage a structured growth equity portfolio.• Retained NewBridge Partners to manage a large-capitalization growth equity portfolio.• Retained Northern Trust Quantitative Advisors to manage an S&P/BARRA Value Index portfolio.• Retained Northern Trust Quantitative Advisors to manage an EAFE Index portfolio.• Retained Oak Associates to manage a large capitalization growth equity portfolio.• Sold the Meridian Industrial Park in Aurora, Illinois.• Sold the Fleetway House and Friary Court office buildings in London.• Sold the Old Square shopping center in Bristol, U.K.Major investment activities occurring during the beginning of 2000 included:• Retained Wellington Management Company to manage a domestic fixed-income portfolio.• Retained BlackRock Inc. to manage an enhanced fixed-income index portfolio.g. Full FundingAfter years of striving to achieve full funding, <strong>IMRF</strong> achieved that goal in aggregate. The overfunding is a resultof strong investment returns over the last 10 years. Out of the over 3,000 rate groups, 56 percent have assets thatequal or exceed their actuarial liabilities. This happy event has posed new challenges unforeseen by the creatorsof <strong>IMRF</strong> in 1939. Our challenge now is to maintain both stable contribution rates and full funding of pensionbenefits without creating unnecessary financial burdens on employers. In March <strong>1999</strong> the Board established anew policy for determining employer contribution rates for fully funded employers. The policy considers thelevel of overfunding and the size of the employer. For most employers, any overfunded amounts are amortizedover a 10-year period. Large overfunded employers may choose a period shorter than 10 years. This policy wasimplemented with the 2000 employer rates.11 Illinois Municipal Retirement Fund
h. Year 2000As with many other organizations, <strong>IMRF</strong> had no significant problems with the turnover to the year 2000. OnJanuary 1, 2000, a group of <strong>IMRF</strong> employees tested our major computer systems to ensure that everythingwould be operational on January 3, the first business day of the new year. We are happy to report that, because ofthe foresight and planning of our staff, no problems were discovered.Introductioni. <strong>IMRF</strong>.org<strong>IMRF</strong> continues to add new functions to our web page, <strong>IMRF</strong>.org. In <strong>1999</strong>, we added a generic pensioncalculator, which allows members to estimate their pension benefits. We have also added an employerinformation function. Through a secure connection, employers may access information on their accountsincluding resolutions, rate and current contribution information, and member enrollment information. Newfunctions added in 2000 allow employers to file termination notices for their employees on-line, as well as makeon-line changes to member information (addresses, etc.). More functions are planned for the future.Internal ControlIn developing and evaluating <strong>IMRF</strong>’s accounting system, we consider the adequacy of internal accounting controls.We design these controls to provide reasonable assurance regarding the safekeeping of assets and the reliability offinancial records.<strong>IMRF</strong> employs the services of an outside certified public accountant to function as Internal Auditor, aided by afull-time assistant on staff. We use a detailed internal audit program that encompasses examination of internalcontrols as well as the Fund’s financial transactions and records.The internal auditor reports directly to the Executive Director and the Board of Trustees. The Board of Trustees,consisting entirely of outside members, functions as the audit committee. <strong>Annual</strong>ly the Internal Auditor presentshis report to the Audit Committee covering the results of internal audit procedures performed. The InternalAuditor also meets with the committee on an as-needed basis. Again this year the Internal Auditor reported that allinternal control functions were satisfied and that there were no material differences in transactions.Independent AuditThe Illinois Pension Code requires an annual audit of the financial statements of the Plan by independent certifiedpublic accountants selected by the Board of Trustees and approved by the State Auditor General. We satisfied thisrequirement and the independent accountant’s unqualified report on <strong>IMRF</strong>’s <strong>1999</strong> <strong>Financial</strong> Statements is includedin this report.Certificate of Achievement for Excellence in <strong>Financial</strong> <strong>Report</strong>ingThe Government Finance Officers Association of the United States and Canada (GFOA) awarded a Certificate ofAchievement for Excellence in <strong>Financial</strong> <strong>Report</strong>ing to the Illinois Municipal Retirement Fund for itscomprehensive annual financial report for the fiscal year ended December 31, 1998. The Certificate ofAchievement is a prestigious national award, recognizing conformance with the highest standards for preparation ofstate and local government financial reports.In order to be awarded a Certificate of Achievement, a government unit must publish an easily readable andefficiently organized comprehensive annual financial report, whose contents conform to program standards. Such areport must satisfy both generally accepted accounting principles and applicable legal requirements.A Certificate of Achievement is valid for a period of one year only. <strong>IMRF</strong> has received a Certificate ofAchievement for the last 19 consecutive years (fiscal years 1980-1998). We believe our current report continues toconform to the Certificate of Achievement program requirements, and we are submitting it to the GFOA.Illinois Municipal Retirement Fund 12
Introduction<strong>Report</strong>s to Membership<strong>IMRF</strong> issued a variety of reports covering <strong>1999</strong> activity. We mail employer statements every month. We mailedmember statements in April. We will send a summary of the annual report to members and annuitants in thesummer issues of Fundamentals. We will mail this report to Authorized Agents in June.AcknowledgementsThe production of this report reflects the combined effort of the <strong>IMRF</strong> staff under the leadership of the Board ofTrustees and the Executive Director, Robert L. Cusma. The Accounting Department under the management ofPatricia Hambrick compiled the report. We want this report to provide complete and reliable information formaking management decisions, for determining compliance with legal provisions and for determining responsiblestewardship for the assets contributed by the members and their employers.We send this report to the Authorized Agents for all participating units of government. They form the linkbetween <strong>IMRF</strong> and its membership. Their cooperation, for which we are ever thankful, contributes significantly tothe success of <strong>IMRF</strong>. We hope they will find this report both informative and helpful.Respectfully submitted,Deanna L. Lockwood, CPAChief <strong>Financial</strong> Officer13 Illinois Municipal Retirement Fund
Revenues by Sourcein millions$3000InvestmentsRevenue Charts$2500$2000EmployersMembers$1500$1000$500$01995199619971998<strong>1999</strong><strong>1999</strong> Revenues by SourceMembers5.9%Employers11.6%Investments82.5%Refunds 0.9%Death 0.6%Administrative 0.5%Disability 0.3%Annuities 14.3%Reserves83.4%<strong>1999</strong> Revenues by ApplicationIllinois Municipal Retirement Fund 14
This page intentionally left blank15 Illinois Municipal Retirement Fund
<strong>Financial</strong>
<strong>Financial</strong> Section16 Illinois Municipal Retirement Fund
Exhibit AStatements of Plan Net AssetsDecember 31<strong>1999</strong> 1998AssetsCash and cash equivalents $6,737,785 $3,036,204<strong>Financial</strong> SectionReceivables and prepaid expensesContributions 49,760,237 48,217,891Investment income 61,934,892 60,055,347Receivables from brokers for unsettled trades 30,042,347 52,563,773Prepaid expenses 27,634,374 24,390,369Total receivables and prepaid expenses 169,371,850 185,227,380Investments, at fair valueFixed income 4,391,784,592 3,684,360,006Stocks 10,183,567,685 8,070,277,275Short term investments 554,669,897 396,258,394Real estate 490,394,832 592,077,808Alternative investments 334,947,248 232,777,645Total investments 15,955,364,254 12,975,751,128Invested securities lending cash collateral 1,417,887,596 1,340,474,672Fixed assetsEquipment, at cost 6,706,210 7,041,888Accumulated depreciation (5,567,522) (5,515,750)Fixed assets, net 1,138,688 1,526,138Total assets 17,550,500,173 14,506,015,522LiabilitiesAccrued expenses and benefits payable 20,332,951 19,515,212Securities lending cash collateral 1,417,887,596 1,340,474,672Payables to brokers for unsettled trades 306,747,203 60,457,020Total liabilities 1,744,967,750 1,420,446,904Net assets held in trust for pension benefits(A schedule of funding progress ispresented on page 29) $15,805,532,423 $13,085,568,618The accompanying notes are an integral part of the financial statements.Illinois Municipal Retirement Fund 17
<strong>Financial</strong> SectionExhibit BStatements of Changes in Plan Net AssetsYears Ended December 31<strong>1999</strong> 1998AdditionsContributionsMembers for retirement coverage $192,356,900 $190,259,213Employers for benefit plan coverage 379,194,892 364,196,668Total contributions 571,551,792 554,455,881Investment IncomeInterest 217,331,875 204,559,060Dividends 70,689,084 72,132,306Equity fund income, net 49,402,727 48,224,790Securities lending income 69,836,222 76,909,946Net appreciation in fair value of investments 2,389,287,950 1,126,261,630Gross investment income 2,796,547,858 1,528,087,732Less investment expensesDirect investment expense (43,273,993) (40,422,191)Securities lending management fees (1,412,750) (1,349,195)Securities lending borrower rebates (62,775,039) (70,163,997)Net investment income 2,689,086,076 1,416,152,349Other 3,030 66,938Total additions 3,260,640,898 1,970,675,168DeductionsAnnuities 468,988,622 423,723,556Disability benefits 8,436,850 8,223,429Death benefits 18,938,364 19,549,781Refunds 28,126,601 27,121,071Administrative expenses 16,186,656 16,527,175Total deductions 540,677,093 495,145,012Net increase 2,719,963,805 1,475,530,156Net assets held in trust for pension benefitsBeginning of year 13,085,568,618 11,610,038,462End of year $15,805,532,423 $13,085,568,618The accompanying notes are an integral part of the financial statements.18 Illinois Municipal Retirement Fund
Notes to <strong>Financial</strong> StatementsDecember 31, <strong>1999</strong>A. Plan DescriptionThe Illinois Municipal Retirement Fund (<strong>IMRF</strong>) is the administrator of an agent multiple employer publicemployee retirement system (PERS). The state legislature established <strong>IMRF</strong> to provide employees of localgovernments and school districts a sound and efficient retirement system. Members, employers, and annuitantselect eight trustees who govern <strong>IMRF</strong>. State law authorizes the Board to make investments, pay benefits, setemployer contribution rates, hire staff and consultants, and perform all necessary functions to carry out theprovisions of the Illinois Pension Code. Benefit and contribution provisions are established by state law and maybe amended only by the Illinois State Legislature.<strong>Financial</strong> Section<strong>IMRF</strong> is separate and apart from the Illinois State government and is not included in the state’s financialstatements. However, the Illinois Pension Code designates the State Treasurer ex-officio treasurer of <strong>IMRF</strong> andrequires the Auditor General to approve appointment of the independent public accountants.1. Employers <strong>1999</strong> 1998Participating employers 2,768 2,744The Illinois Pension Code specifies the units of government required to participate in <strong>IMRF</strong> and the units thatmay elect to join. Participation by the following units of government is mandatory:• All counties except Cook,• All school districts except Chicago, and• All cities, villages and incorporated towns with a population over 5,000, other than Chicago, which do notprovide Social Security coverage for their employees before they reach a population of 5,000.Other units of government with general taxing powers such as townships and special districts may elect tojoin. Participating instrumentalities, which include units of government without general taxing powers and notfor-profitorganizations, associations, or cooperatives authorized by state statute, may participate. They mustmeet the financial stability requirements. Units that elect to join the system may not under any circumstancesterminate their participating employer status.2. Membersin thousands20015010050<strong>1999</strong> 1998Retirees and beneficiaries currently receiving benefits 69,716 67,756Terminated members entitled to benefitsbut not yet receiving them 7,750 7,321Terminated members — non-vested 66,435 60,236Current members:Nonvested 90,838 86,975Vested 64,679 63,453Total current members 155,517 150,4280<strong>1999</strong>1998Grand total 299,418 285,741Illinois Municipal Retirement Fund 19
<strong>Financial</strong> SectionEmployers must enroll employees in <strong>IMRF</strong> if the employees’ positions meet the qualifications for <strong>IMRF</strong>membership. There are some exceptions. City hospital employees and elected officials have the option toparticipate. <strong>IMRF</strong> does not cover individuals in certificated teaching positions covered by the IllinoisTeachers’ Retirement System. Also <strong>IMRF</strong> does not generally cover individuals performing police or fireprotection duties for employers with local police and fire pension funds. Certain police chiefs may choose toparticipate as Sheriff ’s Law Enforcement Personnel (SLEP) members.3. FundingThe member contribution rates, 4.5 percent for Regular members, 6.5 percent for SLEP members, and7.5 percent for the Elected County Officials Plan (ECO), are set by statute. The statutes require eachparticipating employer to contribute the amount necessary, in addition to member contributions, to financethe retirement coverage of its own employees. Employer contributions for disability benefits, death benefits,and the supplemental retirement benefits are pooled. See the Required Supplementary Information and theActuarial Section for data on the funding status. Costs of administering the plan are financed by investmentincome.4. Benefit ProvisionsBenefits are established by statute and may only be changed by the General Assembly. The benefit provisionsin effect on the member’s date of termination determine a member’s benefit. The following is a summary ofthe <strong>IMRF</strong> benefit provisions as of December 31, <strong>1999</strong> and 1998. A more extensive description of the plancan be found in the Actuarial Section. The (ECO) plan was created by statute in 1997 and was revised in2000.RefundsMembers who terminate their <strong>IMRF</strong> participation may withdraw their contributions and forfeit futureretirement benefits.RetirementRegular SLEP Original ECO Revised ECOVesting 8 years 20 years 8 years 8 years in eachelected positionMinimum age for 35+ years of 50 Sheriffs with 20 Sheriffs with 20unreduced benefit service: 55, years of SLEP years of SLEPotherwise 60 service: 50 service: 50otherwise 55 otherwise 55Final rate of earnings Highest consecutive Highest consecutive <strong>Annual</strong> salary Highest consecutive48 months in the 48 months in the payable on last 48 months in thelast 10 years last 10 years day of ECO service last 10 years foreach elected positionSurvivor benefits Annuity for eligible Annuity for eligible Annuity for eligible Annuity for eligiblespouse spouse spouse and unmarried spouse and unmarriedchildren under 18 children under 18Post-retirement increase 3% of original 3% of original 3% of original 3% of originalamount amount amount amountEarly Retirement At age 55, discount None None Nonebased on age andservice20 Illinois Municipal Retirement Fund
<strong>IMRF</strong> employers may offer an early retirement incentive (ERI) for active members who have 20 or moreyears of service and are age 50 or older. The program is optional with employers and may not be offered untilthe liability for any previous ERI is paid.Supplemental Retirement BenefitRetirees and surviving spouses who have been receiving benefits for at least one year receive a supplementalretirement benefit in July. The total supplemental benefit in each year is equal to 0.62 percent of theparticipating payroll for the previous year.<strong>Financial</strong> SectionDeath BenefitsThe eligible spouse of a deceased retired member receives a one-time death benefit of $3,000 plus a monthlypension equal to one-half (66-2/3 percent for ECO retirees) of the member’s pension. The beneficiaries of aparticipating member who had at least one year of service receive a lump sum death benefit equal to oneyear’s earnings plus the member’s contributions with interest. Death benefits paid upon the death of aninactive member vary depending on the member’s age and service.DisabilityMembers who have at least one year of service and meet the disability medical requirements will receive abenefit of up to 50 percent of the average monthly earnings in the 12 months preceding disability. DisabledECO members receive a disability benefit equal to the benefit they would receive upon retirement. <strong>IMRF</strong>reduces the benefit by Social Security or Workers’ Compensation awards. Members who are paid disabilitybenefits continue to receive pension service credit and death benefit protection.B. Summary of Significant Accounting Policies1. <strong>Report</strong>ing EntityAs defined by generally accepted accounting principles established by the Governmental Accounting StandardsBoard, the financial reporting entity consists of a primary government, as well as its component units, which arelegally separate organizations for which the elected officials of the primary government are financially accountable.<strong>Financial</strong> accountability is defined as:(1) Appointment of a voting majority of the component unit’s board and that the component unit provides afinancial benefit to or imposes a financial burden on the primary government; or(2) Fiscal dependency on the primary government.Based upon the required criteria, <strong>IMRF</strong> has no component units. <strong>IMRF</strong> is not a component unit of any otherentity.2. Basis of Accounting and Reclassifications<strong>IMRF</strong> prepares its financial statements using the accrual basis of accounting. It recognizes member andemployer contributions as revenues in the month member earnings are paid. Benefits and refunds arerecognized as expenses when payable. Expenses are recorded when the corresponding liabilities are incurredregardless of when payment is made. In some instances, amounts for 1998 have been reclassified to agreewith <strong>1999</strong> financial statement presentation.3. Method Used to Value Investments<strong>IMRF</strong> reports securities at fair value. Where appropriate, the fair value includes estimated disposition costs.Fair value for stocks is determined by using the closing price listed on the national securities exchanges asof December 31. Market value for fixed income securities are determined principally by using quoted marketprices provided by independent pricing services. For commingled funds, the net asset value is determined andcertified by the commingled fund manager as of December 31. Fair values for directly owned real estateinvestments are determined by appraisals.Illinois Municipal Retirement Fund 21
<strong>Financial</strong> SectionC. Cash<strong>1999</strong> 1998Carrying amounts at December 31:Cash $6,737,785 $3,036,204Bank balances at December 31:Custodial credit risk category 1 $4,004,316 $4,297,082Custodial credit risk category 3 5,869,695 1,783,349$9,874,011 $6,080,431All non-investment related bank balances at year-end are insured or collateralized with securities heldby the Illinois State Treasurer or agents in the name of the State Treasurer. The Illinois State Treasurer isex-officio Treasurer of the <strong>IMRF</strong>. These balances are classified as custodial credit risk category 1 as definedby GASB Statement 3. Cash held in the investment account is neither insured nor collateralized. Thesebalances are classified as custodial credit risk category 3 as defined by GASB Statement 3.D. Investments1. Investment PoliciesThe Illinois Pension Code prescribes the “prudent expert rule” as <strong>IMRF</strong>’s investment authority, effectiveAugust 25, 1982. This rule requires <strong>IMRF</strong> to make investments with the care, skill, prudence and diligence,under the circumstances then prevailing, that a prudent person acting in a like capacity and familiar with suchmatters would use in the conduct of an entity of like character with like aims. Within the “prudent expert”framework, the Board of Trustees adopts investment guidelines for <strong>IMRF</strong> investment managers. TheInvestment Section contains a summary of these guidelines.2. Investment Summary<strong>IMRF</strong>’s investments in securities are categorized below to give an indication of the custodial credit risk level.GASB Statement No. 3, Deposits with <strong>Financial</strong> Institutions, Investments (including Repurchase Agreements) andReverse Repurchase Agreements, defines “securities” and standard categories of custodial credit risk.A security, for purposes of classification below, is a transferable financial instrument that evidencesownership or creditorship. “Securities” do not include investments made with another party, real estate ordirect investments in mortgages or other loans. Investments in open-end mutual funds are also not consideredsecurities for purposes of custodial credit risk classification. Such investments are shown below as “notcategorized.” Some pending purchases of stocks and fixed income securities are shown as “not categorized”because the securities purchased have not been delivered and cannot be registered.Securities are divided among three categories indicating the type of custodial credit risk.Category 1: Insured or registered, or securities held by the entity or its agent in the entity’s name.Category 2: Uninsured and unregistered, with securities held by the counterparty’s trust department oragent in the entity’s name.Category 3: Uninsured and unregistered, with securities held by the counterparty, or by its trustdepartment or agent but not in the entity’s name. Pending security purchases are thesecurities <strong>IMRF</strong> holds in this category.The following tables present a summary of the Fund’s investments and related category of custodial creditrisk at December 31, <strong>1999</strong> and 1998.22 Illinois Municipal Retirement Fund
Investments, at fair value<strong>1999</strong> Custodial Credit RiskCategory Category Not <strong>1999</strong> Total1 3 Categorized Carrying ValueFixed Income SecuritiesU.S. government & agency $ 693,123,224 $565,114 $ 287,758,285 $ 981,446,623U.S. corporate 1,221,261,497 0 3,246,989 1,224,508,486U.S. fixed income funds 222,127,477 0 1,219,002,013 1,441,129,490Foreign fixed income securities 648,433,285 0 409,090 648,842,375Foreign fixed income funds 95,857,618 0 0 95,857,618Total fixed income $2,880,803,101 $565,114 $1,510,416,377 $4,391,784,592<strong>Financial</strong> SectionEquity SecuritiesU.S. equities 5,025,312,942 688,733 94,703,168 5,120,704,843Foreign equities 1,806,202,436 1,555,953 2,364,831 1,810,123,220U.S. stock funds 0 0 2,355,779,931 2,355,779,931Foreign stock funds 0 0 896,959,691 896,959,691Total equity securities 6,831,515,378 2,244,686 3,349,807,621 10,183,567,685Short-TermShort-term securities 126,415,890 0 0 126,415,890Foreign currencyforward contracts 0 0 1,577,234 1,577,234Pooled short-terminvestment funds 0 6,614,457 420,062,316 426,676,773Total short-term 126,415,890 6,614,457 421,639,550 554,669,897Real Estate 0 0 490,394,832 490,394,832Alternative 0 0 334,947,248 334,947,248Total $9,838,734,369 $9,424,257 $6,107,205,628 $15,955,364,254Illinois Municipal Retirement Fund 23
<strong>Financial</strong> SectionInvestments, at fair value1998 Custodial Credit RiskCategory Category Not 1998 Total1 3 Categorized Carrying ValueFixed Income SecuritiesU.S. government & agency $908,383,189 $ 0 $ 418,718 $ 908,801,907U.S. corporate 1,151,217,493 2,344 4,351,851 1,155,571,688U.S. fixed income funds 298,428,207 0 697,668,917 996,097,124Foreign fixed income securities 579,082,148 0 916,163 579,998,311Foreign fixed income funds 43,890,976 0 0 43,890,976Total fixed income 2,981,002,013 2,344 703,355,649 3,684,360,006Equity SecuritiesU.S. equities 4,000,914,588 11,581,022 7,878,547 4,020,374,157Foreign equities 1,810,704,435 840,786 16,066,721 1,827,611,942U.S. stock funds 609,652,366 0 896,817,855 1,506,470,221Foreign stock funds 715,324,073 0 496,882 715,820,955Total equity securities 7,136,595,462 12,421,808 921,260,005 8,070,277,275Short-TermShort-term securities 33,778,260 0 0 33,778,260Foreign currency forward contracts 0 0 (4,582,089) (4,582,089)Pooled short-term investment funds 0 0 367,062,223 367,062,223Total short-term 33,778,260 0 362,480,134 396,258,394Real Estate 0 0 592,077,808 592,077,808Alternative 0 0 232,777,645 232,777,645Total $10,151,375,735 $12,424,152 $2,811,951,241 $12,975,751,12824 Illinois Municipal Retirement Fund
Short-term securities include commercial paper or notes having a maturity of less than 90 days. Pooledshort-term investment funds are commingled funds managed by the Northern Trust. Under the terms of theinvestment agreement for these funds, the Northern Trust may invest in a variety of short-term investmentsecurities. Alternative investments include commingled funds that invest in private equity, timberland, andagricultural land.There are no individual investments held by <strong>IMRF</strong> that represented 5 percent or more of the Fund’s netassets at year-end.<strong>Financial</strong> Section3. Securities Lending ProgramThe <strong>IMRF</strong> securities lending program is authorized by the <strong>IMRF</strong> Board of Trustees. <strong>IMRF</strong> lends securities(both equity and fixed income) to securities firms on a temporary basis through its agent, Northern Trust.There are no restrictions on the amount of securities that may be lent. <strong>IMRF</strong> receives fees for all loans andretains the right to all interest and dividend payments while the securities are on loan. All security loanagreements are collateralized by cash, U.S. government securities, or irrevocable letters of credit havingmarket values equal to or exceeding 102 percent of the value of the loaned securities plus any accrued income(105 percent for non-U.S. securities). Whenever the market value of the securities loaned changes, theborrower must adjust the collateral accordingly. <strong>IMRF</strong> or the borrower has the right to close the loan at anytime. The average term of overall loans is 30 days. When the loan closes, the borrower returns the securitiesloaned to <strong>IMRF</strong>, and <strong>IMRF</strong> returns the associated collateral to the borrower. <strong>IMRF</strong> cannot pledge or sell thenon-cash collateral unless the borrower fails to return the securities borrowed.The Northern Trust pools all collateral received from securities lending transactions and invests any cashcollateral. <strong>IMRF</strong> holds an undivided share of the collateral provided by the borrowers of its securities. Thecash collateral is shown on <strong>IMRF</strong>’s financial statements. Cash collateral is invested in a short-terminvestment pool, which had an average weighted maturity of 29 days as of this statement date. Cash collateralmay also be invested separately in “term loans,” in which case the investments match the term of the loan.These loans can be terminated on demand by either lender or borrower.Indemnification deals with the situation in which a client’s securities are not returned due to theinsolvency of a borrower and Northern Trust has failed to live up to its contractual responsibilities relating tothe lending of those securities. Northern Trust’s responsibilities include performing appropriate borrower andcollateral investment credit analyses, demanding adequate types and levels of collateral, and complying withapplicable Department of Labor and Federal <strong>Financial</strong> Institutions Examination Council regulationsconcerning securities lending. There were no significant violations of legal or contractual provisions, and noborrower or lending agent default losses to the securities lending agent. There are no dividends or couponpayments owing on the securities lent. <strong>IMRF</strong> had no credit risk as a result of its securities lending program asthe collateral held exceeded the market value of the securities lent.Securities lent are included in the Plan’s assets on the financial statements.Loans outstanding as of December 31, <strong>1999</strong> December 31, 1998Market value of securities loaned $1,463,584,390 $1,425,769,420Market value of collateral received $1,508,411,154 $1,462,990,062Illinois Municipal Retirement Fund 25
<strong>Financial</strong> Section4. Derivatives<strong>IMRF</strong>’s investment managers may invest in derivative securities as permitted by their guidelines. A derivativesecurity is an investment whose payoff depends upon the value of other assets such as bond and stock prices,a market index, or commodity prices. Derivative transactions involve, to varying degrees, credit risk andmarket risk. Credit risk is the possibility that a loss may occur because a party to a transaction fails to performaccording to terms. <strong>IMRF</strong> acquires all of the derivative securities through a clearinghouse that guaranteesdelivery and accepts the risk of default. Market risk is the possibility that a change in interest or currencyrates will cause the value of a financial instrument to decrease or become more costly to settle. The marketrisk associated with derivatives, the prices of which are constantly fluctuating, is regulated by imposing strictlimits as to the types, amounts and degree of risk that investment managers may undertake. The Board ofTrustees and senior management approves these limits, and the risk positions of the investment managers arereviewed on a periodic basis to monitor compliance with the limits. <strong>IMRF</strong> does not purchase derivatives withborrowed funds.During the year, <strong>IMRF</strong>’s derivative investments included foreign currency forward contracts, options, andfutures. Foreign currency forward contracts are used to hedge against the currency risk in <strong>IMRF</strong>’s foreignstock and fixed income security portfolios. The remaining derivative securities are used to improve yield,adjust the duration of the fixed income portfolio, or to hedge changes in interest rates.Forward contracts are an agreement to buy or sell a specific amount at a specified delivery or maturity datefor an agreed upon price. As the market value of the forward contract varies from the original contract price,<strong>IMRF</strong> records an unrealized gain or loss. The market value of forward currency contracts outstanding atDecember 31, <strong>1999</strong>, and 1998 are as follows:Market Value as of December 31, <strong>1999</strong> December 31, 1998Forward currency purchases $1,001,620,075 $984,205,629Forward currency sales 1,000,042,841 988,787,718Unrealized gain (loss) $ 1,577,234 $ (4,582,089)<strong>Financial</strong> futures are similar to forward contracts, except futures contracts are standardized and traded onan organized exchange. As the market value of the futures contract varies from the original contract price, again or loss is recognized and paid to the clearinghouse. <strong>Financial</strong> futures represent an off-balance sheetobligation as there are no balance sheet assets or liabilities associated with those contracts. The contractualamounts of futures outstanding at December 31, <strong>1999</strong> and 1998 are as follows:Contractual Amount as of December 31, <strong>1999</strong> December 31, 1998Fixed income futures sold $87,279,500 0Fixed income futures purchased $46,645,000 $68,600,000Equity futures purchased $4,928,000 0Contractual amounts, which represent the market value of the underlying assets the derivative contractscontrol, are often used to express the volume of these transactions but do not reflect the extent to whichpositions may offset one another. These amounts do not represent the much smaller amounts potentiallysubject to risk.26 Illinois Municipal Retirement Fund
<strong>Financial</strong> options are an agreement that gives one party the right, but not the obligation, to buy or sell aspecific amount of an asset for a specified price, called the strike price, on or before a specified expirationdate. As a writer of financial options, <strong>IMRF</strong> receives a premium at the outset of the agreement and bears therisk of an unfavorable change in the price of the financial instrument underlying the option. No financialoptions were held at year-end in <strong>1999</strong> or 1998.5. Future Investment CommitmentsAt December 31, <strong>1999</strong> and 1998, <strong>IMRF</strong> had future commitments for additional contributions to real estateand alternative investment managers totaling $202,917,655 and $120,100,000 respectively.<strong>Financial</strong> SectionE. Reserves<strong>IMRF</strong> maintains several reserves as required by the Illinois Pension Code and Board policy. All reserves are fullyfunded with the exception of some individual employer retirement reserves. These reserves do not equal thepresent value of expected retirement benefits for all employers. The additional amount needed in aggregate ascalculated by the actuary was $224,383,665 in 1998. In <strong>1999</strong>, the retirement reserves, for all employerscombined, exceeded the present value of expected retirement benefits by $515,168,818.1. Member contribution reserves<strong>1999</strong> 1998Balances at December 31 $2,258,628,401 $2,086,679,4702. Annuity reserve<strong>1999</strong> 1998Balances at December 31 $4,915,467,275 $4,485,651,3063. Employer retirement reservesBalances at December 31 <strong>1999</strong> 1998Retirement contribution reserves $6,834,393,789 $5,643,274,675Earnings and experience reserve 1,775,556,966 847,451,178Supplemental retirement benefit 1,508,027 1,626,328Pooled death benefit reserve 7,249,022 8,913,822Pooled disability benefit reserve 12,728,943 11,971,839Employer reserves $8,631,436,747 $6,513,237,842F. Other Notes1. Prepaid ExpensesBalances as of December 31 <strong>1999</strong> 1998Prepaid administrative expenses $714,078 $540,523January 1 benefits charged to bankaccount in December 26,920,296 23,849,846$27,634,374 $24,390,369Illinois Municipal Retirement Fund 27
<strong>Financial</strong> Section2. Fixed AssetsFixed assets are capitalized at their cost at the time of acquisition. Depreciation is computed using the straight linemethod over the estimated useful life of the related asset. The estimated useful lives are:1) furniture: ten years, 2) equipment: five to eight years, and 3) automobiles: two years.Year ended December 31 <strong>1999</strong> 1998Equipment, furniture and automobilesBeginning balance $7,041,888 $6,845,877Additions 107,296 594,122Deletions (442,974) (398,111)Ending balance $6,706,210 $7,041,888Accumulated depreciationBeginning balance $5,515,750 $5,214,192Additions 486,792 698,705Deletions (435,020) (397,147)Ending balance 5,567,522 5,515,750Fixed assets, net $1,138,688 $1,526,1383. Lease AgreementsThe Fund leases its facilities at the Drake Oak Brook Plaza, which it owns, under an agreement with thebuilding’s management. The agreement covers the period May 1, 1993, through December 31, 2005. Thebase rent was abated until December 31, 1995. The Fund is amortizing the abated rent over the periodcovered by the agreement. Total rental expense for <strong>1999</strong> was $1,462,761 and for 1998 was $1,457,419.4. Risk Management<strong>IMRF</strong> carries commercial, business, and automobile liability insurance coverage provided by private insurancecarriers. These policies limit the risk of loss from torts; theft of, damage to, and destruction of assets; errors andomission; injuries to employees; and natural disasters. There have been no material insurance claims filed orpaid during the last three years. The Fund is also exposed to investment risk. This risk is limited bydiversification of the portfolio, establishment and monitoring of investment policies and guidelines, andmonitoring of investment performance. In addition, investment consultants and fiduciary counsel monitor theFund’s activities and advise the Board of Trustees.5. Contingencies<strong>IMRF</strong> is a defendant in a number of lawsuits which, in management’s opinion, will not have a material effect onthe financial statements.G. Ten-Year Historical Trend InformationTen-year historical trend information designed to provide information about <strong>IMRF</strong>’s progress made inaccumulating sufficient assets to pay benefits when due is presented as required supplementary informationfollowing the footnotes.28 Illinois Municipal Retirement Fund
Required Supplementary InformationSchedule of Funding ProgressLast ten yearsAggregate Actuarial Liabilities (AAL)Unfunded Actuarial Liabilities (UAL)UAL as a %Actuarial Total AAL Actuarial Actuarial Assets Member of MemberValuation Date Entry Age Assets as a % of AA Total UAL Payroll PayrollDecember 31 (a) (b) (b/a) (a-b) (c) (a-b)/c<strong>Financial</strong> Section1990* $6,232,223,672 $4,468,795,967 71.7% $1,763,427,705 $2,293,192,916 76.9%1991*# 6,406,965,450 5,034,577,441 78.6% 1,372,388,009 2,484,644,553 55.2%1992 6,954,483,358 5,615,583,858 80.8% 1,338,899,500 2,643,707,677 50.6%1993* 7,509,766,239 6,396,329,900 85.2% 1,113,436,339 2,774,088,607 40.1%1994 8,126,642,830 7,078,861,925 87.1% 1,047,780,905 2,930,307,763 35.8%1995 8,823,697,487 8,034,030,783 91.1% 789,666,704 3,100,271,694 25.5%1996* 9,778,592,519 9,076,261,663 92.8% 702,330,856 3,280,416,531 21.4%1997 10,807,969,067 10,273,116,034 95.1% 534,853,033 3,470,593,355 15.4%1998 11,860,879,198 11,636,495,534 98.1% 224,383,665 3,704,109,084 6.1%<strong>1999</strong>* 13,005,023,293 13,520,192,111 104.0% (515,168,818) 3,933,065,061 -13.1%* After assumption change #After benefit changeThis data, except for annual covered payroll, was provided by the actuary.Schedule of Employer ContributionsLast ten yearsAmortization of Death & SupplementalUnfunded Disability RetirementYear ended Normal Actuarial Benefit Benefit Total PercentageDecember 31 Contributions Liability Contributions Contributions Contributions Contributed1990 $166,963,506 $75,336,286 $12,663,407 $0 $254,963,199 100%1991 173,303,872 101,262,443 13,645,497 0 288,211,812 100%1992 219,904,681 83,344,475 13,202,942 0 316,452,098 100%1993 196,839,908 72,159,465 12,466,617 17,200,800 298,666,790 100%1994 216,555,637 68,143,024 11,836,442 18,173,987 314,709,090 100%1995 226,659,095 58,909,305 10,931,257 19,229,943 315,729,600 100%1996 239,924,968 54,192,636 13,086,132 20,346,617 327,550,353 100%1997 254,168,099 46,697,036 13,868,304 21,516,048 336,249,487 100%1998 274,024,269 50,551,829 16,661,873 22,958,697 364,196,668 100%<strong>1999</strong> 293,310,795 47,851,978 13,647,855 24,384,264 379,194,892 100%Illinois Municipal Retirement Fund 29
<strong>Financial</strong> SectionNotes to Required Supplementary InformationValuation date . . . . . . . . . . . . . . . . . . . . . . . . . . . . . . . . . . . . . . . . . . . . . December 31, <strong>1999</strong>Actuarial cost method . . . . . . . . . . . . . . . . . . . . . . . . . . . . . . . . . . . . . . . . . Entry age normalAmortization method . . . . . . . . . . . . . . . . . . . . . . . . . . . . . . . . . . . . Level percent of payrollRemaining amortization period . . . . . . . . . . . . . . . . . . . . . . . Taxing bodies: closed, 31 yearsOverfunded employers: open, 10 yearsNon-taxing bodies: closed, 1 yearAsset valuation method . . . . . . . . . . . . . . . . . . . . . . . . . . Five-year smoothed market relatedActuarial assumptions:Investment rate of return . . . . . . . . . . . . . . . . . . . . . . . . . . . . . . . . . . . . . . . . . . 7.5 percentProjected salary increases . . . . . . . . . . . . . . . . . . . . . . . . . . . . . . . . . . 4.65 to 8.25 percentAssumed inflation rate . . . . . . . . . . . . . . . . . . . . . . . . . . . . . . . . . . . . . . . . . . . . 4.0 percentGroup size growth rate. . . . . . . . . . . . . . . . . . . . . . . . . . . . . . . . . . . . . . . . . . . . 0.0 percentPayroll growth rate. . . . . . . . . . . . . . . . . . . . . . . . . . . . . . . . . . . . . . . . . . . . . . . 4.0 percentPost-retirement increase. . . . . . . . . . . . . . . . . . . . . . . . . . . . . . . . . . . . 3.0 percent – simpleMortality table. . . . . . . . . . . . . . . . . . . . . . . . . . . . . . 1983 Group Annuity Mortality Tablefor males and 1983 Individual AnnuityMortality Table for females, both multipliedby 95 percent. The active tables werefurther modified to reflect <strong>IMRF</strong> experience.30 Illinois Municipal Retirement Fund
Supplementary InformationSchedule of Administrative Expenses<strong>1999</strong> 1998Personal services $10,455,734 $9,911,224Supplies 477,955 592,450Professional Services 522,113 910,231Occupancy and utilities 1,797,207 1,773,619Postage and delivery 829,008 737,073Equipment service and rental 905,773 747,360Miscellaneous 712,074 1,156,513Depreciation 486,792 698,705<strong>Financial</strong> SectionTotal Administrative Expenses $16,186,656 $16,527,175Schedule of Payments to Consultants<strong>1999</strong> 1998External Auditor $55,000 $54,000Internal Auditor 32,332 32,208Medical Consultant 64,863 77,100Legal Services 86,489 85,020Actuary 163,129 197,449Management Consultants:Benefit information system 11,353 289,935Imaging system 97,067 68,641Legislative 10,000 42,500Newsletter 1,880 0Strategic planning 0 63,378Total $522,113 $910,231Schedule of Investment Expenses<strong>1999</strong> 1998Investment manager fees $42,404,527 $39,623,074Master trustee fees 823,155 737,448Miscellaneous 46,311 61,669Total $43,273,993 $40,422,191A schedule of investment related fees can be found in the Investment Section.Illinois Municipal Retirement Fund 31
This page intentionally left blank32 Illinois Municipal Retirement Fund
Investments
Investments Section34 Illinois Municipal Retirement Fund
Illinois Municipal Retirement Fund 35Investments Section
Investments Section36 Illinois Municipal Retirement Fund
Investment Portfolio as of December 31, <strong>1999</strong>Allocation by Asset ClassInvestments SectionReal Estate 3.1%Alternative 2.1%Short Term Investments 3.5%U.S. Stock 46.9%International 21.6%U.S. Fixed Income 22.8%Total Investments by RegionInternational 22%Domestic 78%Illinois Municipal Retirement Fund 37
Investments SectionMaster TrusteeThe Northern Trust CompanyRichard L. Deeter, Vice PresidentChicago, IllinoisPerformance EvaluationWilliam M. Mercer Investment Consulting, Inc.Stephanie L. Grieser, Senior ConsultantChicago, IllinoisClarion-CRA Real Estate SecuritiesRadnor, PennsylvaniaCozad/Westchester AgriculturalAsset ManagementChampaign, IllinoisCriterion Investment Management LLCHouston, TexasInvestment ConsultantWilliam M. Mercer Investment Consulting, Inc.Stephanie L. Grieser, Senior ConsultantChicago, IllinoisReal Estate ConsultantRussell Real Estate AdvisorsBruce A. Eidelson, Director of Advisory ServicesSan Diego, CaliforniaInvestment ManagersAbacus <strong>Financial</strong> Group, Inc.Chicago, IllinoisAbbott Capital Management, LLCNew York, New YorkBank of Ireland Asset Management (U.S.) Ltd.Greenwich, ConnecticutBlackRock <strong>Financial</strong> Management, Inc.New York, New YorkBrandes Investment Partners, L.P.San Diego, CaliforniaBrinson Partners, Inc.Chicago, IllinoisCapital Guardian Trust CompanyLos Angeles, CaliforniaCB Richard Ellis Investors, LLCLos Angeles, CaliforniaDimensional Fund AdvisorsSanta Monica, CaliforniaFidelity Management Trust CompanyBoston, MassachusettsForest Investment AssociatesAtlanta, GeorgiaFrontier Capital Management Co.Boston, MassachusettsHolland Capital ManagementChicago, IllinoisInvestment Counselors of MarylandBaltimore, MarylandJacobs Levy Equity Management, Inc.Roseland, New JerseyJ.P. Morgan Investment Management, Inc.New York, New YorkJulius Baer Investment Management, Inc.New York, New YorkLaSalle Advisors, Ltd.Chicago, IllinoisLazard Fréres Real Estate Investors, LLCNew York, New YorkLend Lease Real Estate Investments, Inc.Atlanta, Georgia38 Illinois Municipal Retirement Fund
Lincoln Capital Management Co.Chicago, IllinoisNewBridge Partners, LLCNew York, New YorkNorthern Trust Quantitative Advisors, Inc.Chicago, IllinoisOak Associates, Ltd.Akron, OhioOlympus Real Estate CorporationDallas, TexasOxford PartnersWestport, ConnecticutPayden & RygelLos Angeles, CaliforniaPrudential InvestmentsParsippany, New JerseyThe RREEF FundsChicago, IllinoisSchroder Capital Management InternationalLondon, EnglandSchroder VenturesLondon, EnglandSecurity Capital Markets Group, Inc.Santa Fe, New MexicoSentinel Real Estate CorporationNew York, New YorkWall Street AssociatesLa Jolla, CaliforniaWellington Management Company, LLPBoston, MassachusettsInvestments SectionIllinois Municipal Retirement Fund 39
Investments SectionInvestment Objectives and PoliciesThe Board of Trustees, operating within the “prudent person” framework, has adopted the following investmentobjectives and guidelines. The objectives and guidelines presented here are intended to be summarizations.Specific guidelines are in effect for individual investment managers.A. Investment ObjectivesThe <strong>IMRF</strong> Board of Trustees, pursuant to its fiduciary responsibilities, and in order to provide benefitsexclusively for its membership, has established the following objectives:1. To diversify the investment portfolio so as to optimize investment returns and at the same time to controlthe risk of large losses.2. To set investment and actuarial policies so as to assure the adequate accumulation of assets and achieve areasonable funded status.3. To achieve rates of return greater than the current actuarial assumption of 8 percent and to exceedinflation.4. To achieve rates of return consistent with expectations for each asset class used, without significantlychanging the expected risk profile of the asset class or the Fund as a whole.5. To achieve in U.S. equities a total return that exceeds the total return of the S&P 500 Stock CompositeIndex. In addition, the Board expects to earn a minimum of 6 percent in excess of inflation over a movingfive-year period.6. To achieve in international equities a total return that exceeds the total return of the MSCI EAFE Index.In addition, the Board expects to earn a minimum of 6 percent in excess of inflation over a moving fiveyearperiod.7. To achieve in fixed income securities a total return that exceeds the Lehman Aggregate Bond Index over amoving five-year period. In addition, the Board expects to earn a minimum of 3 percent in excess ofinflation over a moving five-year period.8. To achieve in equity real estate investments a real rate of return of 5 percent over inflation over a movingfive-year period.9. To achieve in alternative investments a 15 percent nominal return.10. To achieve in internally managed short-term securities relative performance better than 30-dayU.S. Treasury Bills.11. To minimize employer contribution volatility.12. To ensure continuing stability of employee contribution rates.13. To manage costs in an effective manner while providing high levels of service to members, employers,and taxpayers.40 Illinois Municipal Retirement Fund
14. To be innovative, responsive, and considerate of the position of public trust it holds in the State of Illinois.Investment return shall include both income and realized and unrealized gains and losses, and is computed onmarket value.B. Proxy Voting GuidelinesInvestments SectionThe Board shall retain the final authority and responsibility to vote proxies. Generally, proxies shall be votedfor management nominees and proposals in all cases unless otherwise recommended by the InvestmentManager. In cases of takeover, anti-takeover, merger or acquisition resolutions or significant corporatedevelopments, the <strong>IMRF</strong> staff will consult with the Investment Manager(s) prior to execution of the proxyballot.C. U.S. Equity Investment Guidelines1. The equity portfolio as a whole shall be constructed on four fundamental principles: diversification, quality,growth, and value.2. A commitment to any one industry shall generally be limited to a maximum of 20 percent of an equitymanager’s portfolio market value at the time of purchase. Any holding of any one issuer, at the time ofpurchase, shall generally be limited to a maximum of 8 percent of the equity manager’s portfolio marketvalue.3. Equity securities must be listed on the principal U.S. exchanges or traded over the counter. ADRs (eitherlisted or traded over the counter) of foreign companies are permissible.4. Volatility of the non-commingled equity portfolio should not exceed 125 percent of the volatility of themarket as defined by Standard & Poor’s 500 Composite Stock Index and measured by the portfolioevaluation advisors unless otherwise agreed to by the Board.5. The use of convertible debt instruments shall be considered part of the equity portfolio.D. International Equity Investment Guidelines1. The international equity portfolio as a whole shall be constructed on four fundamental principles:diversification, quality, growth, and value.2. Managers may invest in equity securities that are not traded on U.S. exchanges. Global equity managersmay invest in equity securities that are traded on U.S. or international exchanges.3. Holdings of any one issuer, at the time of purchase, shall generally be limited to a maximum of 5 percent ofthe international equity manager’s portfolio market value.4. Global equity portfolio holdings are considered to be part of the international equity portfolio. Holdings ofany one issuer, at the time of purchase, shall generally be limited to a maximum of 8 percent of theportfolio market value. Additionally, country holdings (excluding Japan and the U.S.) and emerging marketholdings will generally be limited to 20 percent of portfolio market value at the time of purchase.Illinois Municipal Retirement Fund 41
Investments Section5. Emerging market portfolios are also considered to be part of the international equity portfolio. Theemerging market portfolio shall be diversified both geographically and by industry sector. Markets willbe selected based on market liquidity, availability of information, and official regulation, including fiscaland foreign exchange repatriation rules. The emerging market manager may generally invest up to 35percent of its assets in a single country. Holdings of any one issuer, at the time of purchase, shallgenerally be limited to 5 percent of the portfolio’s market value.6. Managers may engage in various transactions to hedge currency.E. Fixed Income Investment Guidelines1. Bonds, notes or other obligations of indebtedness issued or guaranteed by the U.S. government, itsagencies or instrumentalities are permissible investments.2. Debt obligations of any single U.S. corporation are generally subject to a maximum holding of 15percent of a manager’s portfolio assets at market value. Generally, no more than 20 percent of amanager’s assets at market value may be invested in securities rated below “BBB” or “Baa” at the time ofpurchase. The use of debt instruments rated lower than “BBB” or “Baa” or non-rated instruments doesnot require prior Board approval for investment managers using high-yield disciplines.3. Managers may invest in mortgage backed securities.4. Private placements may be authorized by the Board on an individual manager basis.5. Bonds or other obligations of foreign countries and corporations payable in U.S. and non-U.S. fundsare authorized by the Board for specific managers.6. Global fixed income portfolio holdings are considered to be part of the fixed income portfolio. BothU.S. and non-U.S. dollar denominated fixed income securities are permissible investments.Government and government agency obligations may be purchased without limitation. Debtobligations of any single corporation are generally subject to a maximum of 5 percent of the manager’sassets at market value. The manager shall not invest in securities rated lower than “BBB” by Standard &Poor’s, “Baa” by Moody’s, or other such equivalent ratings issued by other recognized rating agencies.No more than 15 percent of the manager’s assets at market value shall be invested in obligations rated“BBB,” “Baa,” or such equivalent ratings. A global fixed income manager may engage in varioustransactions to hedge currency.7. The use of exchange traded financial futures, exchange traded options on financial futures, and over thecounter options is subject to individual manager guidelines. The use of leverage is not allowed.F. Equity Real Estate Investment GuidelinesReal estate is an authorized investment of the Fund provided that such investment at the time ofcommitment would not cause the market value of such investments to exceed 5 percent of the marketvalue of the total Fund.42 Illinois Municipal Retirement Fund
G. Alternative Investment GuidelinesThe Alternative Investment portfolio will consist of venture capital, buyout, and special situationinvestments. Investments will be made for long-term returns, generally through the use of limitedpartnership vehicles and separate account vehicles. Investments will be diversified in a manner that willbroaden the portfolio exposure to a wide range of opportunities and provide a means of controlling theinherent risks of new and different investment areas.Investments SectionH. Short-term Investment GuidelinesPermissible short-term investments are U.S. Treasury Bills and Notes, high-grade commercial paper,repurchase agreements, banker’s acceptances, and certificates of deposit. Commercial paper investmentsshall be made in instruments rated “A-2” or “P-2” or better as defined by a recognized rating service.Comparable ratings are required for banker’s acceptances and certificates of deposit. No more than $20million of current market value shall be invested in the securities of any one issuer, with the exception ofthe U.S. government and its agencies.Illinois Municipal Retirement Fund 43
Investments SectionReturns by Asset ClassPeriods ending December 31st<strong>Annual</strong>ized1995 1996 1997 1998 <strong>1999</strong> 3 yrs. 5 yrs. 10 yrs.Total Time Weighted Returns<strong>IMRF</strong> 20.68% 15.87% 16.19% 12.63% 20.93% 16.41% 17.27% 12.29%CPI (Inflation) 2.54% 3.32% 1.70% 1.61% 2.67% 2.00% 2.36% 2.93%Equities - U.S.<strong>IMRF</strong> 32.26% 22.30% 28.47% 21.27% 29.61% 26.40% 26.74% 17.95%S&P 500 37.48% 23.07% 33.23% 28.75% 21.05% 27.56% 28.55% 18.19%Wilshire 4500 33.43% 17.18% 25.69% 8.63% 34.87% 22.57% 23.59% 16.01%Wilshire 5000 36.45% 21.21% 31.29% 23.43% 23.56% 26.04% 27.06% 17.57%Equities - International<strong>IMRF</strong> 6.40% 16.34% 4.24% 13.16% 40.17% 17.98% 15.17% 9.49%EAFE 11.55% 6.36% 2.06% 20.33% 27.30% 16.06% 13.15% 7.33%EAFE 50% Hedged 10.64% 9.06% 7.83% 16.17% 31.01% 17.95% 16.41% 6.97%Equities - Global<strong>IMRF</strong> n/a n/a n/a 15.11% 18.08% n/a n/a n/aMSCI World 21.31% 13.99% 16.22% 24.79% 24.94% 21.61% 19.76% 11.49%Equities - Emerging Markets*<strong>IMRF</strong> n/a n/a -10.31% -22.01% 78.38% 7.66% 6.65% n/aMSCI Emerging Markets Free -5.21% 6.03% -11.59% -25.34% 66.41% 3.18% 2.00% 11.16%Fixed Income - U.S<strong>IMRF</strong> 18.09% 5.77% 10.18% 7.10% 0.28% 5.17% 7.76% 8.51%Lehman Aggregate 18.48% 3.61% 9.68% 8.67% -0.83% 5.74% 7.73% 7.70%Lehman Government/Corporate 19.24% 2.91% 9.75% 9.47% -2.15% 5.54% 7.60% 7.65%Merrill Lynch 1-3 Year Treasury 11.00% 4.98% 6.66% 7.00% 3.06% 5.56% 6.51% 6.59%Merrill Lynch High Yield 19.91% 11.06% 12.83% 3.66% 1.57% 5.91% 9.61% 10.79%Fixed Income - Global<strong>IMRF</strong> 21.75% 9.42% 0.21% 15.68% -5.55% 3.18% 7.92% 9.55%Salomon World Govt Ex-U.S. 19.55% 4.10% -4.26% 17.79% -5.09% 2.29% 5.90% 8.60%Salomon World Govt 19.04% 3.63% 0.24% 15.29% -4.30% 3.41% 6.41% 8.03%Real Estate<strong>IMRF</strong> 5.02% 15.51% 22.68% -0.38% 2.76% 5.46% 7.50% -0.76%NCREIF Classic Property 8.75% 10.36% 12.28% 18.42% 12.76% 14.47% 12.48% 5.79%Alternative Investments<strong>IMRF</strong> 21.69% 44.90% 39.26% 19.58% 32.60% 30.27% 31.34% 19.22%Cash & Cash Equivalents<strong>IMRF</strong> 6.16% 5.80% 5.87% 5.81% 7.77% 6.96% 6.57% 5.97%U.S. Treasury Bills 5.74% 5.30% 5.37% 5.02% 4.96% 5.11% 5.28% 5.13%*Prior to 1997, Emerging Market Equity returns were included in international equity returns.Performance has been audited and calculated by William M. Mercer Investment Consulting, Inc. in accordance with AIMR’sperformance presentation standards.44 Illinois Municipal Retirement Fund
Schedule IInvestment Portfolio Summaryin millions of dollarsAs of 12/31/99 As of 12/31/98Fair Percent of Total Fair Percent of TotalValue Fair Value Value Fair ValueInvestments SectionFixed IncomeU.S. Government $981.5 6.1% $908.8 7.0%Corporate 1,224.5 7.7% 1,155.6 8.9%Index Funds 1,441.1 9.0% 996.1 7.7%Foreign 744.7 4.7% 623.9 4.8%4,391.8 27.5% 3,684.4 28.4%StocksU.S. Common & Preferred 5,120.7 32.1% 4,020.4 31.0%U.S. Stock Fund 2,355.8 14.8% 1,506.5 11.6%Foreign Common & Preferred 1,810.1 11.3% 1,827.6 14.1%Foreign Stock Funds 897.0 5.6% 715.8 5.5%10,183.6 63.8% 8,070.3 62.2%Real EstateCommingled Funds 292.9 1.8% 311.6 2.4%Directly Owned 197.5 1.3% 280.5 2.2%490.4 3.1% 592.1 4.6%Alternative InvestmentsCommingled Funds 247.0 1.5% 166.0 1.3%Timber and Agricultural 87.9 0.6% 66.8 0.5%334.9 2.1% 232.8 1.8%Short-Term Investments 554.7 3.5% 396.2 3.0%Total Portfolio $15,955.4 100.0% $12,975.8 100.0%A complete listing of investments is available upon request.Also refer to graphs on page 36.Illinois Municipal Retirement Fund 45
Investments SectionSchedule IIAsset AllocationLast Five YearsFair Value as a Percent of Portfolio1995 1996 1997 1998 <strong>1999</strong>Fixed IncomeU.S. Government 7.6% 9.2% 6.9% 7.0% 6.1%Corporate 5.5% 6.3% 7.8% 8.9% 7.7%Index Fund 8.1% 6.7% 7.7% 7.7% 9.0%Foreign 8.0% 5.6% 5.7% 4.8% 4.7%29.2% 27.8% 28.1% 28.4% 27.5%StocksU.S. Common & Preferred 25.4% 24.1% 27.8% 31.0% 32.1%U.S. Stock Funds 16.3% 16.9% 14.5% 11.6% 14.8%Foreign Common & Preferred 12.6% 13.3% 12.2% 14.1% 11.3%Foreign Stock Funds 5.1% 6.4% 5.7% 5.5% 5.6%59.4% 60.7% 60.2% 62.2% 63.8%Real EstateCommingled Funds 2.3% 1.9% 2.4% 2.4% 1.9%Directly Owned 2.7% 2.8% 2.5% 2.2% 1.2%5.0% 4.7% 4.9% 4.6% 3.1%Venture CapitalCommingled Funds 1.2% 1.2% 1.2% 1.3% 1.5%Timber and Agricultural 0.4% 0.3% 0.4% 0.5% 0.6%1.6% 1.5% 1.6% 1.8% 2.1%Short-Term Investments 4.8% 5.3% 5.2% 3.0% 3.5%Total Portfolio 100.0% 100.0% 100.0% 100.0% 100.0%46 Illinois Municipal Retirement Fund
Ten Largest Fixed Income Investment HoldingsExcludes Commingled FundsMarketValuePercentof TotalInvested MarketGNMA 0.00% due 1/15/2029 $53,413,875 0.34%FNMA 0.00% due 1/25/2030 50,343,281 0.32%FNMA 5.625% due 3/15/2001 49,535,000 0.31%FNMA 5.250% due 1/15/2003 48,082,000 0.30%FNMA 0.00% due 1/1/2029 46,854,763 0.30%FNMA 0.00% due 1/15/2029 43,196,790 0.27%U.S. Treasury Bonds 6.25% Due 8/15/2023 34,978,251 0.22%U.S. Treasury Bonds 6.125% Due 8/15/2029 32,654,049 0.21%U.S. Treasury Notes 5.500% Due 8/31/2001 31,837,750 0.20%Germany Bonds 5.625% Due 1/4/2028 28,871,159 0.18%Investments Section$419,766,918 2.65%Ten Largest Equity Investment HoldingsExcludes Commingled FundsMarketValuePercentof TotalInvested MarketCisco Systems, Inc. $222,996,756 1.41%America On-Line 198,809,041 1.26%EMC Corp. 186,030,900 1.18%Microsoft Corp. 184,354,088 1.17%Intel Corp. 91,967,756 0.58%Nokia Corp. ADR 91,003,069 0.58%Home Depot Inc. 86,563,125 0.55%Dell Computer Corp. 85,991,100 0.54%General Electric Co. 83,820,338 0.53%American International Group, Inc. 66,463,356 0.42%$1,297,999,529 8.22%A complete listing of securities is available upon request.Illinois Municipal Retirement Fund 47
Investments SectionSchedule of <strong>1999</strong> Domestic Brokerage CommissionsIn order of commissions receivedBroker Name Shares Commissions Per ShareInvestment Technology Group 32,732,992 $644,174 $0.02Instinet 15,224,765 227,962 0.01Smith Barney 8,285,736 211,895 0.03Bear Stearns Securities 11,383,130 209,494 0.02Capital Institutional Services* 4,056,700 208,405 0.05Citation Group* 3,458,829 206,412 0.06Lehman Brothers* 3,154,888 180,238 0.06Donaldson Lufkin and Jenrette Securities 3,232,870 178,448 0.06Jefferies and Co. 3,191,055 174,119 0.05Morgan Stanley and Co. 2,899,750 156,593 0.05Merrill Lynch Pierce Fenner and Smith 2,659,545 141,552 0.05Goldman Sachs and Co. 2,524,388 135,768 0.05First Boston Corp. 2,308,500 134,539 0.06Paine Webber 1,971,491 112,201 0.06Cantor Fitzgerald and Co. 2,002,258 100,680 0.05Prudential Securities 2,856,836 90,944 0.03Bernstein, Sanford C. and Co. 1,456,290 81,006 0.06Jones and Associates 1,388,186 79,793 0.06Hambrecht and Quest 1,168,153 69,933 0.06Oppenheimer and Co. 1,129,959 62,464 0.06Lynch Jones and Ryan* 985,200 50,926 0.05J.P. Morgan Securities 901,525 50,838 0.06Other Brokers 21,811,748 1,130,217 0.05Total 130,784,794 $4,638,601 $0.04*Directed commission broker48 Illinois Municipal Retirement Fund
Schedule of <strong>1999</strong> International Brokerage CommissionsIn order of commissions receivedBroker Name Shares Commissions Per ShareMorgan Stanley 14,458,440 $333,585 $0.02HSBC Investment Bank 14,640,028 263,265 0.02Goldman Sachs 53,211,098 259,939 0.00SBC Warburg 17,072,608 228,321 0.01Merrill Lynch 16,347,116 215,581 0.01Lehman Brothers* 9,013,334 213,419 0.02CSFB Limited 6,918,741 179,408 0.03Salomon Brothers 9,944,670 145,365 0.01TIR Securities* 3,677,639 136,013 0.04Kleinwort Benson 4,352,876 134,769 0.03Deutsche Morgan Grenfell 5,140,053 132,160 0.03Credit Lyonnais 21,336,780 131,057 0.01ABN AMRO 5,618,645 130,632 0.02JB Were and Son 3,935,981 90,645 0.02Indosuez WI Carr 6,869,254 89,442 0.01JP Morgan 1,829,228 83,339 0.05Sanford Bernstein 1,231,440 62,757 0.05Other Brokers 70,550,085 816,981 0.01Investments SectionTotal International 266,148,016 $3,646,678 $0.01* Directed commission brokerIllinois Municipal Retirement Fund 49
Investments SectionSchedule of Investment Fees<strong>1999</strong> 1998Assets underAssets undermanagementmanagementat year end Basis at year end BasisFees (in thousands) Points Fees (in thousands) PointsInvestment manager feesFixed income managers $3,677,589 $3,353,474 11 $3,407,249 $2,710,393 13Stock managers 19,345,015 7,213,967 27 15,236,412 5,539,503 28International managers 12,676,930 4,393,751 29 12,818,160 3,991,520 32Real Estate managers 4,687,258 492,216 95 5,938,834 598,112 99Alternativeinvestment managers 2,017,735 361,975 56 2,222,419 247,268 90$42,404,527 $15,815,383 $39,623,074 $13,086,796Other investment feesMaster trustee fees $823,155 $737,448Total investment fees 43,227,682 40,360,522Non-fee investment expenses 46,311 61,669Total direct investmentexpenses $43,273,993 $40,422,191Securities lending feesRebated earnings $62,775,039 $70,163,997Bank fees and commissions 1,412,750 1,349,195$64,187,789 $71,513,192Fees paid with directed commissions<strong>IMRF</strong> pays for some consulting services with directed commissions or “soft dollars.”These are a form of payment for services through brokerage commissions generated through trades with specialdirected brokerages.Investment consulting fees $481,868 $329,800Master trustee fees 46,250 100,000$528,118 $429,80050 Illinois Municipal Retirement Fund
Actuarial
Actuarial Section52 Illinois Municipal Retirement Fund
Illinois Municipal Retirement Fund 53Actuarial Section
Actuarial Section54 Illinois Municipal Retirement Fund
Solvency testLast ten yearsAggregate Actuarial Liabilities ForPortion of Actuarial(1) (2) (3) Liabilities covered byActive MembersAssetsCalendar Active Member (Employer ActuarialYear Contributions Annuitants Financed Portion) Assets (1) (2) (3)Actuarial Section1990 $ 986,213,859 $2,111,742,303 $3,134,267,510 $4,468,795,967 100.0% 100.0% 43.7%1991 1,095,888,522 2,217,253,547 3,093,823,381 5,034,577,441 100.0% 100.0% 55.6%1992 1,218,238,446 2,421,564,751 3,314,680,161 5,615,583,858 100.0% 100.0% 59.6%1993 1,350,831,396 2,660,823,087 3,498,111,756 6,396,329,900 100.0% 100.0% 68.2%1994 1,496,014,554 2,907,982,455 3,722,645,821 7,078,861,925 100.0% 100.0% 71.9%1995 1,642,362,193 3,171,162,151 4,010,173,143 8,034,030,783 100.0% 100.0% 80.3%1996 1,782,293,677 3,588,320,481 4,407,978,361 9,076,261,663 100.0% 100.0% 84.1%1997 1,933,512,014 3,995,946,514 4,878,510,539 10,273,116,034 100.0% 100.0% 89.0%1998 2,086,679,470 4,485,651,306 5,288,548,422 11,636,495,534 100.0% 100.0% 95.8%<strong>1999</strong> 2,258,628,401 4,915,467,275 5,830,927,617 13,520,192,111 100.0% 100.0% 108.8%Total obligation and actuarial value of assets calculated by the actuary.Table IParticipating Member StatisticsLast ten yearsPercentPercentIncrease in Average Increase in Number of Average AverageCalendar Total <strong>Annual</strong> Average Participating Attained Years ofYear Total Salaries Salaries Salary Salary Members Age Service1990 $2,293,192,916 4.6% $19,000 5.3% $120,648 43.3 7.31991 2,484,644,553 8.3% 19,846 4.5% 124,953 43.4 7.41992 2,643,707,677 6.4% 20,546 3.5% 125,943 43.8 7.61993 2,774,088,607 4.9% 21,856 10.1% 130,063 44.3 8.11994 2,930,307,763 5.6% 21,710 -0.7% 126,708 43.9 7.71995 3,100,271,694 5.8% 22,661 4.4% 133,733 43.8 8.21996 3,280,416,531 5.8% 22,104 -2.5% 142,046 44.0 8.31997 3,470,593,355 5.8% 23,991 8.5% 146,659 44.1 8.21998 3,704,109,084 6.7% 24,871 3.7% 150,428 44.3 8.2<strong>1999</strong> 3,933,065,061 6.2% 25,678 3.2% 155,517 44.4 8.6Illinois Municipal Retirement Fund 55
Actuarial SectionTable IIChanges in the number of recurring benefit paymentsLast ten yearsAdditions Deletions End of YearCalendarYear Annuity Disability Annuity Disability Annuity Disability1990 3,698 2,024 1,966 2,022 49,330 1,4091991 2,899 2,022 1,165 2,061 51,064 1,3701992 3,067 2,033 1,235 1,993 52,896 1,4101993 3,381 1,978 1,349 1,881 54,928 1,5071994 3,931 2,067 1,501 1,343 57,358 2,2311995 4,020 2,014 1,321 1,590 60,057 2,6551996 3,866 1,886 2,403 2,813 61,520 1,7281997 4,971 1,885 2,436 1,986 64,055 1,6271998 4,895 1,799 2,678 1,942 66,272 1,484<strong>1999</strong> 4,852 1,807 2,794 1,905 68,330 1,386Table IIINumber of initial benefit paymentsLast ten yearsCalendarYear Annuity Disability Death Refund Total1990 3,698 2,024 1,878 11,917 19,5171991 2,899 2,022 1,836 11,692 18,4491992 3,059 2,033 2,097 12,006 19,1951993 3,289 1,978 1,954 9,491 16,7121994 3,365 2,785 1,822 10,910 18,8821995 4,039 2,183 1,002 11,348 18,5721996 4,689 2,221 889 11,550 19,3491997 4,962 2,169 915 13,841 21,8871998 4,025 1,953 2,367 13,373 21,718<strong>1999</strong> 3,892 2,004 2,517 13,542 21,95556 Illinois Municipal Retirement Fund
Table IVAverage employer contribution ratesLast five yearsPriorSupplementalCalendar Normal Service Disability RetirementYear Cost Cost and Death Benefit TotalActuarial SectionRegular Members1997 7.27% 1.32% 0.40% 0.62% 9.61%1998** 7.21% 1.36% 0.45% 0.62% 9.64%<strong>1999</strong> 7.23% 0.99% 0.35% 0.62% 9.19%2000* 7.17% 0.02% 0.35% 0.62% 8.16%2001** 7.41% -1.75% 0.36% 0.62% 6.64%Sheriff’s Law Enforcement Personnel Members (SLEP)1997 9.32% 1.09% 0.40% 0.62% 11.43%1998** 10.22% 2.65% 0.45% 0.62% 13.94%<strong>1999</strong> 10.62% 2.43% 0.35% 0.62% 14.02%2000* 10.42% 2.89% 0.35% 0.62% 14.28%2001** 12.02% 1.85% 0.37% 0.62% 14.86%Elected County Official Members (ECO)<strong>1999</strong> 21.48% 13.56% 0.35% 0.62% 36.01%2000* 23.39% 17.03% 0.34% 0.62% 41.38%2001** 23.85% 17.75% 0.36% 0.62% 42.58%The optional Elected County Officials Plan began in 1997. The <strong>1999</strong> rates, which are based on 1997 data, are the firstexperience based rates.* The method of computing average rates was changed for 2000 from a population weighted method to a pay weightedmethod.** Assumptions changed due to experience study.Table VParticipating member contribution ratesLast ten yearsCalendar Regular <strong>IMRF</strong> Sheriff’s Law Enforcement Personnel Elected County OfficialsYear Normal Survivor Total Normal Survivor SLEP Total Normal Survivor ECO Total1990 3.75% 0.75% 4.50% 3.75% 0.75% 2.00% 6.50%1991 3.75% 0.75% 4.50% 3.75% 0.75% 2.00% 6.50%1992 3.75% 0.75% 4.50% 3.75% 0.75% 2.00% 6.50%1993 3.75% 0.75% 4.50% 3.75% 0.75% 2.00% 6.50%1994 3.75% 0.75% 4.50% 3.75% 0.75% 2.00% 6.50%1995 3.75% 0.75% 4.50% 3.75% 0.75% 2.00% 6.50%1996 3.75% 0.75% 4.50% 3.75% 0.75% 2.00% 6.50%1997** 3.75% 0.75% 4.50% 3.75% 0.75% 2.00% 6.50% 3.75% 0.75% 3.00% 7.50%1998 3.75% 0.75% 4.50% 3.75% 0.75% 2.00% 6.50% 3.75% 0.75% 3.00% 7.50%<strong>1999</strong> 3.75% 0.75% 4.50% 3.75% 0.75% 2.00% 6.50% 3.75% 0.75% 3.00% 7.50%**The Elected County Officials plan began in 1997.Illinois Municipal Retirement Fund 57
Actuarial SectionActuarial Balance SheetSources of FundsAmount at December 31<strong>1999</strong> 1998Actuarial value of assets $13,520,192,111 $11,636,495,534Actuarial present value of future contributionsMember 1,737,628,035 1,637,048,238Employer normal costs 2,901,001,179 2,622,317,919Unfunded actuarial accrued liability (515,168,818) 224,383,664Total sources 17,643,652,507 16,120,245,355Uses of FundsRetired members and beneficiaries 4,915,459,683 4,485,651,306Inactive members 1,034,642,976 918,795,583Active members 11,671,575,636 10,692,245,571Death and disability benefits 21,974,212 23,552,895$17,643,652,507 $16,120,245,355Analysis of Unfunded LiabilityUnfunded liability beginning of year $224,383,664 $534,853,033Assumed payments during year (37,635,098) (30,821,514)Assumed interest (7.5 percent) 57,022,655 38,972,111Expected unfunded liability 243,771,221 543,003,630Change due to assumption changes 166,647,356 -Change due to investment performance (962,123,987) (515,700,260)Change due to other sources 36,536,592 197,080,294Unfunded liability end of year ($515,168,818) $224,383,66458 Illinois Municipal Retirement Fund
Derivation of Experience Gain (Loss)Type of Risk Area <strong>1999</strong> 1998Risks Related to Assumptionsin millionsActuarial SectionEconomic Risk AreasInvestment Return $962.1 $515.7Pay Increases 5.5 (69.9)Demographic Risk AreasService Retirements 6.8 37.8Early Retirements (5.1) (8.7)Vested Deferred Retirements (14.6) 37.8Death and Survivor Benefits 0.6 7.7Disability Benefits 6.4 5.7Terminated with Refund (21.1) 10.5Risks Not Related to Assumptions (168.1)* (197.0)Total Gain (or Loss) During Year $758.9 $318.6Regular actuarial valuations give information about the composite change in unfunded actuarial accrued liabilities—whether or not the liabilities are increasing or decreasing and by how much. The objective of a gain and lossanalysis is to determine the portion of the change in actuarial condition (unfunded actuarial accrued liabilities)attributable to each risk area. The fact that actual experience differs from assumed experience is to be expected—the future cannot be predicted with 100 percent precision. The economic risk areas (investment return and payincreases) are volatile. It is assumed that gains and losses will be in balance over a period of years, but sizableyear-to-year fluctuations are common.*Including $166.6 million from experience studyIllinois Municipal Retirement Fund 59
Actuarial SectionSummary of BenefitsThis is a brief plan description of <strong>IMRF</strong> benefits. Additional conditions and restrictions may apply. A completedescription is found in Article 7 of the Illinois Pension CodeGeneral<strong>IMRF</strong> serves more than 2,700 employers including cities, villages, counties, school districts, townships and variousspecial districts, such as parks, forest preserves and sanitary districts. Each employer builds up an account to providefuture benefits for its own employees.Employees of these employers are required to participate if they work in an <strong>IMRF</strong> qualified position. An <strong>IMRF</strong>qualified position is one that will equal or exceed the employer’s annual hourly standard; the standard is either 600or 1,000 hours a year.<strong>IMRF</strong> has three benefit plans. The Sheriff ’s Law Enforcement Personnel (SLEP) plan is for sheriffs and deputysheriffs. Forest preserve districts may adopt the SLEP plan for their law enforcement personnel. Counties mayadopt the Elected County Official (ECO) plan for their elected officials. After a county has adopted the ECOplan, participation is optional for the elected officials of that county.Both the employee (member) and the employer contribute toward the retirement benefits. Members contribute apercentage of their salary. The percentage depends on the plan in which the member participates. Regular memberscontribute 4.5 percent, SLEP members contribute 6.5 percent, and ECO plan members contribute 7.5 percent.Employer contributions are actuarially calculated for each employer. Employers pay most of of the member’s andsurvivor’s pension cost and all of the cost for death and disability benefits.VestingMembers are vested for pension benefits when they have at least eight years of service credit. SLEP members arevested for a SLEP pension when they have at least 20 years of SLEP service credit. SLEP members with more thaneight years of service but less than 20 years of SLEP service will receive a Regular pension.RefundsNon-vested members who stop working in an <strong>IMRF</strong> qualified position can receive a lump sum refund of their<strong>IMRF</strong> contributions. Vested members can receive a lump sum refund of their <strong>IMRF</strong> contributions if they are notretirement age or they may leave the contributions with <strong>IMRF</strong> until they reach retirement age.Members who retire without an eligible spouse (married to the member at least one year before the memberterminates <strong>IMRF</strong> participation), will receive a refund of their surviving spouse contributions with interest.If upon a member’s death all of the member contributions were not paid as a refund or pension, the beneficiarywill receive the remainder of the <strong>IMRF</strong> contributions, with interest.Pension CalculationsA Regular <strong>IMRF</strong> pension is:◆ 1-2/3 percent of the final rate of earnings for each of the first 15 years of service credit, plus◆ 2 percent for each year of service credit in excess of 15 years.The maximum pension at retirement cannot exceed 75 percent of the final rate of earnings.A SLEP pension is:◆ 2-1/2 percent of the final rate of earnings for each of the first 20 years of service, plus◆ 2 percent for each year of service between 20 and 30 years of service, plus◆ 1 percent of the final rate of earnings for each year of service credit in excess of 30 years.The maximum pension at retirement cannot exceed 75 percent of the final rate of earnings.60 Illinois Municipal Retirement Fund
Summary of Benefits (continued)An ECO pension is:◆ 3 percent of the final salary for each of the first eight years of service, plus◆ 4 percent for each year of service between eight and 12 years of service, plus◆ 5 percent for years of service credit over 12.The maximum pension at retirement cannot exceed 80 percent of the final rate of earnings.Actuarial SectionAn <strong>IMRF</strong> pension is paid for life and is increased by 3 percent of the original amount on January 1 of each year afterthe member retires. The increase for the first year is prorated for the number of months the member was onretirement.Final rate of earnings, for Regular and SLEP members, are the highest total earnings during any forty-eightconsecutive months within the last 10 years of <strong>IMRF</strong> service divided by 48. The final salary for ECO members isthe annual salary of the ECO member on the day he or she retires.Normal retirement for an unreduced pension is age 60. Members may retire as early as age 55 with a reducedpension. The reduction is the lesser of:◆ one-fourth percent for each month the member is under age 60, or◆ one-fourth percent for each month of service less than 35 years.Service CreditService credit is the total time under <strong>IMRF</strong>, stated in years and fractions. Service is credited monthly while themember is working, receiving <strong>IMRF</strong> disability benefits or on <strong>IMRF</strong>’s Benefit Protection Leave.Members may qualify for a maximum of one year of additional service credit for unused, unpaid sick leaveaccumulated with the last employer. This additional service credit applies only for members leaving employment forretirement. The service credit is earned at the rate of one month for every 20 days of unused, unpaid sick leave orfraction thereof.<strong>IMRF</strong> is under the Reciprocal Act, as are all other Illinois public pension systems, except local police and firepension funds. Under the Reciprocal Act, service credit, of at least one year, may be considered together at the dateof retirement or death for the purpose of determining eligibility for and amount of benefits.Early Retirement Incentive<strong>IMRF</strong> employers may offer an early retirement incentive (ERI) program to their employees who are over 50 yearsof age and who have more than 20 years of service credit. Eligible members may purchase up to five years of servicecredit and age. Employers must pay off the additional ERI liability within 10 years. Subsequent ERI programs maybe offered by an employer after the liability for the previous ERI program is paid.Supplemental Retirement BenefitsEach July <strong>IMRF</strong> provides a supplemental benefit payment to <strong>IMRF</strong> retirees and surviving spouses that havereceived <strong>IMRF</strong> pension payments for the preceding 12 months. The supplemental benefit payment amount willvary, depending on the dollar amount to be distributed and the number of persons eligible.Disability BenefitsRegular and SLEP members are eligible for disability benefits if they:◆ have at least 12 consecutive months of service credit since being enrolled in <strong>IMRF</strong>,◆ have at least nine months of service credit in the 12 months immediately prior to becoming disabled,◆ are unable to perform the duties of any position which might reasonably be assigned by the <strong>IMRF</strong>employer because of any illness, injury or other physical or mental condition, and◆ are not receiving any earnings for any employer.Illinois Municipal Retirement Fund 61
Actuarial SectionSummary of Benefits (continued)The monthly disability benefit payment is equal to 50 percent of the average monthly earnings based on the 12months prior to the month the member became disabled.ECO members are eligible for ECO disability benefits if they:◆ have at least 12 consecutive months of service credit since being enrolled in <strong>IMRF</strong>,◆ are in an elected county office at the time the disability occurred,◆ are making ECO contributions at the time the disability occurred,◆ are unable to reasonably perform the duties of office,◆ have resigned their office, and◆ have two licensed physicians approved by <strong>IMRF</strong> certify that the ECO member is permanently disabled.The monthly disability benefit is equal to the greater of:◆ 50 percent of his or her annualized salary payable on the last day of ECO participation divided by 12◆ or, the retirement benefit earned to date up to a maximum of 66-2/3 percent.Disability benefits under all plans are offset by Social Security or worker’s compensation benefits. If disabledmembers receive Social Security disability and/or worker’s compensation benefits, <strong>IMRF</strong> pays the differencebetween those benefits and 50 percent of the member’s average monthly earnings. However, <strong>IMRF</strong> pays aminimum monthly benefit of $10. Members on disability earn pension service credit as if they were working.Death BenefitsBeneficiary(ies) of active members who have more than one year of service or whose death is job related are entitledto lump sum <strong>IMRF</strong> death benefits. If the member was not vested or vested without an eligible spouse, the deathbenefit is a lump sum equal to one year’s earnings plus a refund of the member contributions with interest. Eligiblespouses of deceased vested active members may choose the lump sum or a monthly surviving spouse pension.Beneficiary(ies) of an inactive member receive a lump sum payment of the member’s contributions, plus interest.If the beneficiary is an eligible spouse, he or she may choose between the lump sum payment, or a death benefit of$3,000 plus a monthly surviving spouse pension.Beneficiary(ies) of a retired member receive a $3,000 death benefit. Eligible spouses also receive a survivingspouse pension.Surviving Spouse PensionFor Regular and SLEP members, a surviving spouse’s monthly pension is one-half of the member’s pension.However, if the spouse is more than five years younger than the member, the pension is actuarially reduced.For ECO members, a surviving spouse’s monthly pension is 66-2/3 percent of the member’s pension. Thispension is payable once the surviving spouse becomes 50 years old. If the spouse is caring for the member’s minor,unmarried children, the spouse will receive (age 50 requirement does not apply):◆ a monthly pension equal to 30 percent of the ECO member’s salary at time of death plus◆ 10 percent of the ECO member’s salary at time of death for each minor, unmarried child.The maximum total monthly benefit payable to spouse and children cannot exceed 50 percent of the ECOmember’s salary at time of death.or◆ a monthly pension equal to 66-2/3 percent of the pension the member had earned.Surviving spouse pensions under all plans are increased each January 1 by three percent of the original amount.The first year may be prorated unless the effective date of the benefit is January 1.62 Illinois Municipal Retirement Fund
Changes in Plan ProvisionsLegislation effective January 26, 2000, changed the following provisions of the Elected County Officials (ECO)Plan. These changes apply to all members who join the ECO Plan after January 25, 2000.◆ The ECO benefit formula is limited to service in an elected county office.◆ The final rate of earnings is changed from the last salary to a four-year average calculated separately for eachoffice held.◆ Eight years of service in each office is required to qualify for an ECO formula.◆ Counties may opt out of the ECO Plan.Actuarial SectionLegislation, awaiting the Governor’s signature to become law, would make the following changes.◆ Surviving spouses may remarry before age 55 without losing their benefits.◆ Members may apply for Benefit Protection Leave more than two years after the leave period.◆ Counties may require ECO members to pay both the member and employer cost when converting Regular orSLEP service credit to ECO service credit.Illinois Municipal Retirement Fund 63
This page intentionally left blank64 Illinois Municipal Retirement Fund
Statistical
Table VIRevenues by sourceLast ten yearsInvestment Earnings Employer ContributionsNet of DirectPercentCalendar Investment of <strong>Annual</strong> MemberYear Expense* Dollars Covered Payroll Contributions Other TotalStatistical Section1990 $225,847,255 $254,963,199 11.12% $107,356,163 $104,730 $588,271,3471991 341,436,905 288,211,812 11.60% 116,512,288 52,370 746,213,3751992 533,054,735 316,452,098 11.97% 123,251,394 56,340 972,814,5671993 529,125,672 298,666,790 10.77% 129,790,252 62,476 957,645,1901994 (21,846,226) 314,709,090 10.74% 137,038,998 896 429,902,7591995 1,437,085,113 315,729,600 10.18% 145,302,603 1,646 1,898,118,9621996 1,339,939,094 327,550,353 9.99% 158,107,450 — 1,825,596,8971997 1,550,409,109 336,249,487 9.69% 168,501,275 1,232 2,055,161,1031998 1,416,152,349 364,196,668 9.839% 190,259,213 66,938 1,970,675,168<strong>1999</strong> 2,689,086,076 379,194,892 9.64% 192,356,900 3,030 3,260,640,898*Note: For years including and subsequent to 1994, Net Investment Income includes realized and unrealizedappreciation or depreciation of investments. Preceding years include only realized gains and losses.Table VIIExpenses by typeLast ten yearsCalendar Administrative OtherYear Benefits Refunds Expense Expenses Total1990 $204,611,164 $18,333,470 $ 8,803,008 $ 45,110 $231,792,7521991 222,945,051 18,233,310 10,336,985 107,434 251,622,7801992 243,431,034 18,337,609 12,796,146 24,522 274,589,3111993 282,562,116 17,979,394 16,685,821 72,342 317,299,6731994 304,702,303 17,957,846 15,897,039 — 338,557,1881995 332,685,282 22,261,910 14,756,916 — 369,704,1081996 368,737,972 23,520,078 14,135,868 — 406,393,9181997 410,417,029 26,088,854 14,700,542 — 451,206,4251998 451,496,766 27,121,071 16,527,175 — 495,145,012<strong>1999</strong> 496,363,836 28,126,601 16,186,656 — 540,677,09366 Illinois Municipal Retirement Fund
Table VIIIBenefit expense by typeLast ten yearsDEATHDISABILITYCalendarYear Supplemental Refund Burial Residual Permanent TemporaryStatistical Section1990 $6,065,129 $3,446,996 $4,428,360 $237,499 $2,113,394 $4,613,4391991 6,674,977 3,586,516 4,413,706 171,348 2,351,722 4,654,2921992 6,623,552 3,603,942 5,170,634 177,030 2,677,124 5,058,8371993 6,579,926 4,296,758 5,045,965 172,088 2,744,544 5,465,7981994 6,450,051 3,488,386 4,870,740 209,649 2,845,529 5,374,4721995 6,915,904 4,009,076 4,603,677 204,249 2,792,032 5,827,1161996 6,537,240 5,669,342 4,986,510 311,381 3,296,993 5,808,8601997 7,083,244 5,376,069 5,458,990 493,928 3,089,085 5,274,9001998 7,534,697 5,912,822 5,585,751 516,511 3,093,157 5,130,272<strong>1999</strong> 7,107,276 5,440,949 6,234,757 155,382 3,150,728 5,286,122ANNUITIESREFUNDSCalendarSurvivingYear Retirement Spouse Beneficiary Supplemental Separation Other Total1990 $171,914,170 $11,436,633 $355,544 $18,160,198 $62,272 $222,833,6341991 187,891,475 12,816,774 384,241 18,154,227 79,083 241,178,3611992 205,294,881 14,428,285 396,749 18,016,467 321,142 261,768,6431993 225,233,604 16,208,834 429,084 $16,385,515 17,442,746 536,648 300,541,5101994 245,173,134 17,802,311 470,642 18,017,389 17,797,355 160,491 322,660,1491995 268,714,165 20,123,119 513,544 18,982,400 21,872,917 388,993 354,947,1921996 298,852,567 22,359,163 553,216 20,362,701 23,342,975 177,103 392,258,0501997 336,784,723 24,815,833 615,880 21,424,377 25,760,143 328,711 437,502,8761998 374,124,084 26,334,572 635,074 22,629,826 26,589,126 531,945 478,617,837<strong>1999</strong> 414,515,394 29,272,679 697,985 24,502,564 27,998,118 128,483 524,490,437Illinois Municipal Retirement Fund 67
Statistical SectionTable IXAverage benefit payment amountsLast ten yearsSingle Sum PaymentsRecurring PaymentsCalendar Separation Lump Sum <strong>Annual</strong> <strong>Annual</strong>Year Refunds Death Benefit Disability (1) Retirement (2)1990 $1,499 $16,312 $9,051 $6,4871991 1,497 17,659 9,260 6,9671992 1,501 18,452 10,019 7,3511993 1,680 18,677 10,085 7,5471994 1,906 19,380 8,663 6,8171995 1,990 21,518 10,861 8,6161996 1,974 22,002 11,188 10,2321997 1,859 21,779 11,764 10,6431998 1,966 32,627 12,059 10,415<strong>1999</strong> 2,027 30,645 12,355 10,102(1) Prior to Social Security and workers’ compensation offsets.(2) Prior to level option reduction.Average <strong>Annual</strong> Benefit Payment Amountsin thousands$15DisabilityRetirement$12$9$6199019911992199319941995199619971998<strong>1999</strong>68 Illinois Municipal Retirement Fund
Table XNumber of actively participating employersLast ten yearsCalendarSchoolYear End Cities Villages Counties Districts Townships Other TotalStatistical Section1990 233 286 101 953 325 608 2,5061991 234 296 101 948 335 635 2,5491992 235 308 101 943 350 668 2,6051993 238 312 101 923 359 677 2,6101994 240 321 101 910 368 683 2,6231995 242 329 101 902 376 690 2,6401996 244 341 101 902 387 704 2,6791997 245 347 101 898 402 713 2,7061998 247 356 101 894 417 729 2,744<strong>1999</strong> 247 363 101 893 425 739 2,768Table XINumber of actively participating membersLast ten yearsCalendar Male FemaleYear End Participants Participants Total1990 49,121 71,527 120,6481991 50,442 74,511 124,9531992 50,804 75,139 125,9431993 52,769 77,294 130,0631994 50,257 76,451 126,7081995 52,778 80,995 133,7731996 55,255 86,791 142,0461997 56,424 90,235 146,6591998 57,181 93,247 150,428<strong>1999</strong> 58,419 97,098 155,517Illinois Municipal Retirement Fund 69
Statistical SectionTable XIIParticipating members’ length of serviceLast ten yearsTotalCalendar Active Under 1 to 4 5 to 9 10 to 14 15 YearsYear Members 1 Year Years Years Years and Over1990 120,648 17,150 41,785 24,995 19,632 17,0861991 124,953 16,301 44,413 25,887 20,319 18,0331992 125,943 14,284 45,174 27,715 19,095 19,6751993 130,063 18,089 42,972 29,898 17,813 21,2911994 126,708 14,386 39,653 32,060 18,182 22,4271995 133,733 16,014 40,105 34,162 18,846 24,6461996 142,046 18,464 42,166 33,826 19,497 28,0931997 146,659 20,761 44,506 32,651 20,759 27,9821998 150,428 21,503 46,464 32,060 22,291 28,110<strong>1999</strong> 155,517 22,831 48,532 31,371 23,602 29,181Table XIIIDistribution of current annuitants by pension amountRetirement Survivor All AnnuitiesNumber of Number of Number ofMonthly Pension Amount Males Females Males Females Males FemalesUnder $100 1,166 5,962 767 2,290 1,933 8,252$100 to under $250 2,601 9,894 692 3,503 3,293 13,397$250 to under $500 4,969 9,526 314 2,022 5,283 11,548$500 to under $750 3,326 4,949 70 656 3,396 5,605$750 to under $1,000 2,238 2,820 13 242 2,251 3,062$1,000 to under $2,000 4,108 3,344 5 188 4,113 3,532$2,000 to under $3,000 1,437 424 9 1,437 433$3,000 to under $4,000 519 66 519 66$4,000 and over 199 11 199 11Total 20,563 36,996 1,861 8,910 22,424 45,906Note: Counts do not include disabilitants70 Illinois Municipal Retirement Fund
Table XIVAnalysis of Initial Retirement BenefitsYears of Credited Service8-9 10-14 15-19 20-24 25-29 30-34 35-39 TotalRegular Plan1996 Avg. Monthly Annuity $224 $231 $557 $819 $1,043 $1,474 $2,055 $765Avg. Monthly FRE $1,588 $1,676 $1,944 $2,128 $2,124 $2,534 $2,912 $2,013Number of Retirees 404 706 686 474 643 335 174 3,422Statistical Section1997 Avg. Monthly Annuity $221 $336 $544 $817 $1,175 $1,514 $2,096 $769Avg. Monthly FRE $1,577 $1,714 $1,874 $2,151 $2,413 $2,593 $2,986 $2,055Number of Retirees 462 749 746 526 689 307 160 3,6391998 Avg. Monthly Annuity $236 $365 $601 $833 $1,309 $1,677 $2,637 $894Avg. Monthly FRE $1,667 $1,860 $2,074 $2,182 $2,695 $2,898 $3,767 $2,286Number of Retirees 444 696 638 523 535 324 231 3,391<strong>1999</strong> Avg. Monthly Annuity $235 $368 $623 $853 $1,334 $1,845 $2,810 $864Avg. Monthly FRE $1,647 $1,853 $2,176 $2,247 $2,755 $3,184 $4,036 $2,302Number of Retirees 409 774 591 588 453 294 148 3,257Sheriff’s Law Enforcement Personnel Plan (SLEP)1996 Avg. Monthly Annuity $1,668 $2,439 $2,631 $2,144Avg. Monthly FRE $3,187 $3,837 $3,879 $3,576Number of Retirees 20 24 5 491997 Avg. Monthly Annuity $1,719 $2,509 $3,036 $5,235 $2,582Avg. Monthly FRE $3,210 $4,083 $4,407 $6,981 $4,070Number of Retirees 22 29 29 3 831998 Avg. Monthly Annuity $1,615 $2,212 $2,905 $4,219 $2,230Avg. Monthly FRE $3,192 $3,803 $4,444 $5,625 $3,795Number of Retirees 30 22 22 2 76<strong>1999</strong> Avg. Monthly Annuity $1,752 $2,820 $3,531 $2,609Avg. Monthly FRE $3,306 $4,450 $5,279 $4,278Number of Retirees 25 23 18 66Elected County Official Plan (ECO) Plan began in 19971997 Avg. Monthly Annuity $2,348 $2,600 $2,474Avg. Monthly FRE $2,935 $3,250 $3,093Number of Retirees 1 1 21998 Avg. Monthly Annuity $677 $1,181 $2,011 $2,506 $2,422 $1,595Avg. Monthly FRE $1,230 $2,745 $2,317 $2,715 $3,028 $2,415Number of Retirees 3 8 6 3 1 21<strong>1999</strong> Avg. Monthly Annuity $1,158 $2,402 $670 $1,344Avg. Monthly FRE $2,887 $2,895 $837 $2,434Number of Retirees 4 3 2 9FRE = Final Rate of Earnings used to calculate retirement benefitNote: This schedule excludes members retiring with money purchase benefits, reciprocal benefits or multiple plans.Illinois Municipal Retirement Fund 71
Statistical SectionTable XVAnnuitants by AgeRetirees Surviving Spouses BeneficiariesAges Male Female Total Male Female Total Male Female TotalUnder 55 358 121 479 5 110 115 19 54 7355 to 59 1,374 2,826 4,200 14 161 175 6 25 3160 to 64 2,663 5,621 8,284 66 382 448 6 27 3365 to 69 4,127 7,611 11,738 143 770 913 7 31 3870 to 74 4,426 7,469 11,895 330 1,340 1,670 7 25 3275 to 79 3,772 6,325 10,097 495 1,920 2,415 6 41 4780 to 84 2,387 4,115 6,502 438 1,938 2,376 4 25 2985 to 89 1,126 2,030 3,156 240 1,327 1,567 2 16 1890 to 94 276 709 985 63 540 603 4 495 to 100 50 155 205 10 150 160 4 4100 and over 4 14 18 0 20 20Total 20,563 36,996 57,559 1,804 8,658 10,462 57 252 309Note: Counts do not include disabilitantsTable XVIActive Members by AgeSheriff’s LawElected CountyAll Plans Enforcement Personnel OfficialsAges Male Female Total Male Female Total Male Female TotalUnder 20 337 596 93320 to 29 7,781 10,585 18,366 623 95 718 4 1 530 to 39 13,928 20,201 34,129 1,184 168 1,352 42 15 5740 to 49 18,291 34,289 52,580 1,132 156 1,288 153 69 22250 to 54 6,979 14,349 21,328 301 42 343 80 38 11855 to 59 5,260 9,727 14,987 133 22 155 56 23 7960 to 69 4,815 6,502 11,317 82 20 102 105 30 13570 and over 1,028 849 1,877 7 7 44 7 51Total 58,419 97,098 155,517 3,462 503 3,965 484 183 66772 Illinois Municipal Retirement Fund
Administration ________________________________________________________________________________Robert CusmaExecutive DirectorLinda BieniekHuman Resources ManagerWillette ShambleySecurity/H.R.AdministratorMaureen EnrightExecutive SecretaryPatti MillerTraining & RecruitmentAdministratorMarianna BarnerSecretary/HR AssistantCarina MacapagalAsst. Internal AuditorFinance ______________________________________________________________________________________Deanna LockwoodChief <strong>Financial</strong> OfficerPatricia HambrickAccounting ManagerFidel QuinteroFinance SystemsAdministratorGuillermo HernandezFinance SystemsAdministratorKathy DuggerImaging AnalystSharon JohnsonMember Acct. AnalystSandy JoplinSecretary FinanceBruce SultanOperations AnalystPhyllis WalkerEmployer Acct. AnalystStefanie HamptonEmployer Acct. AnalystJames SplittControl Unit SupervisorTamyra RandSenior AccountantC. Aurora O’NealAccountantMaria RamirezAccountantBarbara RegisAccountantDenise ValentovichPast Service UnitSupervisorCarol AldridgeSenior Accounting ClerkLaDawn GoodwinSenior Accounting ClerkRenea JenkinsSenior Accounting ClerkDonna MoriartySenior Accounting ClerkSandra OlingerSenior Accounting ClerkMichael SmithSenior Accounting ClerkLinda YessinSenior Accounting ClerkDonnis RobinsonAudit SupervisorAudrey Brown-RyceAudit ClerkDenise BrownAudit ClerkBelinda DavisAudit ClerkCorey LockwoodAudit ClerkCornelius FosterWage <strong>Report</strong>s UnitSupervisorHelen HuangAccounting Staff AssistantCassandra JordanSenior Accounting ClerkDionne GreenSenior Accounting ClerkJames BrunkeAccounting ClerkTeresa FranklinAccounting ClerkNicole MillerAccounting ClerkBetty Perez-ManaresAccounting ClerkMaria ContiMagnetic Media ProcessorPatricia ZielinskiTreasury Unit SupervisorMaris BertrandSenior Accounting ClerkRichard CaragolSenior AccountingClerk/Past ServiceVirginia NewsomSenior AccountingClerk/Past ServiceSharon GrantSenior Accounting ClerkDebbie ZiembaSenior Accounting Clerk<strong>IMRF</strong> StaffInvestments ____________________________________________________________________________________________Walter KoziolDirectorEdward SambolInvestment ManagerAmy BulgerInvestment AnalystRobert NoeInvestment AnalystKaren SeplakInvestment AnalystSusie VillarrealInvestment AnalystTom WinkelmanInvestment AnalystJoanne ReeseAssoc. Invest. AnalystCarol LindstromInvestment Data AnalystLiz NullGeneral SecretaryLegal Affairs & Member Services __________________________________________________________________________Louis KosibaGeneral CounselKathleen O’BrienChief CounselNicholas YelvertonLegislative LiaisonTerry O’ConnorField Services ManagerLinda HorrellCommunications ManagerNancy BurdaCommunications AssistantJane CampbellCommunications SpecialistMark SwaineDocumentation SpecialistTecya AndersonField RepresentativeCarol GummersonField RepresentativePaul PariseField RepresentativeJean ParsonField RepresentativeWilliam PettryField RepresentativeJon RennerField RepresentativeIrma RodriguezField RepresentativeCarolyn DiggsField Serv.General Sec’y.Della BerryLegal SecretarySarah TaylorField Services ClerkConnie FoxSupervisor Member Serv.Meena BallalMember Services Rep.Carla BermesMember Services Rep.Maria Olivas-CastellanosMember Services Rep.Anmarie DresdenMember Services Rep.Lisa FoleyMember Services Rep.Miriam GutierrezMember Services Rep.Augusta LewisMember Services Rep.Kathryn MullenMember Services Rep.Carol OrtmanMember Services Rep.Kate SetchellMember Services Rep.Clara StrongMember Services Rep.Illinois Municipal Retirement Fund 73
<strong>IMRF</strong> StaffOperations & PlanningDan DuquetteDirector__________________________________________________________________________________Benefits ________________________________________________________________________________________________Tom RaittManagerMargarita CardenasDisability SystemsAdministratorElba RamirezBenefit SystemsAdministratorPatricia SpenaBenefits SupervisorLouise HenleyDisability SupervisorLarry DixonDisability Data AnalystApril CookDisability ClaimsExaminerDebra HawkinsDisability ClaimsExaminerSusan KonDisability ClaimsExaminerCarl SorensenDisability ClaimsExaminerBridgette ReadusDisability Claims ExaminerGary SeputisDisability ClaimsExaminerDonna WatsonDisability ClaimsExaminerNorberto MaglunogBenefit Data AnalystPhyllis FikejsClaims ExaminerLouise HooperClaims ExaminerJoAnne KendallClaims ExaminerHelen KorandaClaims ExaminerViolet PerezClaims ExaminerPaula RimgailaClaims ExaminerDawn WickartClaims ExaminerCarol KrassBenefit Systems AnalystRhonda DikselisBenefits Staff AssistantMicheline PascallBenefits Staff AssistantInformation Services ____________________________________________________________________________________Arnold RohlwingManagerGerald CaseyPC/LAN/Telecom ManagerMark MiddletonManager—ApplicationSystemsMax FiererTechnical Services ManagerDeborah CarlsenMember/Employer SystemsTeam LeaderJane YoungArchitectDebbie McNultyQuality Assurance AnalystBarb BartoszukSr.Programmer AnalystTom DechnikProgrammer AnalystJacqueline MontgomeryProgrammer AnalystMichael KorenevskyBenefit/Payments TeamLeaderEric CharmoliArchitectElaine Humiston ZalsmanBusiness AnalystMarge GraySr.Programmer AnalystTimothy HosterSr.Programmer AnalystJoe PrincipeProgrammer AnalystPeter DePetroProgrammer AnalystNeil EubanksProgrammerNicole FrisoneProgrammerDennis Dunn<strong>Financial</strong> SystemsTeam LeaderTammie ChanArchitectKeyla VivasArchitectLouise Olivo-KierBusiness AnalystJulie MillerProgrammer AnalystTom O’DonnellProgrammerStephen LundquistSystems ProgrammerAndrew YoungdahlSystems ProgrammerEllen SimsohnLAN AdministratorJohn BoyleSr. PC/LAN Support StaffJeff HeidenPC/LAN Support StaffCollette BeranTelecom Support SpecialistRon DaliegeData Base AnalystAnnie ColeComputer Rm. SupervisorKenneth TeagueSenior OperatorJames TerrellSenior OperatorJoe PrioryDistributed Systems TeamLeaderTodd KorellWeb DeveloperPam ArndtWeb DeveloperJean OnoroPT Data EntryOffice Services __________________________________________________________________________________________Denise StreitOffice Services ManagerDave BuchananCopier OperatorSusan JoachimiPurchasing/MaintenanceCoordinatorHerbert TrotterMail Services SupervisorAlicia BarnettRecords SupervisorDerrick EilandSenior Mail Center ClerkCharles JacksonSenior Mail Center ClerkDarrell ThomasSenior Mail Center ClerkAlex ValdezSenior Mail Center ClerkEmily DominguezSenior File ClerkNicole LittleData Entry OperatorMary BavettaData Entry OperatorLinda CastellanoData Entry OperatorArcola Dozier-WilliamsData Entry OperatorCarol JonesData Entry OperatorMaryann BeendersImaging ClerkSean BrownImaging ClerkDonna CesarioImaging ClerkTina CressImaging ClerkMichelle MeyerImaging ClerkAnita RobinsonImaging ClerkDawn SavageImaging ClerkMaria HigginsEnrollment AuditorMarissa MalabEnrollment AuditorThea TomczykEnrollment AuditorSheila Adams EvansConsole AttendantReceptionist74 Illinois Municipal Retirement Fund