1999 IMRF Comprehensive Annual Financial Report
1999 IMRF Comprehensive Annual Financial Report
1999 IMRF Comprehensive Annual Financial Report

Create successful ePaper yourself
Turn your PDF publications into a flip-book with our unique Google optimized e-Paper software.
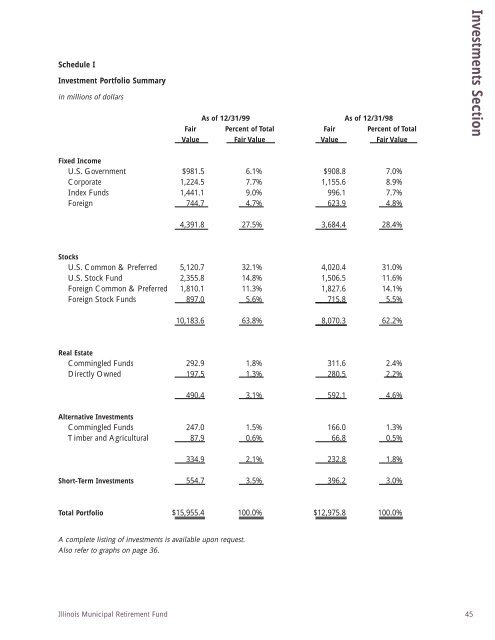
Schedule IInvestment Portfolio Summaryin millions of dollarsAs of 12/31/99 As of 12/31/98Fair Percent of Total Fair Percent of TotalValue Fair Value Value Fair ValueInvestments SectionFixed IncomeU.S. Government $981.5 6.1% $908.8 7.0%Corporate 1,224.5 7.7% 1,155.6 8.9%Index Funds 1,441.1 9.0% 996.1 7.7%Foreign 744.7 4.7% 623.9 4.8%4,391.8 27.5% 3,684.4 28.4%StocksU.S. Common & Preferred 5,120.7 32.1% 4,020.4 31.0%U.S. Stock Fund 2,355.8 14.8% 1,506.5 11.6%Foreign Common & Preferred 1,810.1 11.3% 1,827.6 14.1%Foreign Stock Funds 897.0 5.6% 715.8 5.5%10,183.6 63.8% 8,070.3 62.2%Real EstateCommingled Funds 292.9 1.8% 311.6 2.4%Directly Owned 197.5 1.3% 280.5 2.2%490.4 3.1% 592.1 4.6%Alternative InvestmentsCommingled Funds 247.0 1.5% 166.0 1.3%Timber and Agricultural 87.9 0.6% 66.8 0.5%334.9 2.1% 232.8 1.8%Short-Term Investments 554.7 3.5% 396.2 3.0%Total Portfolio $15,955.4 100.0% $12,975.8 100.0%A complete listing of investments is available upon request.Also refer to graphs on page 36.Illinois Municipal Retirement Fund 45