1999 IMRF Comprehensive Annual Financial Report
1999 IMRF Comprehensive Annual Financial Report
1999 IMRF Comprehensive Annual Financial Report

Create successful ePaper yourself
Turn your PDF publications into a flip-book with our unique Google optimized e-Paper software.
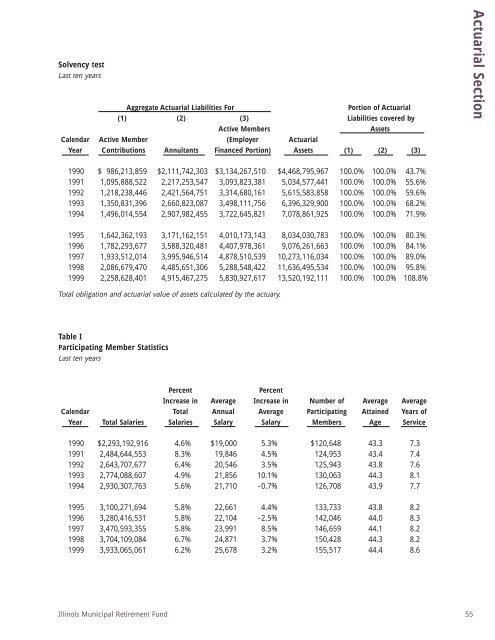
Solvency testLast ten yearsAggregate Actuarial Liabilities ForPortion of Actuarial(1) (2) (3) Liabilities covered byActive MembersAssetsCalendar Active Member (Employer ActuarialYear Contributions Annuitants Financed Portion) Assets (1) (2) (3)Actuarial Section1990 $ 986,213,859 $2,111,742,303 $3,134,267,510 $4,468,795,967 100.0% 100.0% 43.7%1991 1,095,888,522 2,217,253,547 3,093,823,381 5,034,577,441 100.0% 100.0% 55.6%1992 1,218,238,446 2,421,564,751 3,314,680,161 5,615,583,858 100.0% 100.0% 59.6%1993 1,350,831,396 2,660,823,087 3,498,111,756 6,396,329,900 100.0% 100.0% 68.2%1994 1,496,014,554 2,907,982,455 3,722,645,821 7,078,861,925 100.0% 100.0% 71.9%1995 1,642,362,193 3,171,162,151 4,010,173,143 8,034,030,783 100.0% 100.0% 80.3%1996 1,782,293,677 3,588,320,481 4,407,978,361 9,076,261,663 100.0% 100.0% 84.1%1997 1,933,512,014 3,995,946,514 4,878,510,539 10,273,116,034 100.0% 100.0% 89.0%1998 2,086,679,470 4,485,651,306 5,288,548,422 11,636,495,534 100.0% 100.0% 95.8%<strong>1999</strong> 2,258,628,401 4,915,467,275 5,830,927,617 13,520,192,111 100.0% 100.0% 108.8%Total obligation and actuarial value of assets calculated by the actuary.Table IParticipating Member StatisticsLast ten yearsPercentPercentIncrease in Average Increase in Number of Average AverageCalendar Total <strong>Annual</strong> Average Participating Attained Years ofYear Total Salaries Salaries Salary Salary Members Age Service1990 $2,293,192,916 4.6% $19,000 5.3% $120,648 43.3 7.31991 2,484,644,553 8.3% 19,846 4.5% 124,953 43.4 7.41992 2,643,707,677 6.4% 20,546 3.5% 125,943 43.8 7.61993 2,774,088,607 4.9% 21,856 10.1% 130,063 44.3 8.11994 2,930,307,763 5.6% 21,710 -0.7% 126,708 43.9 7.71995 3,100,271,694 5.8% 22,661 4.4% 133,733 43.8 8.21996 3,280,416,531 5.8% 22,104 -2.5% 142,046 44.0 8.31997 3,470,593,355 5.8% 23,991 8.5% 146,659 44.1 8.21998 3,704,109,084 6.7% 24,871 3.7% 150,428 44.3 8.2<strong>1999</strong> 3,933,065,061 6.2% 25,678 3.2% 155,517 44.4 8.6Illinois Municipal Retirement Fund 55