Excelsior Multi-Manager Conservative Portfolio - Liberty
Excelsior Multi-Manager Conservative Portfolio - Liberty
Excelsior Multi-Manager Conservative Portfolio - Liberty

You also want an ePaper? Increase the reach of your titles
YUMPU automatically turns print PDFs into web optimized ePapers that Google loves.
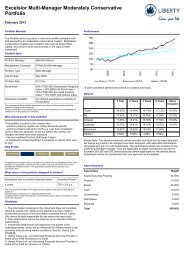
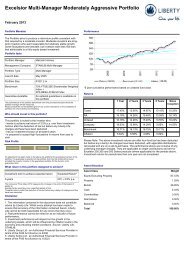
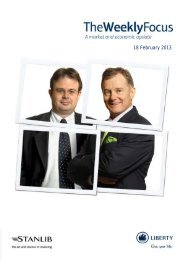
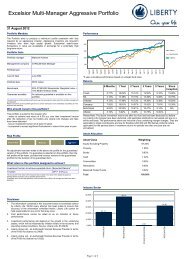
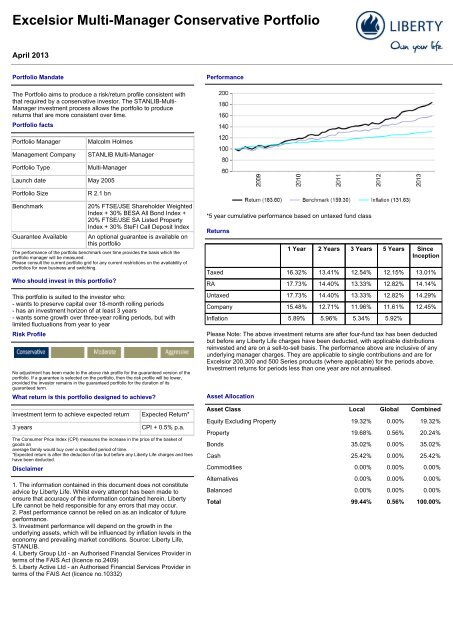
<strong>Excelsior</strong> <strong>Multi</strong>-<strong>Manager</strong> <strong>Conservative</strong> <strong>Portfolio</strong>April 2013<strong>Portfolio</strong> MandatePerformanceThe <strong>Portfolio</strong> aims to produce a risk/return profile consistent withthat required by a conservative investor. The STANLIB-<strong>Multi</strong>-<strong>Manager</strong> investment process allows the portfolio to producereturns that are more consistent over time.<strong>Portfolio</strong> facts<strong>Portfolio</strong> <strong>Manager</strong>Management Company<strong>Portfolio</strong> TypeMalcolm HolmesSTANLIB <strong>Multi</strong>-<strong>Manager</strong><strong>Multi</strong>-<strong>Manager</strong>Launch date May 2005<strong>Portfolio</strong> SizeR 2.1 bnBenchmarkGuarantee Available20% FTSE/JSE Shareholder WeightedIndex + 30% BESA All Bond Index +20% FTSE/JSE SA Listed PropertyIndex + 30% SteFI Call Deposit IndexAn optional guarantee is available onthis portfolioThe performance of the portfolio benchmark over time provides the basis which theportfolio manager will be measured.Please consult the current portfolio grid for any current restrictions on the availability ofportfolios for new business and switching.Who should invest in this portfolio?This portfolio is suited to the investor who:- wants to preserve capital over 18-month rolling periods- has an investment horizon of at least 3 years- wants some growth over three-year rolling periods, but withlimited fluctuations from year to yearRisk ProfileNo adjustment has been made to the above risk profile for the guaranteed version of theportfolio. If a guarantee is selected on the portfolio, then the risk profile will be lower,provided the investor remains in the guaranteed portfolio for the duration of itsguaranteed term.What return is this portfolio designed to achieve?Investment term to achieve expected returnExpected Return*3 years CPI + 0.5% p.a.The Consumer Price Index (CPI) measures the increase in the price of the basket ofgoods anaverage family would buy over a specified period of time.*Expected return is after the deduction of tax but before any <strong>Liberty</strong> Life charges and feeshave been deducted.Disclaimer1. The information contained in this document does not constituteadvice by <strong>Liberty</strong> Life. Whilst every attempt has been made toensure that accuracy of the information contained herein, <strong>Liberty</strong>Life cannot be held responsible for any errors that may occur.2. Past performance cannot be relied on as an indicator of futureperformance.3. Investment performance will depend on the growth in theunderlying assets, which will be influenced by inflation levels in theeconomy and prevailing market conditions. Source: <strong>Liberty</strong> Life,STANLIB.4. <strong>Liberty</strong> Group Ltd - an Authorised Financial Services Provider interms of the FAIS Act (licence no.2409)5. <strong>Liberty</strong> Active Ltd - an Authorised Financial Services Provider interms of the FAIS Act (licence no.10332)*5 year cumulative performance based on untaxed fund classReturns1 Year 2 Years 3 Years 5 Years SinceInceptionTaxed 16.32% 13.41% 12.54% 12.15% 13.01%RA 17.73% 14.40% 13.33% 12.82% 14.14%Untaxed 17.73% 14.40% 13.33% 12.82% 14.29%Company 15.48% 12.71% 11.96% 11.61% 12.45%Inflation 5.89% 5.96% 5.34% 5.92%Please Note: The above investment returns are after four-fund tax has been deductedbut before any <strong>Liberty</strong> Life charges have been deducted, with applicable distributionsreinvested and are on a sell-to-sell basis. The performance above are inclusive of anyunderlying manager charges. They are applicable to single contributions and are for<strong>Excelsior</strong> 200,300 and 500 Series products (where applicable) for the periods above.Investment returns for periods less than one year are not annualised.Asset AllocationAsset Class Local Global CombinedEquity Excluding Property 19.32% 0.00% 19.32%Property 19.68% 0.56% 20.24%Bonds 35.02% 0.00% 35.02%Cash 25.42% 0.00% 25.42%Commodities 0.00% 0.00% 0.00%Alternatives 0.00% 0.00% 0.00%Balanced 0.00% 0.00% 0.00%Total 99.44% 0.56% 100.00%
<strong>Excelsior</strong> <strong>Multi</strong>-<strong>Manager</strong> <strong>Conservative</strong> <strong>Portfolio</strong>April 2013Sector BreakdownTop 10 Equity Holdings (percentage of total portfolio)SASOL LTD 1.37%ANGLO AMERICAN PLC 1.16%MTN GROUP LTD 1.16%STANDARD BANK GROUP LTD 1.10%British American Tobacco plc 0.88%BHP BILLITON PLC 0.85%NASPERS LTD 0.83%SABMiller plc 0.65%Old Mutual plc 0.45%MONDI PLC 0.41%Total 8.86%<strong>Excelsior</strong> <strong>Multi</strong>-<strong>Manager</strong> <strong>Conservative</strong> <strong>Portfolio</strong> Equities BondsCashProperty