AP Statistics Syllabus.pdf - Spokane Public Schools
AP Statistics Syllabus.pdf - Spokane Public Schools
AP Statistics Syllabus.pdf - Spokane Public Schools

Create successful ePaper yourself
Turn your PDF publications into a flip-book with our unique Google optimized e-Paper software.
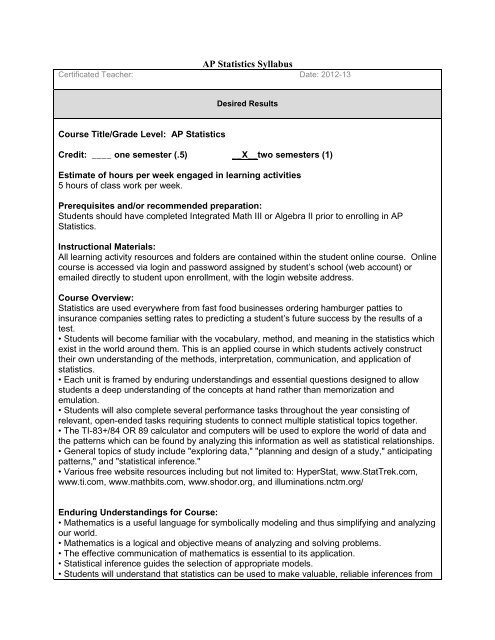
<strong>AP</strong> <strong>Statistics</strong> <strong>Syllabus</strong>Certificated Teacher: Date: 2012-13Desired ResultsCourse Title/Grade Level: <strong>AP</strong> <strong>Statistics</strong>Credit: ____ one semester (.5) __X__two semesters (1)Estimate of hours per week engaged in learning activities5 hours of class work per week.Prerequisites and/or recommended preparation:Students should have completed Integrated Math III or Algebra II prior to enrolling in <strong>AP</strong><strong>Statistics</strong>.Instructional Materials:All learning activity resources and folders are contained within the student online course. Onlinecourse is accessed via login and password assigned by student’s school (web account) oremailed directly to student upon enrollment, with the login website address.Course Overview:<strong>Statistics</strong> are used everywhere from fast food businesses ordering hamburger patties toinsurance companies setting rates to predicting a student’s future success by the results of atest.• Students will become familiar with the vocabulary, method, and meaning in the statistics whichexist in the world around them. This is an applied course in which students actively constructtheir own understanding of the methods, interpretation, communication, and application ofstatistics.• Each unit is framed by enduring understandings and essential questions designed to allowstudents a deep understanding of the concepts at hand rather than memorization andemulation.• Students will also complete several performance tasks throughout the year consisting ofrelevant, open-ended tasks requiring students to connect multiple statistical topics together.• The TI-83+/84 OR 89 calculator and computers will be used to explore the world of data andthe patterns which can be found by analyzing this information as well as statistical relationships.• General topics of study include "exploring data," "planning and design of a study," anticipatingpatterns," and "statistical inference."• Various free website resources including but not limited to: HyperStat, www.StatTrek.com,www.ti.com, www.mathbits.com, www.shodor.org, and illuminations.nctm.org/Enduring Understandings for Course:• Mathematics is a useful language for symbolically modeling and thus simplifying and analyzingour world.• Mathematics is a logical and objective means of analyzing and solving problems.• The effective communication of mathematics is essential to its application.• Statistical inference guides the selection of appropriate models.• Students will understand that statistics can be used to make valuable, reliable inferences from
empirical information.[See full syllabus for complete list of enduring understandings, essential questions, scope &sequence, etc.]Establish Goals:C2a: The course provides instruction in each of the following four broad conceptual themes outlined in theCourse Description with appropriate emphasis on exploring data.C2b: The course provides instruction in each of the following four broad conceptual themes outlined in theCourse Description with appropriate emphasis on sampling and experimentation.C2c: The course provides instruction in each of the following four broad conceptual themes outlined in theCourse Description with appropriate emphasis on anticipating patterns.C2d: The course provides instruction in each of the following four broad conceptual themes outlined in theCourse Description with appropriate emphasis on statistical inferences.C5: The course teaches students how to use graphing calculators and demonstrates the use ofcomputers and/or computer output to enhance the development of statistical understanding throughexploration and analysis of data, assessment of models, and simulations.C4: The course teaches students how to communicate methods, results, and interpretations using thevocabulary of statistics.Understandings:Unit 1• Interpretation of data is dependent upon thegraphical displays and numerical summaries.[C2a]• Graphical displays are created for the purposeof analysis and communication. [C4]Unit 2• Regression is an effective model for prediction.[C2a]• There is a difference between causation andcorrelation. [C2a]Unit 3• Careful planning is essential to obtaining validdata. [C2b]• Clarifying the question leads to appropriatemethodology. [C2b]• The analysis is only as good as the data. [C2b]• Students will understand how to deconstructstatistical information in an effort to evaluate itsvalidity and assess the aims of the authors inpresenting the information. [C2b]Unit 4• Probability models are useful tools for makingEssential Questions:Unit 1• How do we communicate data?• How do we understand data?• Can you lie with statistics? How and towhat extent?Unit 2• To what extent can we predict the future?• Is correlation ever causation?• How can modeling data help us tounderstand patterns?Unit 3• How do we obtain data?• To what extent is all data biased?• To what extent does data collectionmethodology affect results?• How can variable be eliminated throughrandomization?• How does one decide between anobservational study, an experiment, and asimulation?• To what extent can data be purposefullybiased?Unit 4
decisions and predictions. [C2c]• Students will understand that probability is thebasis of statistical inference. [C2c]• The notion and behavior of a random variable isfoundational to understanding probabilitydistributions. [C2c]Unit 5 & 6• Many discrete phenomena may be describedand thus predicted by binomial and geometricmodels. [C2b, C2c]• The normal distribution and central limit theoremare essential to analyzing samples of data. [C2b,C2c]Unit 7• Students will understand the underpinnings ofstatistical inference. [C2d]• Inference is based upon chance. [C2d]• Confidence intervals are effective tools forestimation. [C2d]• Tests of significance and confidence intervalsdrive decision making in our world. [C2d]• Error analysis is a critical component ofsignificance testing. [C2d]Unit 8 & 9• Confidence intervals are effective tools forestimating the mean of a population. [C2d]• Significance tests determine the likelihood of asample. [C2d]• The analysis is only as good as the data. [C3]• Confidence intervals are effective tools forestimating the proportion of a population. [C2d]• Significance tests determine the likelihood of asample. [C2d]• When is probability a sure thing?• How can we base decisions on chance?• What is a random variable?• How may random variables be combined?Unit 5 & 6• How can modeling predict the future?• To what extent does our world exhibitbinomial and geometric phenomena?• How do sampling distributions relate topopulation distributions?• What is a normal distribution?• How does the normal distribution apply tothe real world?Unit 7• What is inference?• How can decisions be based on chance?• To what extent should decisions be basedon chance?• How can we determine the mean of apopulation with a “small” sample?• When are tests of significance andconfidence intervals used?• How can one prepare for errors fromsignificance tests?Unit 8 & 9• How can we determine the mean of apopulation with a “small” sample?• To what extent are significance testsreliable?• How can we determine the proportion of apopulation with a “small” sample?• To what extent are significance testsreliable?Unit 10 & 11• Significance tests can also determine thelikelihood of a sample from a series ofproportions. [C2d]• Significance tests can also determine thewhether two variables are independent. [C2d]• Significance tests can determine the likelihoodof a bivariate sample’s slope. [C2d]Unit 10 & 11• How can we test a series of proportions?• How can we verify that two variables areindependent?• How can we test the slope of acorrelation?Students will know and be able to:Unit 1• Construct dotplots, stemplots, histograms, and cumulative frequency plots.• Interpret dotplots, stemplots, histograms, and cumulative frequency plots.• Describe center, shape, spread, clusters, gaps, outliers and other unusual features• Measure center using mean and median
• Measure spread using range, interquartile range, and standard deviation• Measure position using quartiles, percentiles, and standardized (z) scores• Use boxplots (and modified) with the five number summary• Understand the effect of changing units on summary measures• Do normal calculations• Use dotplots, back-to-back stemplots, and parallel boxplots• Compare center and spread both within a group and between groups• Discuss shape, outliers, center, and spread of distributionsUnit 2• Create and analyze patterns in scatterplots• Understand correlation and linearity• Construct, interpret and use least-squares regression lines• Construct and interpret residual plots• Identify and describe outliers and influential points• Make transformations to achieve linearity (logarithmic and power)• Create and interpret frequency tables and bar charts• Create and interpret marginal and joint frequencies for two-way tables• Create and interpret conditional relative frequencies and determine association• Compare distributions using bar chartsUnit 3Methods of data collection:• Census, Sample survey, Experiment, Observational studyPlanning and conducting surveys• Know the characteristics of a well-designed survey• Understand populations, samples, and random selection• Recognize sources of bias in sampling and surveys (undercoverage, voluntary response, etc.)• Recognize and apply sampling methods (simple random sampling, stratified random sampling,and cluster sampling)Planning and conducting experiments• Know the characteristics of a well-designed and well-conducted experiment• Understand treatments, control groups, experimental units, random assignments, andreplication• Recognize sources of bias (including confounding variables, the placebo effect, and blinding)• Recognize and apply completely randomized designs• Recognize and apply different experimental designs (randomized block design, matched pairsdesign)Generalize results from collected dataUnderstand the types of conclusions that may be drawn from collected dataUnit 4• Create and interpret probability models• Find and interpret long-run relative frequencies• Apply the Law of Large Numbers• Apply the addition and multiplication rules• Understand independence and disjoint• Understand conditional probability• Create and apply simulations to access their probability distributions [C5]• Mean and standard deviation for sums and differences of independent random variables.
Unit 5 & 6• Recognize and apply the binomial distribution• Find the mean and standard deviation of a binomial distribution• Recognize and apply the geometric distribution• Find the geometric mean• Properties of the normal distribution• The normal distribution as a model for measurements• Sampling distribution of a sample proportion• Sampling distribution of a sample mean• Central Limit Theorem• Sampling distribution of a difference between two sample proportions• Sampling distribution of a difference between two sample meansUnit 7• Check assumptions for confidence intervals and significance tests• Find confidence intervals• Conduct significance tests• Type I, Type II errors, and Power• Find the probability of Type I errors• Understand the relationship between the probabilities of Type I and Type II errorsUnit 8 & 9• Check assumptions for confidence intervals and significance tests of means (both 1 sampleand 2 sample)• Find confidence intervals for means (both 1 sample and 2 sample)• Conduct significance tests for means (both 1 sample and 2 sample)• Determine sample size for a desired margin of error• Check assumptions for confidence intervals and significance tests of proportions (both 1sample and 2 sample)• Find confidence intervals for proportions (both 1 sample and 2 sample)• Conduct significance tests for proportions (both 1 sample and 2 sample)• Determine sample size for a desired margin of errorUnit 10 & 11• Check assumptions for both chi-squared goodness of fit and chisquaredtest of independence• Conduct significance tests for both chi-squared goodness of fit and chi-squared test ofindependence• Check assumptions for inference for regression or a linear regression test.• Conduct significance tests for linear regressionsEvidence of AssessmentPerformance Tasks:Unit 1• Using one of the sites below (from the DASL website), students perform an analysis of the distribution ofthe data. Analysis includes graphically displaying the data, evaluating its ‘normalcy’, describing itnumerically, and making claims about the distribution of individual data values. Students then locate anindividual data point, find its standardized value, and determine its percentile ranking. Findings arepresented in a format of their choice. [C2a, C4, C5]• Students complete a variety of released free response items focused on summarizing and comparing
univariate data.There are a total of 13 written performance tasks for students to complete and submit.Unit 2• Choose a problem that interests you involving a dependent variable and an independent variable. Thesample data for this problem must consist of at least 20 data points and must come from your ownresearch or from an official, reputable site on the World Wide Web. Using technology (TI-Interactive orother application), construct a scatterplot and then perform a correlation & regression analysis on thisdata set. Write a report on the data and its analysis which includes a complete reference for the source ofyour data, the computer analysis of your data (must consist of a scatterplot, correlation analysis andregression analysis) and one or two well-written paragraphs summarizing your interpretation of theseresults. Be sure to address both sides of the story statistically. [C2a, C5]• Students complete a variety of released free response items focused on linear and non-linearregression.There are a total of 10 written performance tasks students will complete and submit.Unit 3• Students find and statistically analyze an article in a newspaper, magazine, or other current publication.Students consider: [C2b, C4, C3]o Is this an observational study or an experiment?o What was the sampling design or experimental design?o What are the possible biases in the study?o How was randomization utilized?o To what extent are the conclusions in the article justified and able to be generalized?• Students complete a variety of released free response items focused on sampling methods, simulations,and experimental design.There are a total of 10 written performance tasks students will complete and submit.Unit 4• Students design and play a game of chance (using dice or cards) to illustrate their understanding of therules of probability, expected value, the law of large numbers, and the nature of random variables.Students first use simulation [C5] to 'test' the variance of their game and follow up by actually playing thegame with classmates and subsequently write a summary of their results. Results help students toconceptualize the notions of sampling variability and set the stage for the study of sampling distributions.[C2c]• Students complete a variety of released free response items focused on probability and expected value.There are a total of 7 written performance tasks students will complete and submit.Unit 5 & 6• Students visit the Rice Virtual Lab to explore the Central Limit Theorem and sampling distributions.Students construct their understanding of how sample size and the shape of the populationdistribution affect the sampling distribution of the mean (and other statistics). [C2c, C5]• Students complete a variety of released free response items focused on binomial, geometric, andsampling distributions.In unit 5 there are a total of 7 written performance tasks students will complete and submit.In unit 6 there are a total of 9 written performance tasks students will complete and submit.Unit 7• Class activity to determine which students had ESP (extra sensory perception). Students work in pairssetting up an experiment to determine if their partner has ESP. Data is then analyzed throughconducting a significance test as well as a discussion of significance level and probability of Type I andType II errors. [C2d, C4]There are a total of 9 written performance tasks students will complete and submit.Unit 8 & 9• Parking lot proportions: Students venture out to the school parking lot and collect data about thevehicles in the staff lot as wells as the student lot. Data such as car color, make, country of origin, andtype of car. Students then construct confidence intervals and run significance tests to determine if andwhat differences there are between the students' cars and staffs' cars. [C2d, C4]• Students complete a variety of released free response items focused on inference for means andproportions.In unit 8 there are a total of 7 written performance tasks students will complete and submit.
In unit 9 there are a total of 6 written performance tasks students will complete and submit.Unit 10 & 11• Have you ever wondered why the package of M&Ms you just bought never seems to have enough ofyour favorite color? Or, why is it that you always seem to get the package of mostly brown M&Ms? What’sgoing on at the Mars Company? Is the number of the different colors of M&Ms in a package reallydifferent from one package to the next, or does the Mars Company do something to insure that eachpackage gets the correct number of each color of M&M? Students run a complete significance test both ingroups and as an entire class to justify their results. [C2d, C3, C4]• Students complete a variety of released free response items focused on inference for independence,goodness of fit, and regression.In unit 10 there are a total of 4 written performance tasks students will complete and submit.In unit 11 there are a total of 2 written performance tasks students will complete and submit.Other Evidence (self-assessments, observations, work samples, quizzes, tests and so on):Unit 1—Students complete three unit quizzes and a comprehensive unit test.Unit 2—Students complete four unit quizzes and a comprehensive unit test.Unit 3—Students complete two unit quizzes and a comprehensive unit test.Unit 4—Students complete two unit quizzes and a comprehensive unit test.Unit 5—Students complete two unit quizzes and a comprehensive unit test.Unit 6—Students complete two unit quizzes and a comprehensive unit test.Unit 7—Students complete three unit quizzes and a comprehensive unit test.Unit 8—Students complete one unit quiz and a comprehensive unit test.Unit 9—Students complete one unit quiz and a comprehensive unit test.Unit 10—Students complete one unit quiz and a comprehensive unit test.Unit 11—Students complete one unit quiz.Types of Learning ActivitiesIndicate from the table below all applicable learning strategies that may be used in the course.Direct Instruction____StructuredOverview__x__Minipresentation__x__Drill & Practice__x__Demonstrations____Other (List)Learning Activities:IndirectInstruction__x__Problembased__x_CaseStudies__x__Inquiry____ReflectivePractice____Project____Paper____ConceptMapping____Other (List)ExperientialLearning____ Virt. Field Trip__x__Experiments__x__Simulations____Games____Field Observ.___Role-playing____Model Bldg.__x__Surveys____Other (List)IndependentStudy____Essays__x_Self-pacedcomputer____Journals____Learning Logs____Reports____DirectedStudy____ResearchProjects____Other (List)Interactive Instructio__x__Discussion____Debates___Role Playing____Panels____Peer Partner Learnin____Project team____Laboratory Groups____Think, Pair, Share____Cooperative Learnin__x__Tutorial Groups____Interviewing____Conferencing____Other (List)Unit 1 – Exploring Univariate Data (3.5 Weeks)Unit 1• Using one of the sites below (from the DASL website), students perform an analysis of the distribution ofthe data. Analysis includes graphically displaying the data, evaluating its ‘normalcy’, describing itnumerically, and making claims about the distribution of individual data values. Students then locate anindividual data point, find its standardized value, and determine its percentile ranking. Findings arepresented in a format of their choice. [C2a, C4, C5]• Students complete a variety of released free response items focused on summarizing and comparingunivariate data.Unit 2 – Exploring Bivariate and Categorical Data (4 Weeks)
Unit 2• Choose a problem that interests you involving a dependent variable and an independent variable. Thesample data for this problem must consist of at least 20 data points and must come from your ownresearch or from an official, reputable site on the World Wide Web. Using technology (TI-Interactive orother application), construct a scatterplot and then perform a correlation & regression analysis on thisdata set. Write a report on the data and its analysis which includes a complete reference for the source ofyour data, the computer analysis of your data (must consist of a scatterplot, correlation analysis andregression analysis) and one or two well-written paragraphs summarizing your interpretation of theseresults. Be sure to address both sides of the story statistically. [C2a, C5]• Students complete a variety of released free response items focused on linear and non-linearregression.Unit 3 – Planning and Conducting Studies and Experiments (3 Weeks)Unit 3• Students find and statistically analyze an article in a newspaper, magazine, or other current publication.Students consider: [C2b, C4, C3]o Is this an observational study or an experiment?o What was the sampling design or experimental design?o What are the possible biases in the study?o How was randomization utilized?o To what extent are the conclusions in the article justified and able to be generalized?• Students complete a variety of released free response items focused on sampling methods, simulations,and experimental design.Unit 4 – Probability and Random Variables (3.5 Weeks)Unit 4• Students design and play a game of chance (using dice or cards) to illustrate their understanding of therules of probability, expected value, the law of large numbers, and the nature of random variables.Students first use simulation [C5] to 'test' the variance of their game and follow up by actually playing thegame with classmates and subsequently write a summary of their results. Results help students toconceptualize the notions of sampling variability and set the stage for the study of sampling distributions.[C2c]• Students complete a variety of released free response items focused on probability and expected value.Units 5 & 6 – Binomial, Geometric, and Sampling Distributions (3.5 Weeks)Unit 5 & 6• Students visit the Rice Virtual Lab to explore the Central Limit Theorem and sampling distributions.Students construct their understanding of how sample size and the shape of the populationdistribution affect the sampling distribution of the mean (and other statistics). [C2c, C5]• Students complete a variety of released free response items focused on binomial, geometric, andsampling distributions.Unit 7 – Introduction to Inference (3.5 Weeks)Unit 7• Class activity to determine which students had ESP (extra sensory perception). Students work in pairssetting up an experiment to determine if their partner has ESP. Data is then analyzed throughconducting a significance test as well as a discussion of significance level and probability of Type I andType II errors. [C2d, C4]Units 8 & 9 – Inference for Means and Proportions (3.5 Weeks)Unit 8 & 9• Parking lot proportions: Students venture out to the school parking lot and collect data about thevehicles in the staff lot as wells as the student lot. Data such as car color, make, country of origin, andtype of car. Students then construct confidence intervals and run significance tests to determine if andwhat differences there are between the students' cars and staffs' cars. [C2d, C4]• Students complete a variety of released free response items focused on inference for means andproportions.Units 10 & 11 – Inference for Goodness of Fit, Independence, Homogeneity, and Regression(4 Weeks)Unit 10 & 11• Have you ever wondered why the package of M&Ms you just bought never seems to have enough of
your favorite color? Or, why is it that you always seem to get the package of mostly brown M&Ms? What’sgoing on at the Mars Company? Is the number of the different colors of M&Ms in a package reallydifferent from one package to the next, or does the Mars Company do something to insure that eachpackage gets the correct number of each color of M&M? Students run a complete significance test both ingroups and as an entire class to justify their results. [C2d, C3, C4]• Students complete a variety of released free response items focused on inference for independence,goodness of fit, and regression.Learning ActivitiesOverarching Enduring Understandings for the course• Mathematics is a useful language for symbolically modeling and thus simplifying and analyzing ourworld.• Mathematics is a logical and objective means of analyzing and solving problems.• The effective communication of mathematics is essential to its application. [C4]Topical Enduring Understandings for the course• Students will understand that statistical information is a powerful, pervasive force in our world.• Exploratory analysis of data makes use of graphical and numerical techniques to study patterns anddepartures from patterns. [C2a]• Data must be collected according to a well-developed plan if valid information is to be obtained. [C2b]• Probability is the tool used for anticipating what the distribution of data should look like under a givenmodel. [C2c]• Statistical inference guides the selection of appropriate models. [C2d]• Students will understand that statistics can be used to make valuable, reliable inferences from empiricalinformation. [C2d]• The appropriate communication and interpretation of statistics is essential to avoiding statistical abuseand/or misunderstanding. [C4]• Analysis of data is made possible through the use of calculator and computer technology. [C5]Adapted from Understanding by Design Template available online and the Understanding by Design: Professional Development Workbook.References:Wiggins, G., & McTighe, J. (n.d.). Understanding by Design Exchange. Retrieved November 2, 2004 from http://www.ubdexchange.org/Wiggins, G., & McTighe, J. (2004). Understanding by design: Professional development workbook. Alexandria, VA: Association for Supervision andCurriculum Development.)