THE KENYAN DAIRY SUB-SECTOR A Rapid Appraisal
THE KENYAN DAIRY SUB-SECTOR A Rapid Appraisal
THE KENYAN DAIRY SUB-SECTOR A Rapid Appraisal

Create successful ePaper yourself
Turn your PDF publications into a flip-book with our unique Google optimized e-Paper software.
<strong>THE</strong> <strong>KENYAN</strong> <strong>DAIRY</strong> <strong>SUB</strong>-<strong>SECTOR</strong>A <strong>Rapid</strong> <strong>Appraisal</strong>A. Omore, H. Muriuki, M. Kenyanjui, M. Owango and S. StaalMOA/KARI/ILRISmallholder Dairy (Research & Development) Project ReportFunded byBritish Department for International Development (DFID)January, 1999
This publication includes preliminary results of market-oriented smallholder dairy researchconducted by the collaborative MoA/KARI/ILRI Smallholder Dairy (R&D) Project in Kenya. Theresults are published informally to enable early dissemination of research outputs. It has not beenprepared in accordance with the formal publication procedure of any of the collaboratinginstitutions. Comments are welcome.
Table of ContentsLIST OF TABLES........................................................................................................iiLIST OF FIGURES......................................................................................................iiACRONYMS AND ABBREVIATIONS ........................................................................iiiEXECUTIVE SUMMARY............................................................................................ 11. INTRODUCTION.................................................................................................... 52. HISTORICAL AND DEMOGRAPHIC OVERVIEW................................................. 63. <strong>DAIRY</strong> MARKETING AND CONSUMPTION........................................................ 123.1 PROJECTIONS OF DEMAND AND SUPPLY OF <strong>DAIRY</strong> PRODUCTS....................... 123.2 PRESENT MILK MARKETING CHANNELS................................................................ 153.3 NON-PROCESSED MILK MARKETING CHANNELS ................................................. 163.4 PROCESSED MILK MARKETING CHANNELS .......................................................... 203.5 MILK CONSUMPTION AND PREFERENCE PATTERNS........................................... 223.6 PUBLIC HEALTH CONCERNS OVER INFORMAL MILK MARKETING ..................... 233.7 MAIN ISSUES IN CONSUMPTION AND MARKETING............................................... 244. <strong>DAIRY</strong> PRODUCTION SYSTEMS ...................................................................... 254.1 MILK SHEDS ............................................................................................................... 254.2 CLASSIFICATION OF PRODUCTION SYSTEMS ...................................................... 264.3 BREEDING MANAGEMENT ....................................................................................... 314.4 FEEDING MANAGEMENT .......................................................................................... 324.5 ANIMAL HEALTH MANAGEMENT.............................................................................. 334.6 MAIN ISSUES IN PRODUCTION SYSTEMS .............................................................. 355. POLICY AND INSTITUTIONAL ISSUES............................................................. 365.1 REGULATORY ENVIRONMENT ................................................................................ 365.2 FARMER ORGANISATIONS....................................................................................... 385.3 LIVESTOCK SUPPORT SERVICES ........................................................................... 405.4 ACCESS ROADS AND WATER SUPPLY ................................................................... 435.5 DONOR PARTICIPATION IN <strong>THE</strong> <strong>DAIRY</strong> <strong>SUB</strong>-<strong>SECTOR</strong> .......................................... 445.6 INSTITUTIONAL LINKAGES....................................................................................... 445.7 MAIN ISSUES IN POLICY AND INSTITUTIONS. ........................................................ 456. REFERENCES..................................................................................................... 46APPENDIX 1: RESEARCH TEAMS AND TERMS OF REFERENCE...................... 49APPENDIX 2: AGRO-CLIMATIC ZONES ................................................................ 51i
List of TablesTABLE 1. RUMINANT LIVESTOCK POPULATIONS AND ANNUAL MILKPRODUCTION IN KENYA .................................................................................... 8TABLE 2. PROJECTED <strong>DAIRY</strong> SUPPLY WITHOUT AND WITH INTERVENTION TOIMPROVE <strong>DAIRY</strong> HERD PRODUCTIVITY......................................................... 13TABLE 3. PROJECTED <strong>DAIRY</strong> DEMAND .......................................................................... 14TABLE 4. MILK PRICES AND MARGINS FOR SMALL MILK TRADERS........................... 19TABLE 5. MILK PRICES AND MARGINS FOR SOME PRIVATE MILKPROCESSORS AND CO-OPERATIVES............................................................ 20TABLE 6. LIVESTOCK NUMBERS AND MILK OFFTAKE BY SPECIES ANDREGIONS............................................................................................................ 25TABLE 7. <strong>DAIRY</strong> AND INDIGENOUS CATTLE PRODUCTION SYSTEMS IN KENYA ..... 28TABLE 8. PRODUCTION PARAMETERS ACROSS SELECTED CATTLEPRODUCTION SYSTEMS .................................................................................. 30TABLE 9. AREA OF NATURAL AND PLANTED FODDERS IN SOME DISTRICTS. ......... 32TABLE 10.IMPACT OF EAST COAST FEVER ON SMALLHOLDER <strong>DAIRY</strong>PRODUCTION IN KENYA .................................................................................. 34List of FiguresFIGURE 1. <strong>DAIRY</strong> HERD DENSITY....................................................................................... 9FIGURE 2. TREND IN MILK PRODUCTION: 1981-1997..................................................... 10FIGURE 3. PROJECTIONS IN <strong>DAIRY</strong> DEMAND AND SUPPLY......................................... 15FIGURE 4. MILK MARKETING CHANNELS FROM SMALLHOLDER <strong>DAIRY</strong> CATTLEPRODUCTION................................................................................................... 16FIGURE 5. PRODUCER AND RETAIL PRICES FOR FRESH RAW MILK......................... 17ii
ACZADCAIapprox.CAISCoop.DANIDADFIDECFEUFAOFMDFWMGDPGMGNPGTZha.HITCBPPHPIIFADILRIJICAKARIKCCKDBkgkmLMEMALAMALDMALDMMLDMoAMTMt.NAFCONEPNGORRPODARAAcronyms and AbbreviationsAgro-Climatic ZoneAgricultural Development CorporationArtificial InseminationApproximatelyCentral Artificial Insemination StationCo-operativeDanish International Development AgencyDepartment for International Development, United KingdomEast Coast feverEuropean UnionFood and Agriculture OrganisationFoot and Mouth DiseaseFresh Whole MilkGross Domestic ProductionGross MarginGross National ProductGerman Technical Co-operationhectareHeifer-In-TrustContagious Bovine Pleuro-PneumoniaHeifer Project InternationalInternational Fund for Agricultural DevelopmentInternational Livestock Research InstituteJapanese International Co-operation AgencyKenya Agricultural Research InstituteKenya Co-operative CreameriesKenya Dairy BoardKilogramKilometreLiquid milk equivalent(“maziwa lala or mgando”) Soured MilkMinistry of Agriculture and Livestock DevelopmentMinistry of Agriculture Livestock Development and MarketingMinistry of Livestock DevelopmentMinistry of AgricultureMetric TonnesMountNational Agricultural and Food CorporationNational Extension ProjectNon Governmental OrganisationRegional Research ProgrammesOverseas Development Administration<strong>Rapid</strong> <strong>Appraisal</strong>iiiComment:
SDPSIDASMPSNVTBDKNAISLDPNDDPTORKSh.EAZUHTUS$Smallholder Dairy (Research & Development) ProjectSwedish International Development AgencySkimmed milk powderNetherlands Volunteer ServicesTick Borne DiseasesKenya National Artificial Insemination Services.Livestock Development ProjectNational Dairy Development ProjectTerms of ReferenceKenya ShillingEast African ZebuUltra Heat Treated milkUnited States Dollariv
Executive SummaryThe <strong>Rapid</strong> <strong>Appraisal</strong> (RA) report presents the results of a study of Kenya’s dairy systemscarried out by the MoA/KARI/ILRI Smallholder Dairy Project (SDP). Interdisciplinary teamsfrom SDP examined Dairy Production Systems, carried out Economic and StructuralAnalysis of dairying, and addressed Policy and Institutional Issues related to dairydevelopment in Kenya. The methodology used in the appraisal is a refinement of that usedby ILRI and its national collaborators in Uganda and Tanzania. The RA is an indicativeanalysis of the dairy systems within the following milk sheds and consumption centres: LakeBasin; Central and South Rift Valley; Central Province; Eastern Province; Greater Nairobi;and, Coast Province.A brief history of the dairy industry in Kenya is presented that may partly explain itsuniqueness in the East African region. The report highlights the increasing opportunities whichsmallholder dairying represents for income generation and agricultural development, includingthe opportunities for increasing production and marketed output; the important interactionbetween access to the market and levels of milk sales and prices; the lack of accurateestimates of demand patterns; the importance of informal milk marketing and concerns overassociated public health hazards; the lack of accurate livestock census reports to allowaccurate impact assessments; and, the potential for large increases in the productivity andprofitability of dairying stimulated by the liberalisation of milk processing, marketing and inputservices.Milk Marketing and ConsumptionBased on MoA cattle population statistics and research reports, it is estimated thatapproximately 3,078 m. litres of milk are produced annually 1 , 81% of which originates fromapprox. 3 m. dairy cattle 2 (2.5 m. of which are in smallholdings), and the rest from theindigenous herd. Almost all marketed milk comes from the dairy herd and a high proportion(about 70%) originates from the smallholder dairy herd. From the annual smallholder dairyherd production of 1,720 m. litres, about 626 m. litres (36%) are consumed on-farm (456 m.litres consumed by household and 170 m. litres offered to calves), and 1,092 m. litres (64%)1 This estimate is about 20% higher than MoA (1997) estimates and is based on reviews by Peelerand Omore (1997) and recent findings from SDP characterisation surveys (see discussion underdemographic over-view in Section 2)2 Dairy cattle refers to specialised dairy Bos taurus cattle and their crosses with Bos indicus (EAZ)breeds1
are offered as marketed surplus. This marketed surplus is sold through: (i) direct sales toconsumers, either individual or institutional, which account for 600 m. litres (55% of marketedmilk); (ii) co-operatives, self-help groups and traders, who market milk in local and urbanmarkets, handle some 414 m. litres (38%), out of which 44 m. litres is sold to KCC; and (iii)sales to the private processors, either directly or through coops, totalling about 164 m. litres.Important market outlets for large scale producers are the few large private dairy processingplants and Kenya Co-operative Creameries. Marketing infrastructure is most advanced inCentral Province, especially in Kiambu District, where dairy co-operatives play a major role,while direct sales from producers to consumers are common in Coast, Southern Rift Valleyand Western Kenya. Sales of processed milk by KCC and private dairies comprise only 19%of marketed milk, most of which is sold in Nairobi.Following liberalisation of milk marketing in 1992, an increasing number of private sectorparticipants are getting involved in transporting, processing and distribution of milk, most ofwhich is sold raw, reflecting consumer preference for lower price and high butter-fat. Hawkingplays an important role, particularly by increasing consumer convenience and providingemployment. Milk traders operate mostly in high population density peri-urban areas,particularly in Kiambu and Murang’a districts, where the competition they provide threatens thesurvival of some dairy co-operatives. Estimates of marketing margins indicate strong returnsfor most informal market agents, especially small milk traders whose returns range from 8 -20% depending on the region. Farm gate prices for raw milk are lowest in milk surplus areassuch as Nyandarua and Murang’a districts and highest at the coast, where milk deficits areacute. The prices range from KSh 11/litre (approx. US$ 0.18) in Nyandarua to KSh. 35/litre(approx. US$ 0.6) in Mombasa, reflecting extremes in milk surplus and deficit areas. Thoughsufficient information to assess general consumption and preference patterns is lacking,indications are that most consumers prefer and consume (boiled) raw milk, especially in tea.Dairy Production SystemsDemographic statistics show the importance of the smallholder dairy cattle herd; it comprises20% of the cattle population and produces an estimated 56% of the milk from cattle. About60% (approx. 1,900 MT) of the milk produced in Kenya comes from less than 10% of thecountry's landmass in the fertile central districts of the Rift-Valley and Central Provinceswhere 80% of exotic and cross-bred dairy cattle, mostly kept by smallholders, are found.Other areas with significant dairy production include Western Province, Embu, Kisii andMeru Districts. Extensive cattle production with the Small East African Zebu (EAZ), isconcentrated in agro-pastoral systems in the Rift-Valley, Eastern and North-Eastern, and insedentary systems in Coast and Nyanza Provinces. Western and Eastern Provinces also2
contribute a small proportion of their milk offtake to local rural markets, including throughdirect sales to neighbours.The major cattle production systems are, broadly, comprised of two large scale and two smallscale systems. The large scale systems are: (i) intensive and semi-intensive dairyproduction with Bos taurus cattle that is entirely market-oriented. This system is estimated tohave 500,000 cattle found mostly in private dairy farms in central Rift Valley; and, (ii) extensivedairy-meat or pastoralism with Bos indicus (EAZ) cattle. This system has about 4.5 m. cattlemostly concentrated in the north and central Rift Valley, Eastern and Coast Provinces. Thesmall scale systems are: (i) intensive rural dairy-manure production with Bos taurus andcrossbred dairy cattle that is mostly market-oriented. This system has the majority of dairycattle (approx. 2.5 m.) and the highest concentration is found in the Central and Rift ValleyProvinces; and, (ii) semi-intensive dairy-meat-draught-manure production with Bos indicusand few crossbred dairy cattle that is mostly subsistence oriented. This system has about5.3 m. cattle mainly in Nyanza, Western, Coast, Eastern and Rift Valley Provinces. It wasconcluded that the potential for increased marketed milk production is through increasingindividual animal productivity in the small scale intensive rural dairy-manure productionsystem.Institutional and Policy IssuesThe lack of infrastructure, especially roads, water supply, input services and access to marketswere cited by producers, market agents and extension staff as the most important constraintsin many areas. The liberalisation of milk marketing in 1992 was accompanied by policychanges that led to considerable change in institutional aspects of the dairy sub-sector,including increased private sector participation and government divestiture. Increasedprivate sector participation has, as yet, not filled the gaps in the provision of support servicesand the supply of inputs, including breeding, veterinary clinical and credit services. Thoughfarmers’ organisations, including co-operatives, are already beginning to respond to theseneeds, many areas outside Central Province do not have these organisations. An increasein public investment in maintenance of roads would increase milk offtake in dairy producingareas. Innovative ways to encourage community participation in working out modalities forsolving widespread problems (e.g., lack of maintenance of access roads) are needed tosupplement any government efforts.Primary ConstraintsThe primary constraints under milk marketing and consumption include: (i) poorlyunderstood structure and performance of the informal private sector; (ii) lack of reliable3
information on demand patterns, including product differentiation and changes in dairyconsumption habits with urbanisation; (iii) limited market information on input (e.g., feed) andoutput markets; and, (iv) concerns over public health hazards of marketed raw milk,associated with increased informal milk marketing, particularly brucellosis, zoonotictuberculosis and low standards of milk hygiene. An understanding of these factors can enablethe design and promotion of more efficient market mechanisms, and the formulation ofinformed policies.The primary constraints to increasing productivity in intensive and semi-intensivesmallholder dairy production systems include: (i) under-nutrition and seasonal fluctuationsin quantity and quality of feed resources and the low rate of adoption of available technologiesto address them; (ii) the important disease challenge in extensive areas, especially TBDs andtrypanosomosis; (iii) unreliable access to inputs, particularly credit, breeding and veterinaryservices, especially in areas with poor marketing infrastructure. Underlying all theseconstraints is the lack of accurate data, including livestock census data, to enable the accurateex-ante impact assessments of potential interventions in specific production systems.Primary constraints under policy and institutional aspects are: (i) poor infrastructureparticularly roads, to allow improved access to output markets; (ii) poor rural water supply;(iii) mismanagement in farmers’ organisations due to low level of farmer control; (iv) slowchanges in the policy environment and the enactment of regulations to back up policychanges; and, (v) poor linkages between input and output markets by farmers’ organisations.4
1. IntroductionDairy farming in Kenya is dominated by smallholders who are estimated to contributeapprox. 56% and 70% of total and marketed milk production, respectively (Peeler andOmore, 1997). These are farmers who, besides growing crops for subsistence and for sale,mostly keep 2 to 3 cows with their followers on land sizes typically of about 1 ha. in theintensively farmed areas and about 2.5 ha. in the extensively farmed areas (Staal et al.,1998; MoA/KARI/ILRI, 1998). The estimated total population of 2.5 million of dairy cattle inapprox. 625,000 smallholdings (MoA, 1996; Peeler and Omore, 1997) suggests that thissub-sector employs many Kenyans who derive a regular source of cash income andbalanced nutrition.Although smallholder dairy production accounts for most of the total milk production inKenya, individual cow productivity is low (Omore et al., 1996a; Staal et al, 1998), but thepotential for increased productivity per animal is considered to be high. Since most Kenyanslive in smallholdings and are resource-poor with 47% of rural households living below thepoverty line (CBS, 1998), there is consensus that research and development efforts withinthe agricultural sector are best targeted to the smallholder dairy sector. This is mainlybecause dairying represents a promising avenue for improving the welfare of resource-poorrural communities. Other reasons cited in favour of focusing research and developmentefforts on smallholder dairies include: the potential for increasing demand for milk due togrowing urbanisation and potentially higher incomes against projected shortfalls in supply;the high income elasticity of demand for milk; the predominance of smallholdings in the mostsuitable dairy production zones; the central role that livestock play in nutrient cycling inmixed farms; and, increased income generation opportunities.The opportunities for increased productivity and improved welfare continue to be enhancedthrough increasing private sector participation and reduced government involvement in bothmilk marketing and livestock services in producing areas. There is increasing private sectoractivity through various actors, including small traders, private dairy processors and farmergroups, each innovating mechanisms for collecting and retailing milk and for providing inputsand animal reproduction and health services. The changes have also shifted the patterns ofincentives in the dairy sub-sector. This <strong>Rapid</strong> <strong>Appraisal</strong> (RA) provides stakeholders in thesub-sector with an overview of the current situation and insights into the main issues thatrequire urgent attention to further enhance the benefits of smallholder dairying. Successfulalleviation of those constraints which may currently impair the performance of the dairy sub-5
sector and further development, can enhance those benefits in addition to matching projecteddemand through increased productivity. The central emphasis of this appraisal was to identifythose constraints, whether technical, economic, or institutional in nature.The appraisal is an output under the DFID sponsored MoA/KARI/ILRI Smallholder DairyProject (SDP) whose purpose is to identify required actions for the creation of a supportiveoperational environment for market-oriented smallholder dairying. This study, which has beenconducted using, as a guideline, ILRI's Conceptual Framework for Dairy Research (Rey et al.,1993), has highlighted the potential that smallholder dairying represents for income generationand agricultural development within the context of current activities. These include: theimportant interaction between access to the market, agro-ecology (and hence productionpotential), levels of milk sales and prices; the lack of accurate estimates of demand patterns;the importance of informal milk marketing and concerns over associated public health hazards;and, the potential for large increases in the technical efficiency, expansion and profitability ofdairy production stimulated by the liberalisation of milk processing, marketing and of inputservices.This report is a summary of individual team reports. The report provides a brief historicaland demographic overview and presents the analysis under three themes namely: marketingand consumption aspects; dairy production systems; and, policy and institutional issues.The main issues under each of these themes are summarised at the end of each section.2. Historical and Demographic OverviewMajor Events in the History and Development of the Dairy Industry in KenyaMarket-oriented dairy farming with exotic cattle in Kenya started almost a century ago whenEuropean settlers introduced dairy cattle breeds from their native countries. Most of thesesettlers occupied the most agriculturally productive highland areas in central parts of RiftValley and Central Provinces. Cross-bred cattle dairy production by Africans started after1954 when a colonial policy paper, the Swynnerton Plan of 1954, allowed them to engage incommercial agriculture. By 1963, when Kenya attained independence, the dairy herd hadexpanded to about 400,000 exotic cattle and their crosses with the local East African zebu.To support the expanding and export oriented dairy production by European settlers, keylivestock support and marketing services were initiated. The Veterinary ResearchLaboratories in Kabete and the Animal Husbandry Research Station in Naivasha were6
started in 1903 to assist in controlling livestock diseases and provide animal husbandryresearch services, respectively. The Kenya Co-operative Creameries (KCC) was founded in1925 to process and market dairy products (mainly butter and cheese) locally and abroad.The need to control reproductive diseases and improve genotype quality of dairy stock led tothe establishment of the Central Artificial Insemination Station (CAIS) in 1946 in Kabete. In1958 the Kenya Dairy Board (KDB) was established through an Act of Parliament to regulatedairy marketing.After independence in 1963, many foreign settlers who opted to leave the country sold theirfarms to Africans or to the government. Many of these farms were rapidly sold to Africansmallholders resulting in a decline of dairy cattle population in large-scale farms from400,000 to 250,000 heads by 1965 and a rapidly expanding smallholder herd. To encouragedairy production, the government effected a number of changes in the provision of livestockproduction and marketing services. By 1966, free or cheap and efficient livestock serviceswere introduced including clinical and daily runs to provide artificial insemination services. In1971, the government abolished the contract and quota system of dairy marketing to KCC.The system had effectively excluded most smallholder producers from selling milk to KCC.The relatively efficient provision of livestock services continued until the early 1980's whenthe efficient delivery of the services became impossible due to government budgetaryconstraints. The serious decline in their provision prompted the government to seriouslythink about restructuring the industry with a view to increasing the role of the private sector.These changes are contained in various policy documents including: the National LivestockDevelopment Policy (1980); National Food Policy (No. 4 of 1981 and No. 2 of 1994);Sessional Papers (1986; 1994) on renewed economic growth and recovery; and, policyframework papers on economic reforms published between 1996 and 1998.For the dairy sub-sector, the major policy change was the liberalisation of milk marketing in1992 (Dairy Development Policy, 1993), which followed recommendations contained in theDairy Master Plan (1991). This policy change effectively ended KCC's monopoly in milkmarketing in urban areas. Its major impact has been a rapid growth of the formal andinformal private sector which provides input and output services, and a redistribution andincrease of the overall social and economic benefits of market-oriented dairying tosmallholder producers, market agents and consumers in Kenya. Changes in the legalframework to support the stated policy revisions have however lagged behind the policystatements.7
Demographic OverviewKenya has a total area of 581,787 km 2 . Of this, only approx. 20% is suitable for arableagriculture and supports over 70% of the population. Population density in many parts of thearable land is estimated at about 500 persons per km 2 . The current (1998) population isestimated at 29 million given the estimated population of 21 million in 1989 and an annualgrowth rate of 3.3% (CBS, 1994). The population of Nairobi, the biggest outlet for marketedmilk, is currently (1998) estimated at 2,000,000 persons comprising approx. 41% ofurbanised Kenyans (CBS, 1995) 3 . Per capita GNP has been declining gradually since 1980when it peaked at over US$300, to only US$260 presently.Table 1. Ruminant livestock a populations and annual milk production in KenyaProvinceIndigenouscattleDairy cattleSmallRuminantsMilkProd.Milk perCapitaMilk perKm 2Pop % Pop % Pop. % ('000 MT) MT(‘000) (‘000) (‘000)Central 78
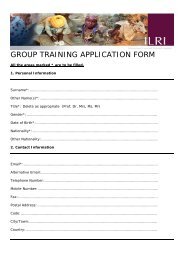
and in northern and southern parts of the Rift Valley Province (Table 1 Figure 1). About 2.5million of the 3 million dairy cattle (83% of the dairy herd) are estimated to be insmallholdings.N o . p e r S q . K m.00.1 -2.12.2 -10.810.9 -34.034.1 -56.256.3 - 131.1NairobiFigure 1. Dairy herd densityTotal milk production is estimated at 3 million MT from both the local and the dairy herd,equivalent to KSh 43 billion (US$ 717 million) 4 in 1997, which constitutes approximately50% of total value all livestock products (Peeler and Omore, 1997). Though accounting for4 1US$ was equivalent to approx. KShs. 60 in 19989
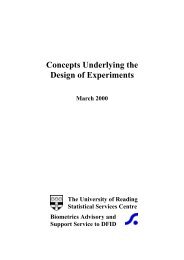
only 23% of the cattle population, the dairy herd contributes approx. 80% of the totalproduction (2.5 million MT). More detailed district-level analysis of milk production, based onthe MoA livestock population figures and research reports on production, have been recentlypublished by Peeler and Omore, (1997).Trends in milk production published by MoA from 1981 to 1997 are presented in Figure 2.The Figure suggests that MoA milk production estimates have stagnated at about 2.5 millionMT since 1989. This seems unlikely since the observed production parameters suggest apositive herd growth rate for all cattle production systems, especially the dairy herd (Peelerand Omore, 1997). A likely underlying reason for the apparent stagnation in dairy productionaccording to MoA is the lack of census reports on which to base cattle population and growthrate, hence more or less the same estimates of cattle population figures have been usedover the period.300025002000MilkProduction1500(Million Litres)1000500081 82 82 84 85 86 87 88 89 90 91 92 93 94 95 96 97YearFigure 2. Trend in milk production: 1981-1997Source: Ministry of Agriculture Annual Reports.The milk production estimates by Peeler and Omore (1997) are about 20% higher than thoseby MoA which estimated total annual milk production at 2.5 million MT in 1997 (MoA, 1997)(Figure 1). The major difference is in the estimation of annual production per dairy cow. TheMoA estimates milk production at 1,300kg/cow/yr for lactating cows across all dairyproduction systems, while Peeler and Omore (1997), after reviewing various researchreports, estimated higher production of 1750kg/cow/yr and 4000kg/cow/yr for lactating cows10
in small- and large-scale dairy production systems, respectively. Milk production estimatesfor dairy cattle recorded during recent SDP characterisation surveys were 7.2kg/cow/dayand 5.0kg/cow/day in Kiambu and the rest of the Nairobi milk shed 5 , respectively. Thesefigures correspond to annual production indices of 2628kg/cow/yr for Kiambu and 1825kg/cow/yr for the rest of the Nairobi milk shed (actual milk yields per cow per year would belower depending on the number of days cows are dried off). These figures are similar tothose from reports on smallholder dairy production previously reviewed by Peeler andOmore (1997) but significantly higher than MoA production estimates. The total cattle milkproduction estimate by Peeler and Omore (1997) give an annual per capita milk availabilityestimate of approx. 106kg, compared to 90kg and 80kg estimated from the MoA productionfigures and FAO (1996), respectively.5 The seven districts in the Nairobi milk shed selected for the SDP characterisation surveys were:Kirinyaga, Machakos, Nakuru, Narok, Nyandarua, Murang’a and Nairobi.11
3. Dairy Marketing and ConsumptionThis section describes the major findings of the RA regarding recent changes and the currentmajor features of milk marketing in Kenya, particularly milk marketing channels, the actorsinvolved and the amounts of milk passing through them. The role of the emerging milkchannels is discussed.3.1 Projections of Demand and Supply of Dairy ProductsAccurate projections in demand and supply of dairy products to determine the productiongaps are difficult to make in the absence of reliable data on their key determinants such ascattle population (including its growth rate), and income elasticity of demand for milkproducts. A previous demand projection contained in the Dairy Master Plan (1991) onlyconsidered formally and informally traded milk. Notwithstanding the lack of accurate data,some projections of supply and demand have been made, based on rough estimates of thedeterminants of supply and demand for traded and non-traded milk.The demand for milk, like other consumer goods, is a function of population size, incomelevels and the elasticity of demand for milk, retail price, and to a lesser extent, taste andpreference over other products. The supply of milk is mainly influenced by producer prices,access to support services, the size of the national dairy herd and estimated milk yields.The demand and supply of milk can be forecasted based on assumptions about trends inthese variables, and the expected rise in dairy demand over time. Indicative estimates ofsupply and demand based on assumptions about growth rates of population and incomesuntil 2010 show a continuing widening of the gap between demand and supply. Most of thedemand for marketed milk is in urban areas where approx. 15% of the population currently lives(CBS, 1989; 1995) 6 and where average incomes and population growth rate are higher than inthe rural areas. Two scenarios in supply and three scenarios in demand have beencompared.Projections in SupplyThe first scenario for projection in supply assumes the current annual milk production growthrate of 4.3% (1.1% for the traditional herd and 5% for the dairy herd 7 ), and the second6 The Word Bank (1989) gives a higher proportion of urban population of 32%7 The Kenyan dairy herd grew at over 10% annually from an estimated 400,000 heads in 1963 to atleast 2.5 million in the late eighties. The growth rate is considered to have dropped remarkably sincethe collapse of government supported AI services in the early 1980’s.12
scenario assumes an annual production increase of 3% over and above the current dairyproduction (Table 3). This increase could be achieved through incentives and modestimprovements in services and technologies necessary to increase productivity in intensiveproduction systems. In both supply scenarios, a decrease in herd growth rate of 0.1% isassumed (this will result in the dairy herd growing at a modest 1.6% per annum by 2010).Under these assumptions in supply, the total offtake would rise by 69% and 145% forscenarios one and two, respectively, by 2010. During the same period, the dairy herdproduction would increase from 83%, to 88% and 92% of total production for scenarios oneand two, respectively.Table 2. Projected dairy supply a without (Scenario 1) and with (Scenario 2)intervention to improve dairy herd productivitySupply variable 1998 2005 2010Scenario1Scenario2Scenario1Scenario2Traditional herd population ('000) 10,221 11,034 11,034 11,655 11,655Dairy herd population ('000) 3,173 4,458 4,458 5,372 5,372Traditional herd prod. (m. litres) 511 552 552 583 583Dairy herd prod. (m. litres) 2,805 3,715 4,847 4,477 6,771Total prod. (m. litres) 3,156 4,267 5,399 5,059 7,354a Projections are based on cattle population estimates of MoA (1996) and on a rough estimate oftraditional herd growth rate of 1.1%, dairy herd growth rate of 5%, and a decrease in both growthrates of 0.1% per annum. Dairy production growth rate is estimated at 4.3%. Scenario 2 iscalculated from a 3% increase in annual dairy productivity.Projections in demandEstimated annual human population growth rates of 3.3% (3% for rural and 5% for urbanpopulations) (CBS, 1989; 1995), and annual per-capita consumption for 1996 of 101 and156 litres for rural and urban populations, respectively, are assumed for estimates ofdemand (Table 3). Each (rural and urban) population's growth rate is assumed to bedecreasing annually at 0.05%, resulting in a decreased overall population growth rate to2.7% by 2010. These rates of growth will result in about 19% of Kenyans living in urbanareas by 2010. Annual per-capita real GDP growth rates of 1.0% and 2.0% are assumed forthe first and second scenarios, respectively. Income elasticity of demand for milk isestimated at 0.8.Though Kenya has up to now been considered to be self sufficient in dairy production,projections under these modest assumptions in supply and consumer demand indicate13
future shortfalls in production. The demand for dairy products would rise to about 5.8 millionMT by 2010, 15% higher than the expected production if there is no intervention. Theprojected demand and production gap is due to Kenya's high rate of population growth rateof 3.3% per annum and a reduced dairy herd growth rate. Most of the projected increases indemand for marketed milk are going to be in urban areas, where average incomes and thepopulation growth rate are higher than in the rural areas.Table 3. Projected dairy demand aDemand variable 1998 2005 2010Rural population (million) 25.2 30.3 34.2Urban population (million) 8 4.6 6.4 7.9Overall population growth rate (%/yr) 3.3 2.9 2.7Scenario 1: Rural per-capita consumption (litres) 102 108 1131.0% real Urban per-capita consumption (litres) 153 162 169annual GDPgrowth rateAverage per-capita consumption (litres) 110 118 138Demand (million litres) 3,288 4,320 5,185Production gap without intervention (million litres) 29 53 126Scenario 2:2.0% realannual GDPgrowth rateProduction gap with intervention (million litres) 29 -1079 -2169Rural per-capita consumption (litres) 104 116 126Urban per-capita consumption (litres) 156 174 189Average per-capita consumption (litres) 112 126 138Demand (million litres) 3,341 4,639 5,792Production gap without intervention (million litres) 82 372 733Production gap with intervention (million litres) 82 -760 -1562a Calculations based on 1996 production estimates and current rural and urban population annualgrowth rates of 3% and 5%, respectively, with an overall annual decrease in population growth rate of0.05%; urban/rural consumption ratio of 1.5; and income elasticity of demand for milk of 0.8.The predictions confirm the projected shortfalls in marketed milk supply contained in theDairy Master Plan (1991). Assuming real GDP per capita grows at over 2%, closing theproduction gaps will require that government, NGOs, bilateral and multilateral donorssupport on-going (and planned) dairy development programmes to reduce the expectedincrease in overall deficit. Table 3 shows Kenya could become a net exporter of dairyproducts in the next 5-10 years with a modest improvement (3% increase) in the productivityof the dairy herd. That modest increase in productivity and supply can be realised becausethere is presently good opportunities for improvement due to the increasing stimulus for14
private sector involvement in dairy production, with good opportunities for smallholders tomeet shortfalls in local supply. Low per-capita milk availability in neighbouring countries (e.g.6Million MT Milk/ Yr5431998 1999 2000 2001 2002 2003 2004 2005 2006 2007 2008 2009 2010Year2% GDP Grow th 1% GDP Grow th Milk ProductionTanzania; MOAC/SUA/ILRI, 1998) also provides opportunities for exports.Figure 3. Projections in dairy demand and supply at 1% and 2% GDP growth rate3.2 Present Milk Marketing ChannelsIt is estimated that of the annual production of 2.5 million MT from the dairy herd, 1.72 millionMT (69%) are produced by the smallholder dairy herd (Peeler and Omore, 1997). Of thissmallholder production, on-farm consumption or non-marketed milk accounts for 626 millionlitres (36%) 9 and the remaining 1,092 million litres (64%) is marketed 10 . About 20% ofmarketed milk flows through KCC and private processors. The remainder of the marketed milkis sold as non-processed milk. The non-processed milk market channels include: (i) direct milksales to consumers by farm households (35%) 11 ; and (ii) milk collected by dairy co-operative8 An urban population proportion of 15% (CBS, 1995) has been used for these calculations. This islower than the approx. 32% given by World Bank (1989). The higher urban population proportionimplies higher demand9 Farm consumption comprises calf and family consumption. Calf consumption is based on 3 litres perday per calf for 90 days for a calving rate of 70% and pre-weaning mortality of 20%. Familyconsumption is an estimated 2 litres per day for each of the estimated 625000 dairy farm households.10 These figures have been adapted from Peeler and Omore (1997).11 Estimated from total marketed production less the estimates of flows through informal traders, cooperativesand processors. The flows through each of these channels were established throughestimates of their numbers and average amounts handled by each market participant as follows:About 4,000 informal traders each handling about 100 litres/day; about 250 coops and SHGs eachhandling about 2,000 litres/day; and, about 45 processors each handling about 5000 litres/day15
societies, SHGs and individual milk traders who sell either directly to consumers 12 (16%),private processors (5%) or KCC (3%).There are however large regional differences in the milk marketing channels. In areas with highproduction, low consumer concentration or few alternative market outlets, such as Nyeri,Nyandarua, Koibatek, Trans-Nzoia and Nandi districts, marketing through KCC still dominates,with over 50% of marketed milk passing through their factories. The rest of the districts havemost of their milk passing through other private processors; self-help groups (e.g., Kirinyaga,Nakuru); individual traders or co-operatives (e.g., Kiambu, Murang’a, Meru); or, local sales fromproducer to consumer (e.g., Coast). Nairobi, Coast Province, Machakos, Narok, Kisumu, Siayaand parts of Western Province are milk deficit areas that receive milk from high productionareas delivered by KCC, small milk traders and private processors.FARM PRODUCTION - 1,72064%36%MARKETED MILK 1,092 NON- MARKETED MILK 62635% (55%) a60024% (38%)5% (8%)26%10%Co-ops+ SHG+Traders 4143% 5%FamilyConsumption 456CalfConsumption 17016%Private Processors 164KCC 443%CONSUMERSa Proportions of marketed milk in bracketsFigure 4. Milk marketing channels from smallholder dairy cattle production andestimates of amounts (million litres) and proportions of milk flows through each majorchannel3.3 Non-Processed Milk Marketing ChannelsThe flow chart (Figure 4) reflects the predominance of raw milk sales, which account for approx.884 million litres or about 80% of marketed milk, and the increasing role of private processorsas an alternative market channel for milk from smallholders.12 Consumers include individuals, hotels, institutions, factories and restaurants etc.16
Direct Producer to Consumer Milk SalesAbout 600 million litres or over half (55%) of marketed milk is through direct sales fromsmallholder producers to consumers (Figure 4). This marketing channel is common in areas oflow production relative to the number of consumers, particularly in the Coast, Nyanza andWestern Provinces, and Narok District. Nearly all milk sales from small-scale zebu cattle milkproducers in the rural areas are sold in this way.N. RiftWestern242028202615261822152014C. Rift281514112614S. Rift18 2012 142015Central Nairobi32281814121512North-EasternEastern28 - Retail price18 - Farm gate price3018Coast28232820301935MombasaFigure 5. Producer and retail prices for fresh raw milk (KSh/L.)17
Informal Milk TradersThe dramatic increase in the number of informal milk traders 13 in milk marketing is a recentphenomenon prompted by the liberalisation of milk marketing. For example, in Murang’aDistrict, 70% of milk sales were through KCC in 1995 (Owango et al, 1996) but reduced toonly about 5% in 1997 (Survey, 1997). Kiambu and Murang’a Districts have the highestconcentration of milk traders. In some cases, especially in Murang’a, traders are viewed ascompetitors to dairy co-operatives because they act as alternative channels and provide abetter price for milk from producers. In Kiambu, traders play a major complementary role toco-operatives by providing outlets for milk collected by the co-operatives. This may be dueto the value members attach to additional input services (veterinary clinical, AI, credit etc)provided by co-operatives in Kiambu, unlike those in Murang’a.Large differences in producer and retail prices exist from region to region. Farm-gate and retailprices ranged from KSh. 11 (US$ 0.18) and KSh. 14 (US$ 0.22) per litre, respectively, inNyandarua, to KSh. 20 (US$ 0.33) and KSh 35 (US$ 0.58) per litre, respectively, at the coast(Figure 5) 14 . The figures reflect a general rise in real farm-gate prices since milk marketliberalisation (Owango et al., 1996) and higher margins in areas of relative milk deficit.While most informal traders take milk to the nearest urban centres, some were found tocover long distances to reach markets that offer higher retail prices. For example a fewindividual traders travelled over 100km on public transport to deliver milk all the way fromMurang’a to Athi-River where retail prices, at KSh 32/litre, were almost double those inMurang’a. The traders mostly use bicycles or public transport to move around farms to collectmilk and the same means to deliver the milk to markets, including restaurants and individualhouseholds. They handle daily between 60 – 250 litres each and sell to hotels, restaurantsand individual customers, and earn gross margins and net market margins ranging fromKSh. 1.50 - 5 per litre and 8 - 19%, respectively (Table 4). The net market margins mainlyreflect returns to labour given the low operating costs and almost negligible capital costs.They are generally lower than those calculated for small milk traders in Tanzania where theyrange from 18-32% (MOAC/SUA/ILRI, 1998), reflecting, perhaps, the higher availability ofmilk in Kenya compared to Tanzania.Some traders (observed mainly in the Rift Valley) boil then cool the milk before sale, mainlyto lengthen shelf life because of the long distances and time that the milk takes to reach13 These refer to traders who transport milk on bicycles, pick-ups or public transport and milkkiosks/bars14 1US$ was approx. KShs 6018
consumers. Many milk bars and kiosks were found in all urban centres, some of which areoperated by dairy coops. They mostly sell raw milk that they buy directly from farmers,which they transport to their premises using public transport, bicycles or pick-up trucks.Some milk bars process the milk into yoghurt or ferment it to make mala. Records at KDBshow only about 250 traders, including milk bar/kiosk operators are licensed, meaning thatmany more operate without a licence.Table 4. Milk prices and margins for small milk tradersRegion Murang’a Athi Nairobi Nakuru Kitale Kisumu MombasaCostsBuying Price KSh. (P 1 ) 15 20 25 14 14 20 30Operating/Transportcosts0.5 1 3 2.50 3 3 3Total Variable Cost 15.5 21 28 16.5 17 23 33RevenuesSelling Price KSh. (P 2 ) 18 26 32 18 20 26 40Gross Margin (GM) 2.5 5 4 1.5 3 3 7Net Market Margin(GM/P 2 ), %Source: Survey (1997)14 19 13 8 15 12 17Dairy Co-operatives and Self-Help GroupsIt is estimated that over 200 dairy co-ops and self-help groups are currently engaged inactive milk marketing in Kenya. Most farmer groups are concentrated in central Kenya. Mostfarmer groups collect mainly morning milk, and sell it fresh. Amounts that cannot be soldfresh are often sold to private milk traders and KCC or processed into mala. A few (e.g.,Limuru and Meru Central Union) pasteurise the milk, besides making butter and yoghurt.Dairy co-op membership ranges from 60 - 12,000 per coop and their milk intake/day rangesfrom 20 - 20,000 litres, with approx. 75% of them handling less than 1,800 litres per day.More than double these figures are handled during seasonal flush periods. They sell asmuch raw milk as they can locally and take the rest to KCC or to other big private processorssuch as Brookside Dairy. A couple of co-ops at Athi-River/Kitengela and Ngong receivedmilk from traditional Maasai herds. Generally, only about 50% of co-op members are active,i.e., delivering milk at any given time. More coop members (e.g., about 50% of activemembers in Limuru Coop) in Kiambu use the feeds on credit facility as compared to coopmembers in other districts. This perhaps reflects that credit is not a very important constraint19
to smallholder dairy producers. Some dairy co-ops have a strong capital base with assetsin excess of KSh. 10 million (US$ 167,000) (e.g., Limuru and Molo). SHGs, in contrast, areoften much smaller with membership ranging from 12 - 1,200 and record milk intakes of lessthan 500 litres/day. They also have a much lower capital base. In many cases, members ofSHGs seem to have a greater sense of owner-ship and “belonging” than coop members.3.4 Processed Milk Marketing ChannelsPrivate and Co-operative Dairy ProcessorsUntil the early 1990's, milk processing in Kenya was almost entirely undertaken by KCC.Current records kept by the KDB indicate that last year (1997), there were some 45 registeredprivate milk processors with a capacity to process about 400,000 litres/day. Most are smallscale enterprises processing between 1,000 - 10,000 litres/day. Many small scaleentrepreneurs operating private processing outfits visited during this survey were previouslyemployees of KCC. A small number (e.g., Brookside Dairy) process over 50,000 litres per day.A cursory look at the records of most private processors show that their daily milk intakes areon an upward trend. Already, the upcoming processors provide stiff competition to KCC anddairy co-operatives for milk collection in many areas.Table 5. Milk Prices and Margins for some Private Milk Processors and Co-operatives(KSh./Litre)Cost ParameterMilk processors/Co-operativesJufred Boyo Coop Molo CoopProcessor (Muranga) (Molo)(Kirinyaga)KilifiPlantationsProcessor(Kilifi)WakulimaSHG(Nyeri)Full capacity (litres/day) 2300 10,000 50,000 12,000 5,000Capacity utilized, % 70-80 5-10 5-10 60-80 70-80Cost of raw milk (P 1 ) 15 15 12 19 13Operating costs 2.0 1.00 1.67 3.87 0.53Transport to market 0.60 0.50 0.86 0 0.67Total variable costs 17.6 16.5 14.5 22.9 14.2Selling prices (P 2 ) 20 16 15 36 16Gross margin (GM) 2.40 -0.50 0.47 13.10 1.80Net marketing Margin (GM/P 2 ), % 12 -3 3 36 11Source: Survey (1997)20
A few private and coop milk processing plants have a strong capital base and have attainedhigh industrial standards (e.g., Limuru, Brookside, Meru Central Union) but a majority usesimple equipment such as jikos and firewood to heat the milk in water jackets. Most smallscale private processors sell as much liquid raw milk as they can and only process theremainder.Table 5 shows the wide variation in margins realised between processors and coops in thehighlands and at the coast. Boyo Coop in Kangema Division of Murang’a District had anegative margin due to a low retail price and high competition from small milk traders whocollect milk from the same area to sell in Murang’a Town and other distant urban centres at abetter margin of 20% (Table 4). The two tables illustrate the competitiveness of privateenterprises (private processors and small milk traders) compared to coops. When capitaland other overhead costs of the coops are considered, their net margins would be evenlower compared to private enterprises especially small milk traders.KCCKCC has 11 plants countrywide. These plants are located at Naivasha, Nyahururu, Eldoret,Nakuru, Kitale, Nairobi, Kiganjo, Sotik, Miritini (Mombasa) and Dandora (Nairobi); 11cooling/collection centres located at Kapsabet, Lessos, Ainabkoi, Iten, Githumu, Kangema,Nanyuki, Runyenjes, Molo, Kilgoris and Eldama Ravine; and, 26 sales depots and subdepotslocated at Nairobi, Dandora, Mombasa, Nakuru, Kisumu, Eldoret, Kitale, Nanyuku,Thika, Naivasha, Machakos, Kericho, Kiganjo, Bungoma, Meru, Kisii, Nyahururu, Embu,Busia, Kabarnet, Sotik, Taveta, Kibwezi, Kitui, Makueni and Malindi. Their total capacity isabout one million litres/day or approx. 365,000 MT/year. Most plants currently operate atbelow 30% (the KCC Dandora plant, which is the biggest with half of KCC’s total capacity,was operating at less than 10% of its capacity in mid 1998). It is estimated that up to 60% ofthe KCC sales are in Nairobi.Milk intake by KCC over the last 10 years has declined from a peak of about 350,000MT/year in the late 1980's and early 1990's to only about 120,000 MT in 1996/97 (Figure 6)(KCC, 1997). This translates into only about 330,000 litres per day, compared to over400,000 litres per day that were reported to be privately processed during this survey. Thebeginning of the decline corresponds to the end of milk marketing monopoly by KCC and theemergence of private sector participants following milk market liberalisation and hence, canbe partly attributed to direct competition. This was quite evident in areas where milkhawking has increased remarkably such as in Murang’a District, where intake at the localKCC Plant at Kangema declined from a peak of 48,000 litres/day (its total capacity) to only21
2,000 litres/day in 1997. However, KCC continues to play a major role in reducing the milkdeficit in Coast Province and as buyer of last resort in many areas. When KCC has excessmilk, it is turned into powder for later reconstitution and sale in milk deficit areas and duringperiods of low liquid milk supply. In 1996/97, the KCC Miritini Plant in Mombasareconstituted about 27 million litres of milk powder, similar to the figure reported by Staal andMullins (1996) for 1990, when KCC also transferred an additional 20.5 million litres of liquidmilk from Nairobi to supplement the reconstituted milk. This liquid milk transfer from thehighlands is currently non-existent. The poor record of delayed payments of up to sixmonths that started in 1995 and limited farmer control are widely considered as the majorreasons that have contributed to the decline in milk intake by KCC.Intake(M illionLitre s)40035030025020015010050086/87 87/88 88/89 89/90 90/91 91/92 92/93 93/94 94/95 95/96 96/97YearFigure 6. Milk intake by Kenya Co-operative Creameries.Source: KCC Annual reports3.5 Milk Consumption and Preference PatternsSufficient information to assess milk consumption and preference patterns is generallylacking. One study based on a household survey at the coast found a near 100%preference for raw milk over pasteurised, fermented, powdered or UHT milk (Staal andMullins, 1996). They found that none of the existing market mechanisms (both formal andinformal) were adequate in meeting consumer preferences and overall market demand thatincreases with higher income and urbanisation. However, in a recent small urban survey ofmilk traders in Nakuru District, retailers indicated the frequency of sales for pasteurised milk,UHT milk and maziwa lala to be 36%, 23%, and 32%, respectively, compared to 36% for rawmilk (Kurwijila et al., 1997). These apparent wide differences in preferences between the22
Coast Province and Nakuru District may be a reflection of the different methodologies usedor a wide variation in milk consumption and preference patterns.The consumption study by Staal and Mullins (1996) at the Kenyan coast showed milk deficitsof up to 60%; MoA estimates show that milk deficits of between 30-40% also occur inwestern Kenya and in Narok.3.6 Public Health Concerns Over Informal Milk MarketingThe increasing role of informal non-processed milk market pathways in urban areas hasraised concerns by consumers and policy makers. The concerns are over public healthhazards that are believed to be associated with informal milk marketing, especially zoonosesof brucellosis and to some extent, zoonotic tuberculosis (caused by M. bovis). Previousgovernment policy of only promoting pasteurised milk sales (reflected in the many years ofprotection of KCC as the only legal milk marketing agent) and prohibition of raw milk tradewas geared towards minimising these risks. The changed policy scenario means thatalternative mechanisms must be found to protect public health, if indeed those risks are real.Appropriate mechanisms for protecting public health however cannot be formulated in theabsence of accurate information. These concerns are the subject of a study that hascommenced under the MoA/KARI/ILRI Smallholder Dairy Project, which will investigate therisks at the farm- market- and consumer-levels, and produce accurate information for policymakers. During this appraisal, these concerns over milk-borne diseases were particularlyraised in Nakuru, Uasin-Gishu, Nandi and Narok districts.Indications are that these concerns over brucellosis, a contagious disease, may be more realin extensively grazed herds than in smallholder intensive farming systems. Muriuki et al.,(1994) reported an overall proportional morbidity of 5.5% among all hospital cases and 14%among those with flu-like symptoms in a study among Maasai pastoralists in Narok District.In contrast, one localised study conducted on intensive dairy farms in Kiambu District founda 2% apparent prevalence (Kadohira et al., 1997), indicating that brucellosis is unlikely to beimportant in local smallholder dairy herds.Unlike all other neighbouring countries, there has never been a report of M. bovis infection ineither bovine or human populations in Kenya.23
3.7 Main Issues in Consumption and Marketing1. The good opportunities for continued growth in smallholder dairying given projected localdemand (at least 70% increase over the next 12 years) and supply projections. Withmodest improvements in milk supply of at least 3%, substantial amounts of dairyproducts would be available and could be exported. Potential markets for export exist inneighbouring countries (e.g., Tanzania with a very large gap between demand andsupply of dairy products).2. The increasing role of the informal private sector in milk marketing and concern by theformal private sector (including coops) about unfair competition regarding taxation, whichinformal operators do not pay; and the cost of observing quality standards, which doesnot apply to informal operators3. Increasing concern by consumers and policy makers over milk-borne public healthhazards, and the lack of information to quantify the actual risks.4. Seasonality in milk supply and the lack of sufficient mechanisms by the informal andformal milk markets to level off its impacts. The current dry season premiums paid bysome processors have not had the effect of stabilising supplies because the level ofincentives and the market share for processed milk are small.5. Lack of reliable information on milk demand patterns, including product differentiationand the changes in dairy consumption habits with urbanisation.6. Limited market information on input (e.g. feed) and output markets, and the suitability ofalternative market mechanisms7. Farmers’ preference for reliable marketing channels that pay promptly and offeradditional services, over the price offered per-se.24
4. Dairy Production SystemsThis section summarises the major findings of the RA on the dairy production systems. Thecharacteristics of the principal milk sheds and production systems within them are described.4.1 Milk ShedsAbout 60% (approx. 1,900 MT) of total milk production in Kenya takes place in less than10% of the country's landmass in the central districts of the Rift-Valley and CentralProvinces, where 80% of exotic and cross-bred dairy cattle are found. All these districts fallwithin agro-climatic zones (ACZ) 1-4, 15 and have fertile volcanic soils in most areas. Otherareas with significant dairy production include Western Province, and Kisii and MeruDistricts. Extensive cattle production from the East African Zebu (particularly in agropastoralareas in the Rift-Valley, Eastern and North-Eastern and in sedentary areas in Coast,Nyanza, Western and Eastern Provinces) also contribute a small proportion of their milkofftake to local rural markets including direct sales to neighbours.Table 6. Livestock numbers a and milk offtake by species and regions 16ProvinceIndigenous cattle Dairy cattle GoatsPopulation(‘000)Milk offtake(‘000 MT.)Population(‘000)Milk offtake(‘000 MT.)Population(‘000)Milk offtake(‘000 MT.)Central 78 5 810 694 13 0.1Coast 1,074 62 45 35 711 2.4Eastern b 1,498 86 273 235 1,400 4.9N. Eastern b 809 44
Total milk offtake from indigenous and improved dairy cattle is estimated at 575,000 MT(19%) and 2,502,000 MT (81%), respectively (Table 6). Production from local and a few(
concentrated near consumers (e.g. Nairobi) and in the highland areas with a suitable agroclimateand high human population density. This is similar to recent findings in Tanzania(MOAC/SUA/ILRI, 1998) and confirms the presumption that market-oriented dairying isprimarily a function of market accessibility, agro-climate and good infrastructure. Productionparameters for selected production systems are summarised in Table 8.Large scale cattle production systems(i) Large scale dairy intensive and semi-intensive dairy cattle production systemsLarge scale dairy production systems consist of large farms owned by individuals, privatefirms and public institutions such as the Agricultural Development Corporation (ADC). It isestimated that there are approx. 500,000 heads (about 17% of the total population of exoticand cross bred dairy cattle) (MoA, 1996) in large scale dairy systems. The herd sizes areskewed with a few farms having over 100 heads, though any farm with more than 20 head isclassified as large scale. Friesian is the dominant breed, but Ayrshire, Guernsey and Jerseyare also found. Some farms in the drier areas cross Sahiwal with the local EAZ breed.Management in these farms varies greatly from very low input, low milk output, semiintensiveto mechanised intensive production based on irrigated legume production andmachine milking. The farms are a source of breeding heifers for many smallholdings and forbuyers from neighbouring countries, particularly Tanzania. In-calf heifer prices in wellmanagedfarms are over KSh 50,000 per head. The lack of a regular livestock censusmakes it impossible to determine whether the number of farms and cattle in this systemcontinues to decline, as was the case in the 1960's and 70's, or whether they are stable.Indications from recent SDP characterisation surveys in the Nairobi milk shed suggest thatthe number of cattle in this system may not be as many as previously assumed.(ii) Large scale extensive dairy-meat cattle production systemThis system is mostly pastoral and agro-pastoral with EAZ cattle (and some small ruminants)in the low rainfall areas (ACZ 5-7). It is found in the northern and southern regions of the RiftValley, Coast and Eastern Provinces. In some areas, improved Boran and Sahiwal bullshave been introduced (Roderick, 1995). The numbers of cattle in pastoralist herds are alsovery skewed with a minority of pastoralists owning herd sizes of over 150 heads, though anyfarmer with over 30 cattle falls in this category. They have access to considerable grazingland. Production in some areas (e.g., south Rift Valley and Coast) is constrained by tsetsechallenge and by feed shortages during the long dry seasons.27
Table 7. Dairy and indigenous cattle production systems in KenyaProductionSystemLarge Scale1. a) Intensivedairyb) Semi-intensivedairySmall Scale1. a) Intensivedairy-manureb) Semi-intensivedairy-manureMajorProduct(s)Agro-Climate/Farming SystemExotic dairy humid to semihumid/(ACZ 1-3)crops-livestockExotic/crossesdairyhumid to semihumid/(ACZ 1-3)crops-livestockZebu dairy-meat semi-arid to arid/(ACZ 5-7)livestock onlyExotic/crossesExotic/crossesZebu/fewcrosses2. Extensive dairymeatdairymanuremostly marketorienteddairymanurehumid to semihumid/(ACZ 1-3)crops-livestockhumid to semihumid/(ACZ 1-3)crops-livestockhumid to semi-arid(ACZ 1-5)Purposeentirely marketorientedmostlypastoralismmostly marketorientedmostlysubsistenceGenotypeManagementintensiveentirely marketorientedSemiintensiveCattlePopulation a‘000 %Milk Prod('000 MT)No. ofHouseholds b‘000 %Major Production Regions} 500 4 782 5
Small scale cattle production systems(i) Small scale intensive and semi-intensive dairy-manure cattle production systemsAbout 80% of dairy cattle are found in this production system, which is common in thehighland areas of central Rift Valley and Central Provinces. The farms are small and thefarmers produce cash and food crops besides milk. In the intensive systems within thesehighland areas, farmers own about 4 cattle on approx. 1 ha. of land cropped with anycombination of coffee, tea, maize, edible horticultural crops and some fodder, depending onagro-climate and terrain elevation (Jaetzold and Schmidt, 1983; Gitau et al., 1994a; Staal etal., 1998). A high proportion of farmers stall-feed their cattle. The system is common inKiambu and Murang’a Districts. In Kiambu District, this system is practised by about 70% ofhouseholds (Staal et al., 1998). In the semi-intensive production systems, the number ofcattle and the land area per household are slightly larger than those in the intensivesystems. Most farmers free-graze or paddock-feed their cattle. The system is common inthe Rift Valley and in Kirinyaga, Embu, Meru and Nyandarua districts.Milking is twice a day in most areas and is done by hand in almost all farms. Some of themilk is bucket fed to calves up to 3 months of age (about 3kg/calf/day). A few farms, withgood market access (e.g., in Nairobi and Machakos) were observed to milk thrice a day.Housing recommendations promoted by the National Dairy Development Project (NDDP)that include roofing and concrete floors, have been adopted by only a few farmers. Mostcow sheds are built of cheap locally available materials and have earthen floors. In KiambuDistrict, only 50 and 28% of cow sheds are roofed and have concrete floors, respectively(Omore et al., 1996a).In-calf heifer prices in this system range from approx. KSh. 15,000 in the semi-intensivesystems to about KSh. 30,000 in the intensive system 19 . Productive performance is low withlong calving intervals of about 600 days (Odima et al., 1994); high calf mortality rate of about20% and low milk yields, mostly between 5-8kg/day; the result of under-nutrition (Omore etal., 1996b; Staal et al., 1998).19 In-calf heifer and cow prices generally reflect the total value of milk that a cow is expected toproduce in a year29
Table 8. Production Parameters across selected Cattle Production SystemsProduction ParameterLarge scaleExtensive(Zebu)Production SystemSmall scalesemiintensive(zebu)Small scaleSemi-intensive(exotic/crosses)Small scaleIntensive(exotic/crosses)Herd size >30 1-30 1-20 4 (1-10)Farm size (ha) Communal 30 10 4Breeding management Bull Bull Bull/AI Bull/AIGrazing managementFree Free (agropastoral)Semi-zero Zero(pastoral)Cultivated land (ha) 0 1-5 4 3Natural pasture (ha) communal 20-25 5 0Proportion breeding cows (%.) 35 35 40 40Planted pasture (ha) 0 0 200 >200 90 90Adult mortality (%/yr) 6 6 5 5Price of in-calf heifers (KSh) 8,000 8,000 20,000 25-30,000Lactation length (days) >200 >200 450 450Milk offtake (litres/cow/yr) 200 250 1555 2000Milk for calf rearing (litres/cow) suckling suckling 270 (bucket) 270 (bucket)On-farm consumption (litres/cow/yr) 150 240 650 650Marketed milk production (litres/cow/yr) 0 10 905 1350Average gross margin (KSh/cow/yr) 7,000 9,000 20,000 25,000a Rates are presented as true rates.Sources: Stotz (1983); Moll et al., (1984); de Leeuw and Wilson, (1988); Bekure et al., (1991); Odimaet al., (1994); Gitau et al; (1994a,b); Maloo et al., (1994); Roderick (1995); Latif et al., (1995);Semenye (1987); Omore (1997); Peeler and Omore, (1997).Though limited access to breeding services may be a major cause of long calving intervals,many farmers voluntarily wait for long periods of up to 200 days after calving before gettingtheir cows served or inseminated again (Odima et al., 1994). Indications are thatsmallholder farmers may not be interested in reducing the long calving intervals until theyrealise higher milk yields with peaking lactation curves because the extra benefits of reducedcalving intervals under current production are minimal (Tanner et al., 1997).Many farmers use manure to fertilise their food and fodder crops, either in the form ofcompost (which may include poultry waste), slurry or fresh dung. However, little is known30
about the efficiency of nutrient flows and details of manure management practices, tooptimise crop and livestock production in the areas where manure use is common.Indications are that manure is not used optimally due to lack of knowledge about how toextract maximum benefits from them (Lekasi, personal communication).Low calf growth rate (mean weight gain only 0.24 kg/day) up to 5 months of age and highannual calf (up to one year of life) morbidity and mortality (mostly due to diarrhoea) of 27 and22%, respectively, have been reported in intensive systems (Gitau et al., 1994b). The poorgrowth rates result in late age at first calving averaging 41 months (Odima et al., 1994). Thelow dam milk production is also an important constraint to optimal calf growth.(ii) Small scale semi-intensive dairy-meat-draught-manure cattle production systemMany farmers, who are mostly subsistence oriented, practice small scale semi-intensiveproduction with predominantly EAZ herds and a few crosses in the same agro-climate asintensive producers above (ACZ 1-3), and in the drier areas (ACZ 4-5). Farmers practisingthis production system own between 1 and 15 ha. depending on geographic region and ACZand up to 30 cattle that are mostly grazed. These farmers not only have the objective ofproducing milk but also frequently sell surplus animals for meat and in some instances alsouse bulls or steers for draught power, especially in Western and Nyanza provinces. Cattleare paddocked, tethered on the farm or taken to graze in communal areas. Cows areusually milked once a day for approx. five months of lactation. Calves are allowed to suckletheir dam after milking and left to suckle freely after the period of extracting milk for humanconsumption. Crops grown include cotton and tobacco (mostly in Western and Nyanza),maize, sorghum, millet, rice, cassava and sweet potatoes. Crop by-products are fed to cattleand in many areas manure is used to fertilise crops.4.3 Breeding ManagementPrivate provision of reproduction services by individuals or farmer groups is slowly emergingto replace the reduced public support for such services. The large-scale dairy cattleproduction systems depend mainly on private AI services. However, small-scale dairyproducers depend partly on public (government provided) or farmer-group provided AI/bullservices as well as private AI services. Prices paid are mostly between KSh. 200 - 400(approx. US$ 4 - 8) per insemination, depending on whether transport is included, or theservice is provided at home or at the roadside. Some dairy co-ops have pooled efforts toprovide the services at a reduced cost per insemination (e.g., Nderi, Kikuyu and Kabetedairy coops in Kiambu). Most private AI providers are concentrated in areas with high dairy31
cattle density indicating that market concentration (scale and size) is critical to the efficientprovision of private AI and other livestock services.The high reproductive wastage due to high calf mortality stated elsewhere in the text hasimplications for the ability of farmers to select female replacements. Most calves that surviveare selected for survival rather than growth.4.4 Feeding ManagementIn all milk sheds dairy production is influenced by seasonality in feed availability and quality.Stall-feeding of crop residues, natural (mostly Kikuyu, Star and Rhodes grass) and plantedfodder (mostly Napier grass), is common and increasing in importance, particularly in periurbandairy keeping households and districts with high human population density (Table 9).Table 9: Area of natural and planted fodders in some districts.Province/DistrictRift ValleyNaturalpasture('000 ha)Improvedpasture('000 ha)Napier +other fodder('000 ha)FodderTrees('000)Legumes(ha)Nakuru 261 32 5 - 170Trans Nzoia 64 10 2
Common crop residues are maize stover, wheat straw and horticultural crop residues.Purchase of fodder (Napier grass or hay), some of which originates from roadsides, iscommonly practised by farmers in the most intensive farming areas such as Kiambu District(Staal et al., 1998). Prices range from KSh. 70-120 per bale of hay or backload of Napiergrass around Nairobi.Planted fodder may, in few circumstances on smallholder farms, include sweet potato vinesand various kinds of legumes such as vetch and desmodium or fodder trees such asCalliandra (mainly in Embu) and Leucaena. Farmers also feed purchased grainconcentrates and milling by-products such as brans, wheat pollard and some dairy meal.Many farmers complained about the high cost of dairy meal (KSh. 700-850 per 70kg bag)and opt instead for the cereal by-products (KSh. 550-600 per 70kg bag) 20 . Variable amountsof concentrates are usually fed to cows at milking time with many smallholders feeding a flatrate of about two kg per day throughout lactationThe inadequate availability of quality feed resources and low dry matter intakes by themajority of dairy cattle is the major cause of low milk yields and collapsing logarithmicfunctionlactation curves (Omore et al., 1996b, Staal et al., 1998). An experiment, that hasjust been concluded, on re-allocation of concentrate feeding to early lactation in order tochange the shape of the lactation curves by allowing milk production to peak, shows tangiblebenefits (Biwott, personal communication). The translation of these lactation curves fromlogarithmic- to peaking gamma-function shapes in early lactation may also provide farmerswith an additional incentive to shorten calving intervals and improve productivity (Tanner etal., 1997).4.5 Animal Health ManagementThe major diseases cited by most extension personnel as adversely affecting dairyproduction are tick borne diseases (TBDs), especially East Coast fever (ECF). The impactof TBDs is through high mortality rates and high cost of control through the use of acaricides(mostly hand sprayed) and therapy. The actual incidence and impact of these diseases hasbeen ascertained through field studies in some areas in the coastal lowlands and in thehighlands of central Kenya. Evidence from these studies show that TBDs are especially aproblem in the more extensive free grazed and semi-intensive paddocked herds in lowlandareas (Table 10).20 Prices at the time of this survey (end-1997).33
Whereas the risk of ECF in such areas have been shown to be as high at 30% per year andaccount for over half of all clinical cases (Maloo et al., 1994), the risks in the highlands(ACZ1-2) especially in stall-fed dairies, are less than 3% per annum (Omore et al., 1996b;Gitau et al., 1997). Additional information on the incidence of these diseases in other areasare expected from studies in western Kenya by KARI's National Veterinary ResearchCentre-Muguga and characterisation surveys recently conducted in eight districts underSDP. However, based of the information already available, it is clear that the economicmerits of TBD control, using either acaricide or vaccination, will vary by region and by farmwithin regions.Table 10. Impact of East Coast fever on smallholder dairy production in KenyaECF ImpactIndicator aACZ 1-2 ACZ 3-5Central Highlands Central Highlands Coastal LowlandsZerograzingFreegrazingZerograzingFreegrazingZerograzingOpengrazingAnnual Incidence Very low Low Low High High Very highProportionalmorbidityProportionalmortalityHigh Very high Very high Very high Very high Very highVery High Very high Very high Very high Very high Very highCase-fatality High High High Very high Very high Very highAntibodyHigh High Very high Very high Very high Very highprevalencea Very high =>50% High=20-49%; Low= 5-19%; Very low=
experimentally vaccinated in the early 1990's and about 1,000 in the highlands alsoexperimentally vaccinated in 1995/96. Apparent success in reducing morbidity and mortalityrates by ECFiM was reported at the coast and similar benefits may be expected in otherareas of high ECF risk.Intensification has been known world-wide to be associated with production limiting diseasessuch as mastitis and lameness. However, investigations under local intensifying dairyproduction systems indicate that they are currently not a priority. Clinical mastitis incidenceis low at only 13.3 per 100 cow-years at risk and there is only modest association betweensub-clinical mastitis and milk yield (Omore et al., 1996a). Similarly, though cattle arepredisposed to lameness and foot lesions due to confinement in the zero-grazing housingconditions, the incidence of lameness is less than 2% per month (Gitau, 1995). Theoccurrence of these diseases of intensification show that they are not a big constraintcurrently, although they can be expected to become a big problem once milk yields increase.4.6 Main Issues in Production Systems1. The lack of a livestock census to allow accurate production estimates. Randomhousehold surveys in Kiambu and Kilifi have shown that present estimates may behigher or lower than MoA estimates by as much as 50% or more.2. The severe constraint of the scarcity of quality feed resources especially in the dryseason. This constraint is expected to become even more severe with continuing landsub-division, unless efficient fodder markets emerge to fill the gap. Though manytechnologies on feedings strategies to improve production have not been tested on-farm,there is poor delivery of technical information on the efficient use of available feedresources.3. The important disease challenge in many extensive areas especially TBDs andtrypanosomiasis in Coast and central Rift Valley Provinces. The real and perceived riskof these diseases also inhibits adoption of dairying in some areas, especially in westernand Nyanza Provinces.4. Smallholder farmers do not have access to suitable replacements due to limitedavailability of good breeding stock and declining breeding services.5. The low adoption of smallholder dairying in some apparently suitable areas that wouldalso benefit from improved soil fertility with cattle manure application e.g., parts ofwestern Kenya.35
5. Policy and Institutional IssuesThis section summarises the major issues on how policy and institutional aspects haveaffected present dairy outcomes, especially since the beginning of liberalisation of theeconomy, and how policy reforms at the national and local level can make better use of thetechnical and economic potential for smallholder dairy development. This includes analysisof the effects of liberalisation on the dairy sector -- and the competitiveness of smallholderstherein -- of public policy and institutional arrangements, and of government and donoractivities and investment.5.1. Regulatory EnvironmentRelevant Acts of ParliamentOfficial regulations for the dairy industry in Kenya are contained in the Dairy Industry Act(CAP 336 of the Laws of Kenya) which was first enacted in 1958 and established the KenyaDairy Board (KDB) to regulate the dairy industry. The act has been revised several times inthe past (1962, 1972 and 1984) to improve the dairy. The KDB has mostly concentrated onits policing role at the expense of its other functions including: promotion of market researchin dairy produce; improvement of quality of dairy produce; and, promotion of privateenterprise in the production, processing and sale of dairy produce. Another major weaknessof the Dairy Industry Act has been the concentration of authority in the hands of thegovernment minister in charge of agriculture. For example, the appointment of officials torun KDB, and the nomination of KCC in the past as the sole agent for KDB never workedwell for the industry. The latest revision, which is intended to bring the act into line with theliberalised dairy industry, is about to be enacted into law at the time of this write-up. Therevision includes the establishment of a restructured KDB with enhanced functions andcapacity to improve its role.The other important regulation is the Co-operative Development Act, under which all dairymarketing co-operatives fall. Again, this act has in the past not allowed sufficient farmercontrolof dairy co-operatives, thereby contributing to a high incidence of mismanagement.The act has been revised recently (1997) but its impacts on the ground are yet to berealised.36
TaxesProducers pay cess levy at 2 cents per litre to KDB. The cess is only paid from milk salesthrough processors and coops other than KCC, who are exempted from paying it. Thisdenies KDB an important source of income. Large scale farmers would normally pay incometax but most small scale producers do not. Sales of processed milk products fromestablished enterprises are subject to value added tax (VAT) at (16%). Imported milk andmilk products are subject to import duties and other levies.Land tenureThe land tenure policy in Kenya (Agriculture Act, CAP 318 of the Laws of Kenya) that allowsprivate land ownership is considered to be one of the key factors that has spurred growth ofdairy production. The policy has over the years had the positive effect of allowing producersto access credit by taking advantage of the collateral value of land, though this advantagehas lately been greatly curtailed by expensive credit from the formal banking sector. Thepolicy sought to prevent uneconomical sub-divisions of agricultural land by stipulatingminimum land sizes in various areas but this is rarely implemented.Major impacts of dairy market liberalisationThe immediate impact of the dairy market liberalisation has been increased participation inmilk marketing by formal and informal market agents. This has had the effect of redistributingthe benefits of dairying including increased employment opportunities, increasedmilk availability and an increase in real farm-gate milk prices thereby increasing producerearnings. There is also a positive shift in the concerns of farmers from difficulties with milkmarketing to investigating options for increasing production. The other major impact hasbeen the changes in relative prices in various regions that now reflect market access(Owango et al., 1996). However, as already noted, the legal framework to increase thebenefits of market liberalisation has lagged behind the policy change. For example, thoughKDB now issues licences to traders of raw milk, the regulations that were there beforeliberalisation (that disallowed trading in non-processed or non-pasteurised milk products) arestill in place. The KDB is also in a dilemma on how to institute new regulations in theabsence of information on actual risks faced by consumers of raw milk.With more accurate information 22 on the risks to humans from informally marketed milk, thepresent regulations will need to be revised. The trade-offs from implementation of some22 A study, on “Public health hazards of informal milk marketing in Kenya” is underway by SDP andthe Dept of Veterinary Public Health, University of Nairobi in collaboration with various stakeholdersincluding KDB and Kenya Medical Research Institute (KEMRI).37
hygiene and quality regulations are substantial. They are favourable in that, aside fromhelping to ensure the standard of formally marketed milk, they assist in boosting the imageof milk generally as a healthy product and thus may have a promotional effect on milkconsumption. Importantly, however, the strict implementation of regulations creates strongincentives for markets to avoid them due to the costs of compliance, and the consequenthigher sale prices of dairy products. In a market where purchasing power of the customers islow, this clearly weakens the competitiveness of the formal sector. The policy question thatneeds to be answered is thus: is it preferable to maintain strict milk standards which result inhigher costs and thereby free most marketed milk into informal channels, or is the publicbetter off by standards that are relaxed but capture more of the informal market? Ifstandards were relaxed to officially allow raw milk marketing, yet regulations regardinghandling, permissible time to retailing, and adulteration are maintained with some incentivesto milk traders to comply 23 , then a much larger proportion of the milk market may fall underregulatory control, improving the average standards of milk in the market.5.2 Farmer OrganisationsDairy marketing farmer organisations mainly comprise dairy co-operative societies andSHGs. Dairy co-ops are organisations registered with the Ministry of Co-operativeDevelopment, while SHGs are registered with the Ministry of Culture and Social Services.Functionally, there are no differences between dairy co-ops and SHGs engaged in milkmarketing. In comparison to other East African countries, farmer organisations and cooperativesin Kenya have played a critical role in assisting the participation of smallholderdairy producers in the market. Combining the roles of milk collection and service provisionpermits farmer groups to maintain an advantage over other actors in the milk market,principally because they offer producers the advantage of accessing distant markets at lowermarketing costs per litre of milk due to bulk purchases and sales.Dairy co-operative membership has generally been on an upward trend since 1963 whenthere were only 2,300 members to over 100,000 members currently (MOCD AnnualReports). Karlen (1995) established that dairy co-ops account for 34% of all co-operativesocieties in Kenya, and that they are mostly concentrated in the central highlands. It wasobserved during this study that SHGs were more popular in some areas (e.g., Kirinyaga)than co-ops because of the history of mismanagement in coops. As a result, some co-opshave become dormant. Both co-ops and SHGs offer producers in high milk production areas23 Some examples of incentives could include basic training in milk handling and hygiene, or an officialstamp of approval, which they could use to promote their milk to customers.38
the advantage of accessing distant markets at lower marketing costs per litre of milk due tobulk purchases and sales.Kiambu District has the most well established milk marketing infrastructure through some 14dairy co-ops with memberships ranging from a few hundreds to several thousands, some ofwhich were established in the early 1960's (e.g., Limuru Dairy Co-op Society, established in1962 and with a current membership of 7,000). Beyond milk marketing (which is mostly ofraw milk), most of the dairy co-ops in Kiambu provide some or all of the following additionalservices: credit; the bulk supply of feed, drugs and other dairy inputs; and AI and veterinaryservices. In terms of provision of services, larger co-operatives (with many members) arebest placed (Ombui et al., 1995, Owango et al., 1996). To enjoy the same services at acheaper cost, smaller co-operatives have began to pool resources, to be able to providemore services, including AI, at a cheaper cost. Dairy co-ops are also reasonably wellestablished in Murang’a and Nyandarua Districts, but they offer few services beyond milkmarketing.Other areas of the country do not have a high concentration of co-ops either because they arerelatively low milk production areas (hence most sales are direct from producer to neighbour),KCC still plays a dominant role, or other private milk processing dairies provide adequateservice. For example, in Kirinyaga District there is only one active co-op, the Kirinyaga DairyCo-operative Society, which is currently handling about 4,000 litres of milk per day. The cooperativesells raw, pasteurised and fermented milk. Private processors in the district handlein total an equivalent amount of milk to dairy co-ops and are beginning to provide some of theinput services that co-ops provide. The central Rift Valley, though being a high dairyproduction zone, has relatively fewer co-ops than Central Province. Only a few co-ops werefound in Machakos and Kitui Districts.There are breed societies with origins in the colonial era when they were formed to serve theinterests of large scale European settler farmers. The societies still mainly serve theinterests of large-scale dairy producers. These societies exist for the following breeds:Friesian, Ayrshire, Guernsey, Jersey, Sahiwal and Boran. All breed societies maintainrecords of pedigree animals through the Kenya Stud Book (KSB). There are moves tointegrate all the breeders’ societies into one strong group.39
5.3 Livestock Support ServicesResearchThe reorganisation of agricultural research activities in Kenya resulted in the creation of theparastatal Kenya Agricultural Research Institute (KARI) in 1989 with a national mandate tocarry out both crops and livestock research. KARI has several research centres spreadthroughout the country with either national and/or regional research mandates. Nationalmandates include strategic and basic research activities whereas regional mandatesemphasise adaptive farming systems research. Research centres with both national andregional mandates for dairy research are situated at Naivasha and Muguga. Centres withregional mandates are situated at Kitale, Kakamega, Muguga, Kisii, Embu, Katumani andMtwapa. This deliberate focus on adaptive farming systems research approach iscommendable. The institute has recently completed its second priority setting exercise toenable it better focus its research activities; it considers dairy as one of the most importantcommodities for research. Current priorities under dairy research (KARI, 1996) fall under thefollowing thrusts: i) socio-economics; ii) feed resources and utilisation; iii) animal health; andiv) animal breeding/genetic improvement. Under the socio-economics thrust, the instituteidentified research on policy environment as a priority. The main priorities identified underfeed resources and utilization were: improving cow and heifer diets; forage/food crop intercropping;and, on-farm testing of forage technologies. Improvements in cow fertility and onfarmECF control were identified as needing urgent attention under the animal health thrust.KARI has started to actively encourage the private sector to get involved in addressingpriority research issues, including financing of research activities that benefit them. BesidesKARI, useful research directly or indirectly related to dairy has been and continue to becarried out at agricultural faculties at the University of Nairobi and at Egerton University,Kenya Trypanosomiasis Research Institute (KETRI) and the Kenya Forestry ResearchInstitute (KEFRI).National dairy research to date has contributed to the identification of useful productiontechnologies (especially feeding strategies), besides identifying and attempting to resolvesocial and economic constraints to the development, adoption and productivity ofsmallholder dairy systems. However, the translation of a number of these technologies intoadoptable interventions by farmers still remains a major challenge.The International Livestock Research Institute (ILRI) has been an active collaborator in anumber of national dairy research activities. Notable examples include: the KARI/ILRIcollaborative research activities on smallholder dairy in the coastal lowlands which was40
concluded in 1994; KARI/ILRI/MoA collaborative smallholder research and developmentactivities currently being carried out in the highlands; and, field testing of animal healthtechnologies. The International Centre for Research in Agroforestry (ICRAF) is also involvedin research aimed at improving natural resource management through the introduction oftrees, including cattle fodder trees.Input supplySuccessful delivery of AI services country-wide since 1966 through the Kenya NationalArtificial Insemination Services (KNAIS) has been a major contributor to the growth ofdairying in Kenya. These services continued to improve until 1979 when the peak of about542,000 inseminations were performed, out of which 9% were carried out on zebu animals.This figure dropped dramatically by 1992 to 195,000 inseminations with only 1% beingconducted in zebu cows (KNAIS, 1994). The number of inseminations by KNAIS hascontinued to drop with only about 85,000 and 60,000 inseminations in 1996 and 1997,respectively. In contrast, the number of inseminations by private AI providers (includingcoops and private veterinarians) has been rising steadily, surpassing those provided byKNAIS in 1995 when about 97,000 inseminations were conducted. This figure rose to about113,000 inseminations in 1996, excluding those inseminations by informal service providersand individuals on their own farms. The dramatic decline in the number of inseminationsprovided by KNAIS since 1981 has greatly affected the growth and genetic quality of thedairy cattle population, but the private sector is evidently rising to the challenge of filling thegap left by the declining services by KNAIS. The Livestock Recording Centre, started in1974, has been a useful programme for progeny testing and making available quality bullsfor CAIS and private large scale farms.Though increasing participation through the private sector (e.g., dairy co-ops, privateveterinarians and companies such as American Breeders Service Ltd and World Wide SiresLtd) may have improved the situation somewhat, many smallholder farmers were still foundto solely rely on private, communal or NGO provided bulls for breeding. The governmentcurrently provides bulls through the FINNIDA supported Livestock Development Project(LDP) to individual farmers for use by local communities at a fee. The LDP, which isbasically an extension project started in 1991, operates in the Lake Basin (Nyanza andWestern Provinces) and Rift Valley. By 1995 the LDP had established 335 bull schemesproviding services at KSh. 100 per bull service. In the absence of efficient AI services andwith the high price of more than KSh. 25,000 (US$ 400) for average quality heifers,upgrading through bull services provide a useful alternative for those wishing to increase41
dairy genes of their animals. The obvious disadvantage of spread of reproductive diseaseshowever remains.Access to credit, for the purchase of services and inputs, is considered essential in solving thefinancial constraints at the farm level. As already stated, many dairy co-operatives areincreasingly linking their marketing activities to the provision of input services. But access tocredit inputs through coops mainly occurs in Central Province, especially Kiambu. In otherareas, dairy co-operatives have not taken off or are still in their infancy. Formal creditinstitutions such as banks, charge relatively high interest rates beyond that which mostsmallholders can afford.Extension and veterinary servicesThe effectiveness of government extension, including the provision of clinical and preventivehealth services, has been declining for some time as a result of government budgetaryconstraints and the transition to privatised services. Present evidence shows low extensionstaff to farmer ratios, which continue to decline, as a result of stoppage of further staffrecruitment by the government. The extension staff to farmer ratios range from 1:500 inCentral Province to about 1:1,230 in Western Kenya. These ratios will continue to declineunless the private sector (e.g., private processors) begins to provide similar services. Arecent study in Kiambu shows that fewer than 50% of farmers receive livestock extensionadvice (Staal et al., 1998).The MoA has defined those goods whose delivery it considers public, private or shared; butthe privatisation of the provision of those services that are considered private goods ishappening quite slowly, despite the continued reduction in public budgetary allocations tothese services. As a result, privatisation is happening by default but this is not adequate tofill the gap created by the continuing divestiture of government services.As already stated, farmer groups are increasingly playing an important role in providingsome veterinary services (e.g., clinical and AI) to smallholders that are linked to their milkmarketing services especially in Kiambu District. This institutional linkage provides anopportunity to reduce costs of service provision and ease payment recovery, therebyimproving the long-term viability of both the collection and service functions. A major gaphowever remains in the provision of technical information to improve productivity.42
Presently about 200 veterinarians are in formal private practice, and many more practiceinformally, especially since the stoppage of automatic government employment of veterinarygraduates in 1990. Most clients of private veterinarians are the better resource-endowedfarmers who can afford their services (Wamukoya et al., 1995). Where farmer groups arepresent, most smallholder farmers prefer the cheaper farmer-group provided veterinaryservices that they can also obtain on credit. The EU supported Kenya VeterinaryAssociation Privatisation Scheme has boosted the number of formally registered privatevets, which has attracted 41 successful loanees since its inception in 1995. Many morehave not been successful due to lack of collateral. A "subsidised" private service isprovided by government veterinarians and para-veterinarians who use public facilities at nocost and so can afford to charge low rates for their services. As the possibilities for suchactivity decline with continued reforms, and as private services respond to demand, it isanticipated that the privatisation of veterinary clinical services and liberalisation of inputsupply and AI will improve efficiency in the dairy farming community. There remainsconsiderable uncertainty, however, as to the level of service that the private sector will bewilling to provide in areas where dairying is less market-oriented.Agricultural trainingPrivate and publicly provided formal training for the agricultural sector is available at severallevels from farmer training centres, to certificate, diploma and degree colleges. Certificateleveltraining in animal husbandry takes place at several Animal Health and Industry TrainingInstitutes situated at Kabete, Ndomba, Bukura and Nyahururu; certificate and diploma-leveltraining in dairy technology is provided at the Dairy Training Institute-Naivasha; and, degreeleveltraining is provided at Egerton University, University of Nairobi, Moi University andBaraton University, which is privately funded.5.4 Access Roads and Water SupplyMost dairy production areas have good seasonally passable road networks but which arerarely maintained. The lack of maintenance is major limiting factor for milk collection andtransportation to markets, particularly in Nyandarua and Kericho Districts. Instances of milkwastage, especially during the rains are common in these areas. An estimated 30% of milkproduction from these districts is lost annually due to the poor state of roads (MoA, 1996).Poor access to water is also of great concern in many areas including those with relativelygood market and roads infrastructure such as Kiambu District.43
5.5 Donor Participation in the Dairy sub-SectorMany bilateral and multi-lateral donors and NGOs have assisted dairy development in Kenyaover the years. The major bilateral donors that are presently involved are: the NetherlandsGovernment presently supports the Dairy Programme at KARI; Finnish Governmentsupports the Livestock Development Project; Danish International Development Agency(DANIDA) recently suported the develoment of the Dairy Master Plan and the revision ofboth the dairy policy and the Dairy Industry Act (Cap 336); GTZ supports smallholder dairygoat development in Central Province; Swedish International Development Agency (SIDA)supports dairying related community water development projects; IDRC supports anagroecosystem health project based at the University of Nairobi; and, the Department forInternational Development (DFID) of Britain supports KARI's second National AgriculturalResearch Programme (NARP II) 24 and the MoA/KARI/ILRI Smallholder Dairy Project.Multilateral agencies that are involved are the World Bank which supports the NationalExtension Project (NEP) and KARI's Regional Research Programmes (RRP), Food andAgricultural Organisation (FAO) supports training in dairy processing and European Union(EU) supports the animal health services privatisation priogramme. NGOs that are involvedare Heifer Project International (HPI), Farm Africa, and the Dutch Volunteer Services (SNV).5.6 Institutional LinkagesGood linkages to improve the efficient delivery of livestock services, coordination andsharing of information for dairy development among national institutions exist between MoAand KARI. However further improvement in linkages with other related institutions isrequired to foster this effort. Other national stakeholders with whom linkages need to bestrengthened include the national universities, farmer groups (e.g., cooperatives), NGOs, theprivate sector and donors. Strengthening of linkages between these institutions canenhance the capacity to undertake more integrated, inter-disciplinary dairy system researchand development, by better utilizing available knowledge, institutional and human resourcecapacities. Improving linkages between KARI, MoA and the national universities should be apriority, particularly Egerton and Nairobi Universities which have well established agriculturalfaculties. Both universities possess a large pool of trained manpower whose skills can betapped to contribute more to the national agricultural research agenda, besides presentmechanisms such as KARI's Agricultural Research Fund which mostly serves independentresearch activities. Collaborative research activities currently being initiated between theUniversity of Nairobi and the MoA/KARI/ILRI Smallholder Dairy Project to assess the public24 DFID's support to KARI's NARP II is scheduled to end in April, 199944
health hazards of informal milk marketing should serve as a model for similar collaborativearrangements in the future.5.7 Main Issues in Policy and Institutions.1. Underdeveloped infrastructure, especially access roads which are impassable duringrains, and poor water supply in many dairy producing areas.2. Uncertainty of appropriate policy guidelines for informal milk market agents whose rolehas increased tremendously in recent years. There is a lack of information on which tobase those guidelines.3. The difficulty farmers face in accessing input services including feed, veterinary and AIand the failure of the privately delivered input service provision to fill the gap left by thewithdrawal of government services.4. Unfair competition to private service providers from those still on government payroll.5. Role of KDB needs to be redefined to reflect the wishes of all stakeholders6. There is the need for decentralised feed quality testing centres. Currently, theseservices are only available centrally at KARI-NARL and KBS in Nairobi. Many farmerssuspect that the lack of response by cows to feeding is partly caused by poor qualityfeeds.7. The need for marketing institutions that link milk collection/marketing and livestockservice provision in some areas, including provision of suitable credit. There is a nearabsence of farmer groups in some areas to facilitate input and output service linkage.Where present, many farmer groups do not provide input services (Farmer groups inKiambu are a notable exception). The formal banking sector offers unaffordable creditdue to high interest rates and the performance of the specialised agricultural bankinginstitution - the Agricultural Finance Corporation - has greatly diminished in recent years.8. Low impact of government extension services with less than 50% of smallholder dairyfarmers accessing the services.9. Uncertainty of the impacts of liberalisation on input supply and extension services.10. Inefficient management and lack of effective farmer control in farmer groups particularlycoops.11. Uncontrolled livestock movement leading to resurgence of diseases in some areaswhere they had previously been effectively controlled.45
6. ReferencesBekure, S., de Leeuw, P.N., Grandin, B.E. and Neate, P.L.H. (1991) Maasai Herding, ILCAsystems study. International Livestock Centre for Africa. Addis Ababa, Ethiopia.Central Bureau of Statistics (CBS) (1994). Kenya population census. Volume 1. GovernmentPrinter, Nairobi, Kenya.Central Bureau of Statistics (CBS) (1995). Statistical Abstract. Ministry of Planning andNational Development, Nairobi, Kenya.Central Bureau of Statistics (CBS) (1998). Poverty in Kenya. Volume II: Poverty and SocialIndicators. CBS and Human Resources and Social Services Department, Ministry ofNational Planning, Nairobi.Conelly, W.T. (1998). Colonial era livestock development policy: Introduction of improveddairy cattle in high-potential farming areas of Kenya. World Development 26 (9): 1733-1748Dairy Development Policy (1993). Ministry of Livestock Development, NairobiDeem, S.L., Perry, B.D., Katende, J.M., McDermott, J.J., Mahan, S.M., Maloo, S.H.,Morzaria, S.P., Musoke, A.J. and Rowlands J.G. (1993). Variations in prevalence of tickbornediseases in Zebu cattle by agro-ecological zone: implications for East Coast feverimmunization. Prev. Vet. Med. 16: 171-187FAO. (1978). Report on the Agroecological Zones Project. Methodology and Results forAfrica. World Soil Resources Report, 48/1. RomeGitau, G. K. (1998). A study of factors influencing endemic stability and instability totheireliosis and babesiosis on dairy production in Murang'a District, Kenya. PhD Thesis.University of NairobiGitau, G.K., O'Callaghan, C.J., McDermott, J.J., Omore, A.O., Odima, P.A., Mulei, C.M., andKilungu J.K., (1994a). Health and productivity of cattle in smallholder dairy farms in KiambuDistrict, Kenya: Prev. Vet. Med., 21: 155-166.Gitau, G.K., McDermott, Waltner-Toews, D., Lissemore, K.D., Osumo, J.M. and Muriuki, D.,(1994b). Factors influencing calf morbidity and mortality in smallholder dairy farms in KiambuDistrict of Kenya. Prev. Vet. Med., 21: 167-177.Gitau, G.K., McDermott, J.J., Adams, J.E., Lissemore, K.D., and Waltner-Toews, D.,(1994c). Factors influencing calf growth and daily weight gain on smallholder dairy farms inKiambu District, Kenya. Prev. Vet. Med., 21: 179-190.Gitau, T. 1995. Bovine Lameness in Small-scale Dairy Farms in Kikuyu Division, KiambuDistrict. MSc thesis. University of Nairobi.Jaetzold, R. and Schmidt, H. (1983). Farm Management Handbook of Kenya - NaturalConditions and Farm Management Information. Ministry of Agriculture, Nairobi, Kenya.Kadohira, M., McDermott, J.J., Shoukri, M.M and Kyule, M.N. (1997). Variations in theprevalence of antibody to brucella infection in cattle by farm, area and district in Kenya.Epidemiology and Infection 118: 35-41.KARI (Kenya Agricultural Research Institute), 1996. Priority Setting for the KARI DairyResearch Programme. Kenya Agricultural Research Institute, 25pp46
Karlen, 1995. A survey of co-operative societies active in agricultural marketing in kenya.Kenya-Nordic Co-operative Development programme, Nairobi (Unpubished).KNAIS, 1994. Kenya National Artificial Insemination Services. Revision of Plan 1993/94 –1995/96. Department of Veterinary Services, NairobiKCC, 1997. Annual report. Kenya Co-operative Creameries, Nairobi.Kenya Dairy Master Plan.1991. Ministry of Livestock Development, NairobiKenya Soil Survey. (1982). Exploratory Soil Map and Agroclimatic Zones of Kenya. Nairobi.Kurwijila, L.R., Kiptarus, J., Kasolia, J.D., Migero, J. and Kirui, J.W. 1997. Milk marketing inKenya: A case study of Nakuru District. Ministry of Agriculture, Nairobi. 34ppLatif, A.A., Rowlands, G, J., Punyua, D.K., Hassan, S.M. and Capstick, P.B. 1995. Anepidemiological study of ticks and tick-borne diseases and their effects on productivity ofzebu cattle under traditional management in Rusinga Island, Western Kenya. Prev. Vet.Med. 22:7169-181.Maloo, S.H., Thorpe, W., Ngumi, P.N., and Perry, B.D. 1994. Systematic epidemiologicalstudies to identify and resolve constraints to smallholder dairy production in coastal lowlandsof Kenya. In: Proceedings of the 7th ISVEE Symposium. 15th - 19th August, 1994. Nairobi,Kenya. The Kenya Veterinarian 18(2): 359.Ministry of Agriculture (MoA). 1995-97. Annual Reports. Animal Production Division. HillPlaza, Nairobi.MOAC/SUA/ILRI, 1998. The Tanzanian Dairy Sub-Sector: A <strong>Rapid</strong> <strong>Appraisal</strong>: Volumes 1-3.Research Report of the Ministry of Agriculture and Co-operatives (Tanzania), SokoineUniversity of Agriculture (Tanzania) and the International Livestock Research Institute(Kenya). Nairobi.Moll, G., Lohding, A. and Young, A.S. 1984. Epidemiology of theileriosis in the Trans-MaraDivision, Kenya: Husbandry and disease background and preliminary investigations ontheileriosis in calves. Prev. Vet. Med. 2: 801-831.Nicholson, C.F., Thornton, P.K., Mohamed, L., Muinga, R.W., Elbasha, E.H., Staal, S.J. andThorpe, W. (1998). Smallholder Dairy Technology in Coastal Kenya: An Adoption andImpact Study (Draft Report). International Livestock Research Institute, NairobiOdima, P.A., McDermott, J.J. and Mutiga, E.R. 1994. Reproductive performance of dairycows on smallholder dairy farms in Kiambu District, Kenya: Design, Methodology andDevelopment constraints. In: Proceedings of the 7th ISVEE Symposium. 15th - 19th August,1994. Nairobi, Kenya. The Kenya Veterinarian 18(2): 366.Ombui, J.N., McDermott, J.J. Arimi, S.M., Mbugua, S.K, Kakuko, S., and Kilungo, J.K. 1995.Current and potential roles of dairy cooperative societies in Kiambu District, Kenya. EastAfrican Agricultural and Forestry Journal. 61(2):129-140.Omore, A.O., 1997. Epidemiology and economics of mastitis in the smallholder dairy sectorof Kiambu District, Kenya. PhD Thesis, University of Nairobi. 224ppOmore, A.O., McDermott, J.J., Arimi, S.M., Kyule, M.N. and Ouma, D. 1996a. A longitudinalstudy of milk somatic cell counts and bacterial culture from cows on small holder dairy farmsin Kiambu District, Kenya. Prev. Vet. Med. 29:77-89.Omore, A.O., McDermott, J.J., Gitau, G.K., 1996b. Factors influencing production onsmallholder dairy farms in central Kenya. In: Proceedings of the 5th Scientific Conference of47
the Kenya Agricultural Research Institute (KARI). 14th - 16th October, 1996. KARIHeadquarters, Nairobi, Kenya. pp 370-379Owango, M.O., Staal, S., Kenyanjui, M., Lukuyu, B. and Njubi, D. and Thorpe, W. 1996.Liberalisation in the Livestock Industry: Evidence of Impact from Dairy Co-operativeSocieties in Central Province, Kenya. Paper presented at the 5th Scientific Conference of theKenya Agricultural Research Institute, October 14-16, 1996, Nairobi, Kenya. pp345-36.Peeler, E.J., and Omore A.O. 1997. Manual of livestock production systems in Kenya. 2 ndEdition. Kenya Agricultural Research Institute, Nairobi. 138pp.Rey, B., Thorpe, W., Smith, J., Shapiro, B., Osuji, P., Mullins, G. and Agyemang, K. (1993).Improvement of dairy production to satisfy the growing consumer demand in sub-SaharanAfrica. A Conceptual Framework for Research. International Livestock Centre for Africa(ILCA). 13pp.Roderick, S., (1995). Pastoralist cattle productivity in a tsetse infested area of south westernKenya. PhD Thesis. Dept. of Agriculture. Veterinary Epidemiology and Economics ResearchUnit, Reading University, England.Semenye, P.P., (1987) Factors influencing Maasai cattle productivity in Kajiado district,Kenya. PhD thesis, University of Nairobi.Staal, S. and Omore A.O. 1998. The use of farmer recall versus direct measurement ingathering lactation data: lessons from Kenyan smallholder dairy systems. In: Proceedings ofThe KARI/APSK/ILRI/BSAS Conference on Foods Lands and Livelihoods: Setting ResearchAgendas for Animal Science. Nairobi, Kenya, Janyary 27-30, 1998. pp184-185.Staal, S., Chege, L., Kenyanjui, M., Kimari, A., Lukuyu, B., Njubi., Owango, M., Tanner, J.,Thorpe, W. & Wambugu, M. 1998. Characterisation of dairy systems supplying the Nairobi milkmarket. KARI/MoA/ILRI Collaborative Dairy Research Programme, ILRI, Nairobi, pp. 85.Staal, S.J. and Mullins, G.R. 1996. Dairy consumption and its determinants in coastal Kenya.international Livestock Research Institute, Nairobi. 47pp.Survey, 1997. Survey conducted for this rapid appraisal of the dairy sub-sectorTanner, J.C., McCarthy, N.A.,. and Omore A.O. 1998. Why shorten calving intervals onsmallholder dairy farms in East Africa? In: Proceedings of The KARI/APSK/ILRI/BSASConference on Foods Lands and Livelihoods: Setting Research Agendas for AnimalScience. Nairobi, Kenya, Janyary 27-30, 1998. pp190-191.Wamukoya, J., Gathuma, M and Mutiga, E.R. 1995. Spontaneous private veterinary servicesevolution in Kenya since 1988. In: Proceedings of the FAO electronic conference onpriniciples for rational delivery of public and private veterinary services. 6p.World Bank (1989). Sub-Saharan Africa. From crisis to sustainable growth: A long-termperspective study. World Bank. Washington D.C.48
Appendix 1: Research Teams and Terms of ReferenceResearch teamsThe collection and analysis of data were conducted jointly by three teams drawn from thethree institutions represented in SDP The three teams were:Analysis of the Dairy Production Systems:Dr. M. Owango - Animal Nutritionist, Head of Animal Production Programme NARC,Muguga, KARI ; Assistant Manager - SDPMr. B. Lukuyu - Senior Technical Officer – NARC, Muguga, KARIMr. F. Musembi - Agricultural Economist - NARC, Muguga, KARIAnalysis of Economic and Structural Aspects:Dr. M. Kenyanjui - Veterinarian, Senior Field Research Technologist, Market-orientedSmallholder Dairy, ILRIDr. A. Omore - Veterinary Epidemiologist, Research Officer – KARI/ILRI.Analysis of Policy and Institutional Issues:Mr. H. Muriuki - Assistant Director, Animal Production , Ministry of Agriculture,Headquarters; Manager - SDPMr. G. Gichungu - Animal Production Scientist, Ministry of Agriculture, Headquarters.Report-Editing:Dr. A. Omore - Veterinary Epidemiologist, Research Officer – KARI/ILRI.Dr. S. Staal - Agricultural Economist, Market-oriented Smallholder Dairy - ILRITerms of Reference for the <strong>Rapid</strong> <strong>Appraisal</strong>The terms of reference (TOR) for each thematic research team were:TOR for Economic and Structural Analysis Team1. Identify the physical and geographical distribution of dairy production, processing,markets and consumption. This includes quantification of flows through alternativemarket channels and illustrated by diagrams of quantities and percentages for nationalmarket and smaller market components.2. Assess the historical trends in output supply and demand, and project the changes indemand over the next 20 years.3. Assess issues related to input supply and demand patterns, including for heifers andfeeds.4. Measure the economic viability of all market components of the sub-sector.5. Quantify the effects of macro-economic and regional/world market factors oncompetitiveness of domestic dairy production and processing.49
TOR for Production Systems Analysis Team1. Identify the current principal milk sheds and their major consumption centres, and theareas with potential as milk sheds to serve milk deficit areas now and in the next 20years.2. Describe briefly the history of dairy development in each milk shed.3. For each milk shed, document in as quantitative terms as possible, the currentproduction systems (livestock species and breeds; herd/flock sizes and structures;milking and calf management; breeding practises; feeding resources and systems;disease risks and health management practises); and, their output and input marketlinkages (including quantities of milk consumed by progeny and by the producerhousehold, and how much is marketed in what form). Put these descriptions into thecontext of the farm and land use systems of the milk shed.4. For each major production system in each milk shed, identify the current majorconstraints and opportunities (bio-physical, technical, social, institutional and policyissues), and those expected in five, 10 and 20 years.5. Highlight the factors driving changes in the production systems, their likelyconsequences and the resultant research and development challenges.TOR for Policy and Institutional Analysis Team1. Describe the evolution of dairy development nationally, including: changes in stated andeffective public policy towards dairy production and marketing, and consumption, centraland local government, donor and NGO activities in the dairy sector, and the evolution ofinstitutions in the dairy sub-sector dealing with policy-making and investment, extension,training/education, disease control and animal health, reproductive services, input supplyand feed, processing and marketing, and credit.2. Describe the current and planned policy interventions, institutional re-organisation anddonor activities.3. Assess what is known about how policy at the central and local government levels hasimpacted on smallholder dairy development since 1960, and priority knowledge gaps foreffective action to promote greater smallholder involvement, especially from the poorergroups.50
Appendix 2 : Agro-climatic ZonesAgro-climatic zones classification 25 0 100North RiftN. EasternWesternCentral RiftCentralCoastSouthern RiftEasternZONEZone 1 to 4Zone 5 to 7Kilometers20025 ACZ 1-4 represent areas with humid to semi-humid zones with Rainfall/evaporative potentialgreater than 40% and are suitable for arable agriculture. ACZ 5-7 represent semi-arid to very aridzones with Rainfall/evaporative potential less than 40% and are suitable for rangeland cattle keepingonly51